Financial Dashboards help to identify key final social performance indicators properly and simply communicate important financial information. It has multiple uses in monitoring sales revenue, working capital, operating expenses, and cash flow. Financial dashboards in Excelcan be used to compare financial data with information and also make a plan based on performance. Let us explore more about financial dashboard templates.
One of the major benefits of using financial dashboard templates is that you get a quick and eye-catching visual picture of financial data. The major KPIs and metrics covered in the financial dashboards in Excel include:
Benefits of Using Financials Dashboards Templates
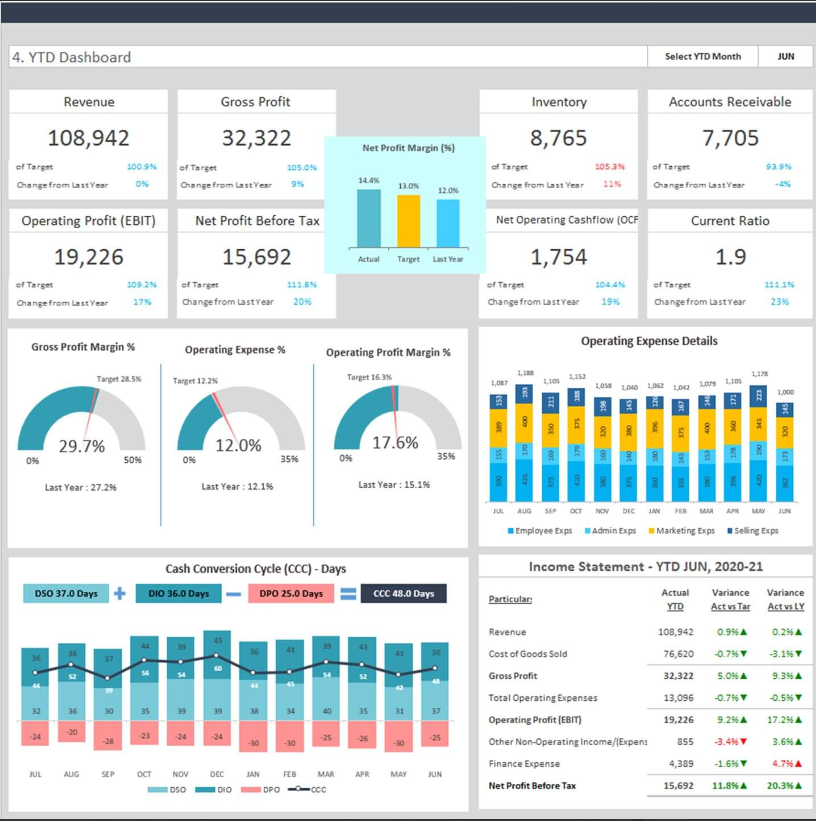
- Revenue: Target achievement and growth over the last period.
- Gross profit: It is the product’s contribution to the business to cover operating expenses and finance costs.
- Non-profit: It is the residual amount after paying operating costs and finance costs for the shareholders.
- Operating profit: These are the earnings before tax and interest.
- Operating expense: It is the segregation of operating expense details into employee expense, selling expense, admin expense, and marketing expense.
- Key balance sheet indicators: These include the current ratio, accounts receivable, and inventory.
- Operating cash flow: This is the net actual operating cash flow picture compared with the target.
The right financial dashboard template will help- you compile and place all relevant indicators in a single place, thus giving a complete overview, vital information, and other necessary details. One can monitor revenue and income streams, profitability, cash flow, and capital and track all relevant data in a single layout with a financial dashboard template in Excel. These templates make it easier to compare data points and look at trends, helping to make smarter and more efficient choices.
What are the Key Features of a Dashboard Template?
- Eye-catching design and customizable
- It is completely editable and easy to use.
- You can easily change the sample data with your data.
- It provides key financial insights for the finance team and CFO by giving them quick details of revenue, operating expenses, cash flow, and profitability.
- The template spreadsheets are ready for printing
- You can also get key financial performance indicators in one dashboard
- You can just enter your data, and the dashboard will be prepared, and you can start using it.
- It comes with a guide to unlock all the elements in the dashboard
- Most financial dashboard templates also come with professional support like video tutorial guides on how to navigate and use the template, professional services to customize the template as per your business needs, and post-purchase help and support.
Guide to Using Financial Dashboard Template in Excel
- Open the dashboard template, go to the ‘indicators’ menu, and choose the start month of the year
- Then go to the ‘Enter Data’ menu, remove the sample data and enter your actual data in the respective cells. These formula cells are locked and cannot be edited without a password.
- Go to the monthly Dashboard menu and select the month name to see a monthly picture of performance indicators.
- Go to the ‘YTD Dashboard’ menu and select the month name to see the year-to-date picture of performance indicators.
- After this, each page will be ready for printing. Remember, the templates are password-protected to avoid mistakes and accidental errors.
Takeaway
Therefore, financial dashboard templates are the easiest and quickest way of monitoring finances in any organization. They help enhance the strategic and analytical efforts related to major financial aspects.
You may be interested: