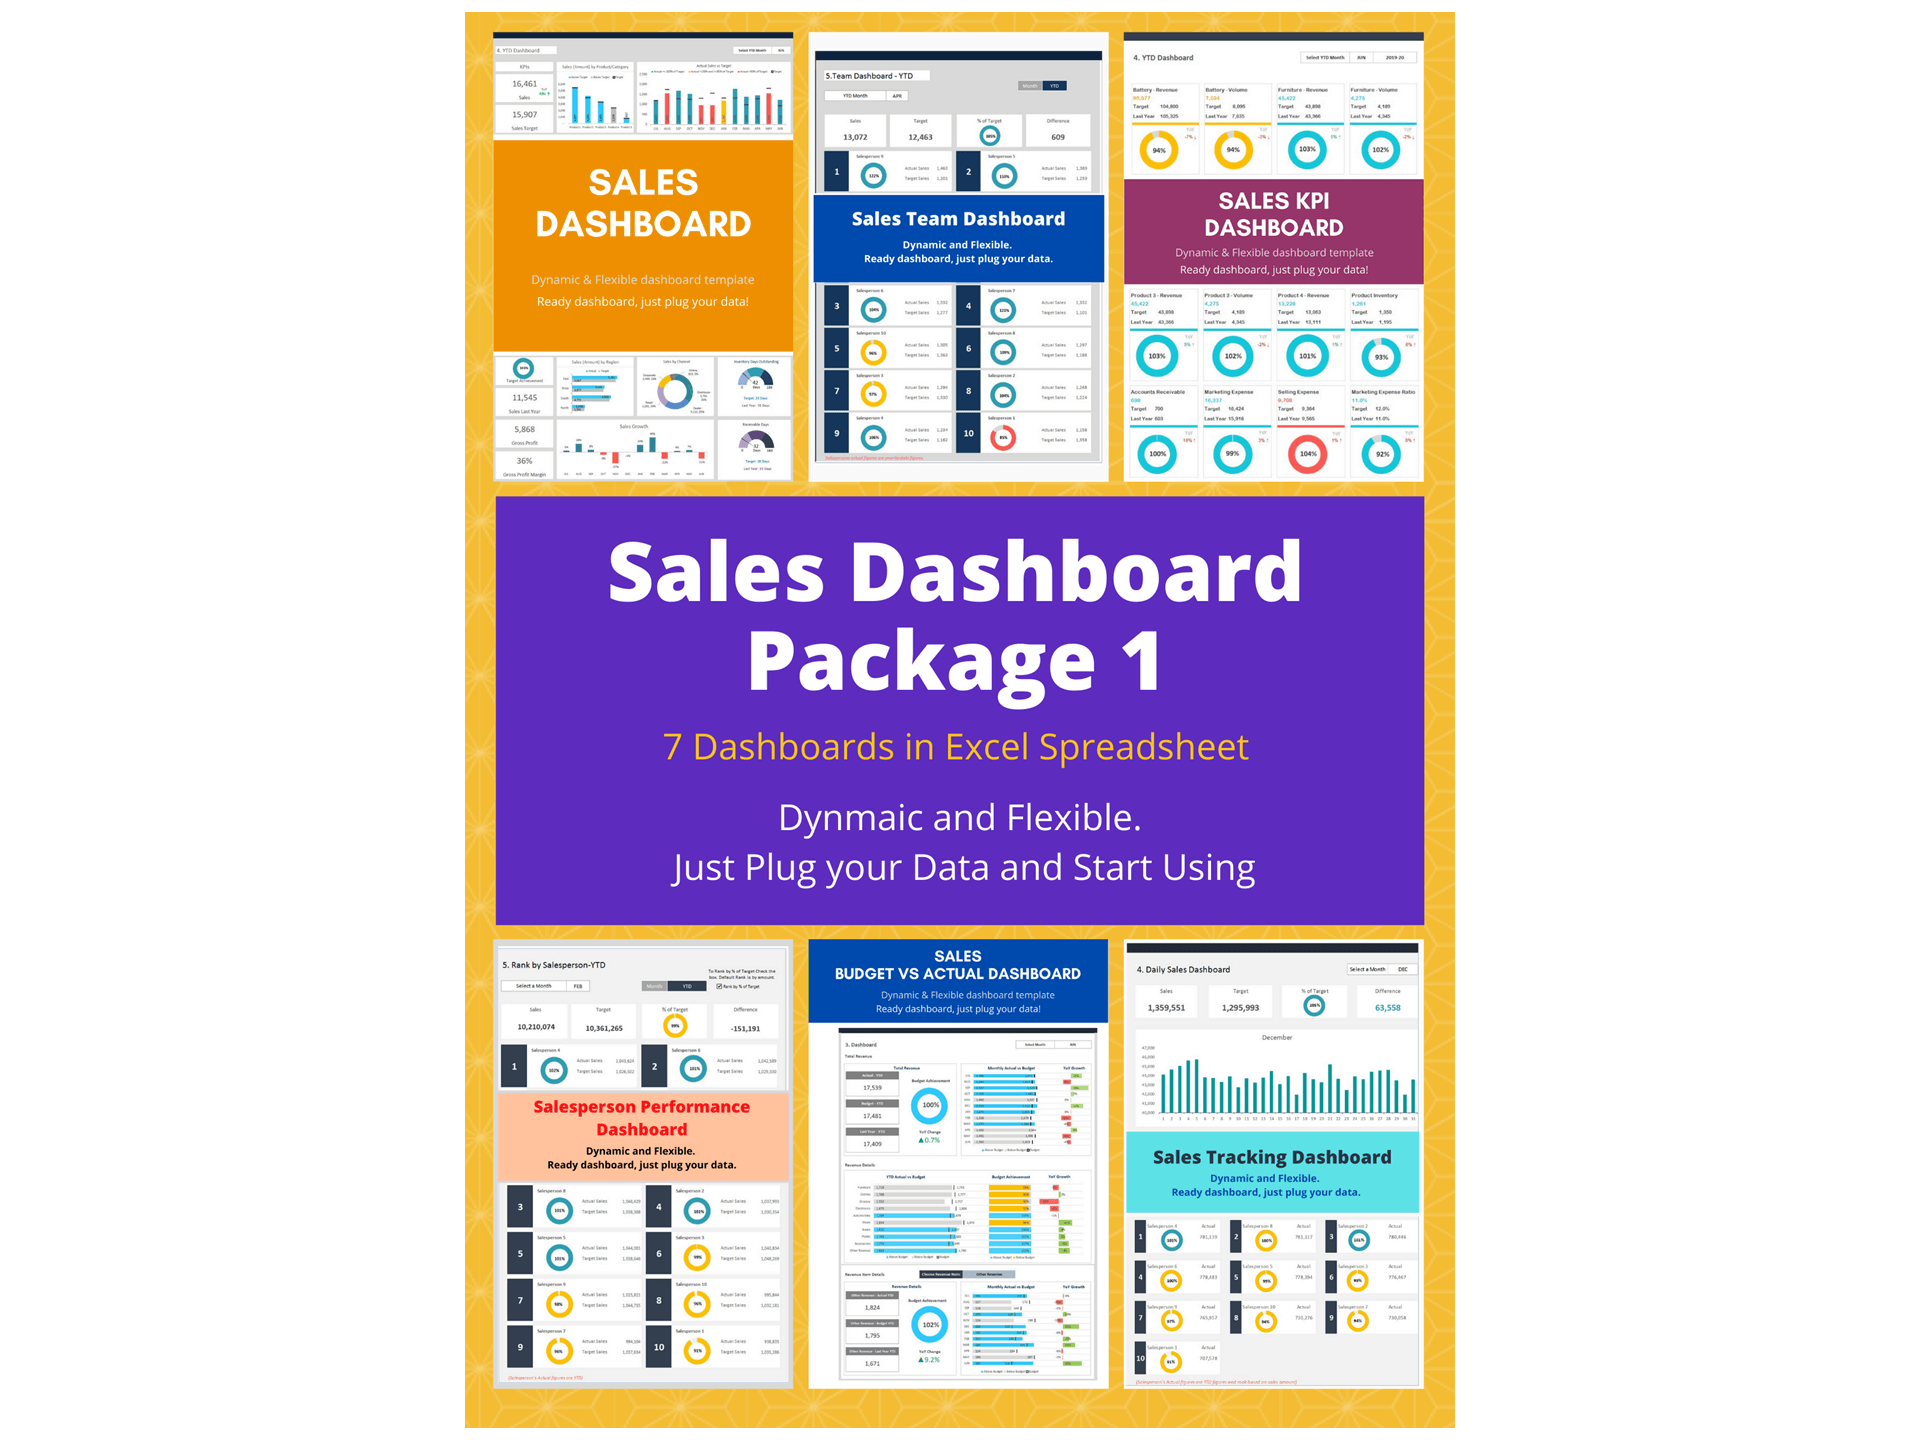
Sales Team Dashboard Excel Template and Google Sheets
The Sales Team Dashboard Excel Template is a powerful Dashboard in Excel designed to help businesses monitor and manage the performance of their sales teams effectively. This Sales Team Dashboard provides a centralized view of important sales activities, enabling managers to track individual and team contributions in a clear and organized format.
As a comprehensive Sales Dashboard, the template displays essential metrics such as total sales, sales targets, deals closed, and revenue generated by each team member. By highlighting key Sales KPI indicators, the dashboard allows managers to measure productivity, identify top performers, and recognize areas that require improvement.
The template is built as a Dynamic Dashboard, meaning charts and performance indicators automatically update when new sales data is entered. This makes reporting more efficient and ensures that sales leaders always have access to accurate and up-to-date information.
As a practical Business Dashboard, it helps organizations analyze Sales Performance, improve team accountability, and strengthen sales strategies. By presenting performance insights visually, the Sales Team Dashboard Excel Template enables better decision-making and helps businesses drive higher productivity, stronger team collaboration, and sustainable revenue growth.
Sales Team Dashboard Excel Template: Driving Success in Sales Performance
In the dynamic world of sales, keeping a close eye on your team's performance is crucial for achieving targets and maximizing revenue. To facilitate effective sales management and empower businesses to make data-driven decisions, we proudly introduce our Sales Team Dashboard Excel template. This comprehensive tool is designed to provide a holistic view of your sales team's performance, enabling you to track key performance indicators (KPIs), monitor progress, and drive success.
Key Features of the Sales Team Dashboard Excel Template
Our Sales Team Dashboard Excel template is a versatile and user-friendly tool that offers a wide range of features to help you optimize your sales strategies and boost productivity. Here are some key features:
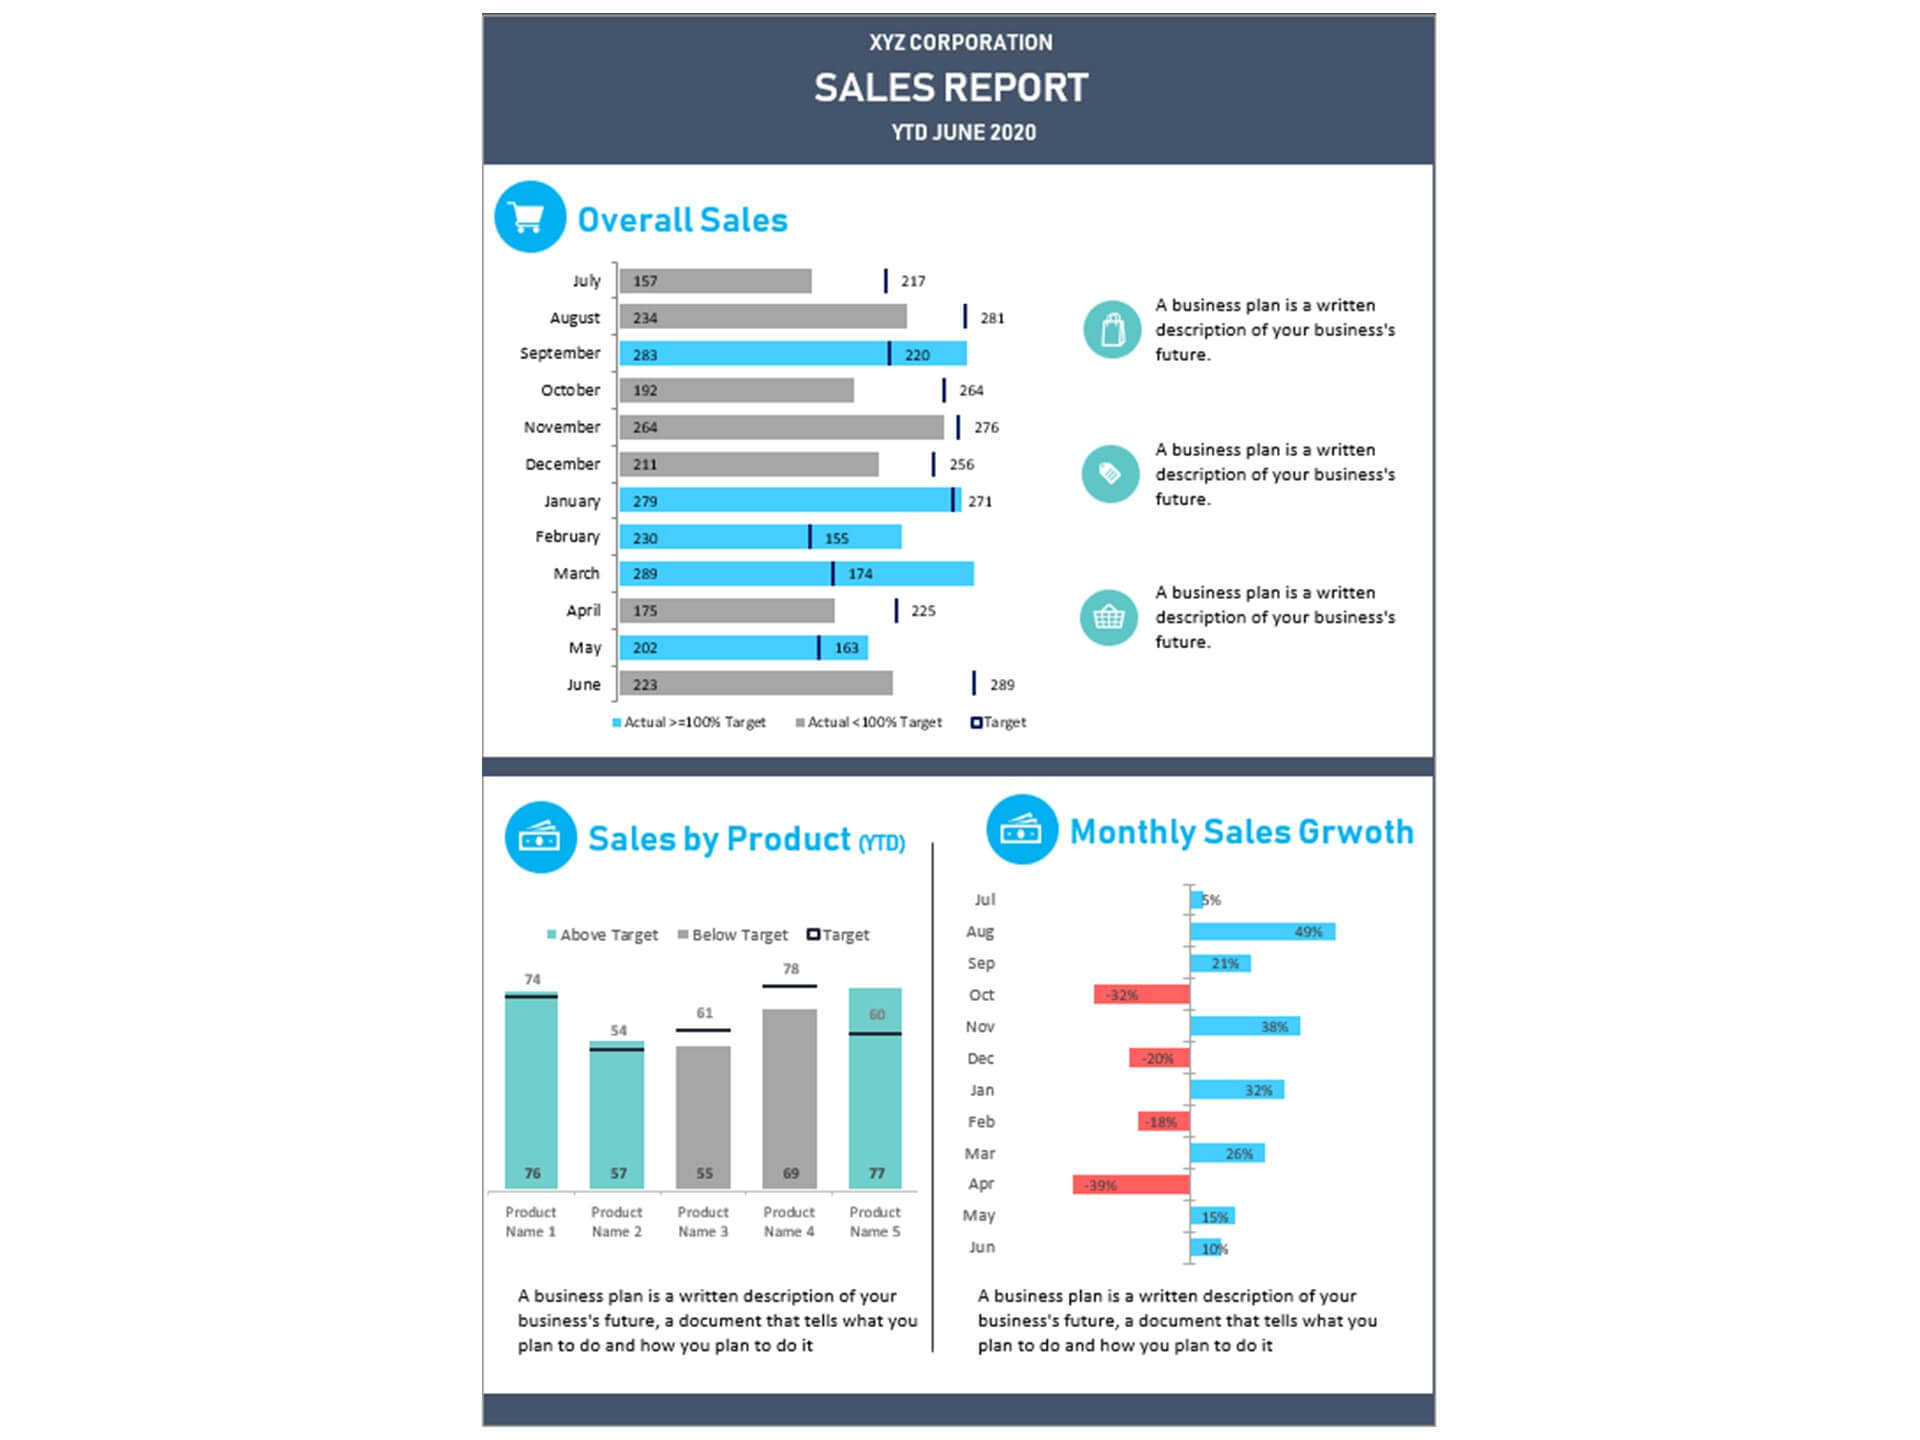
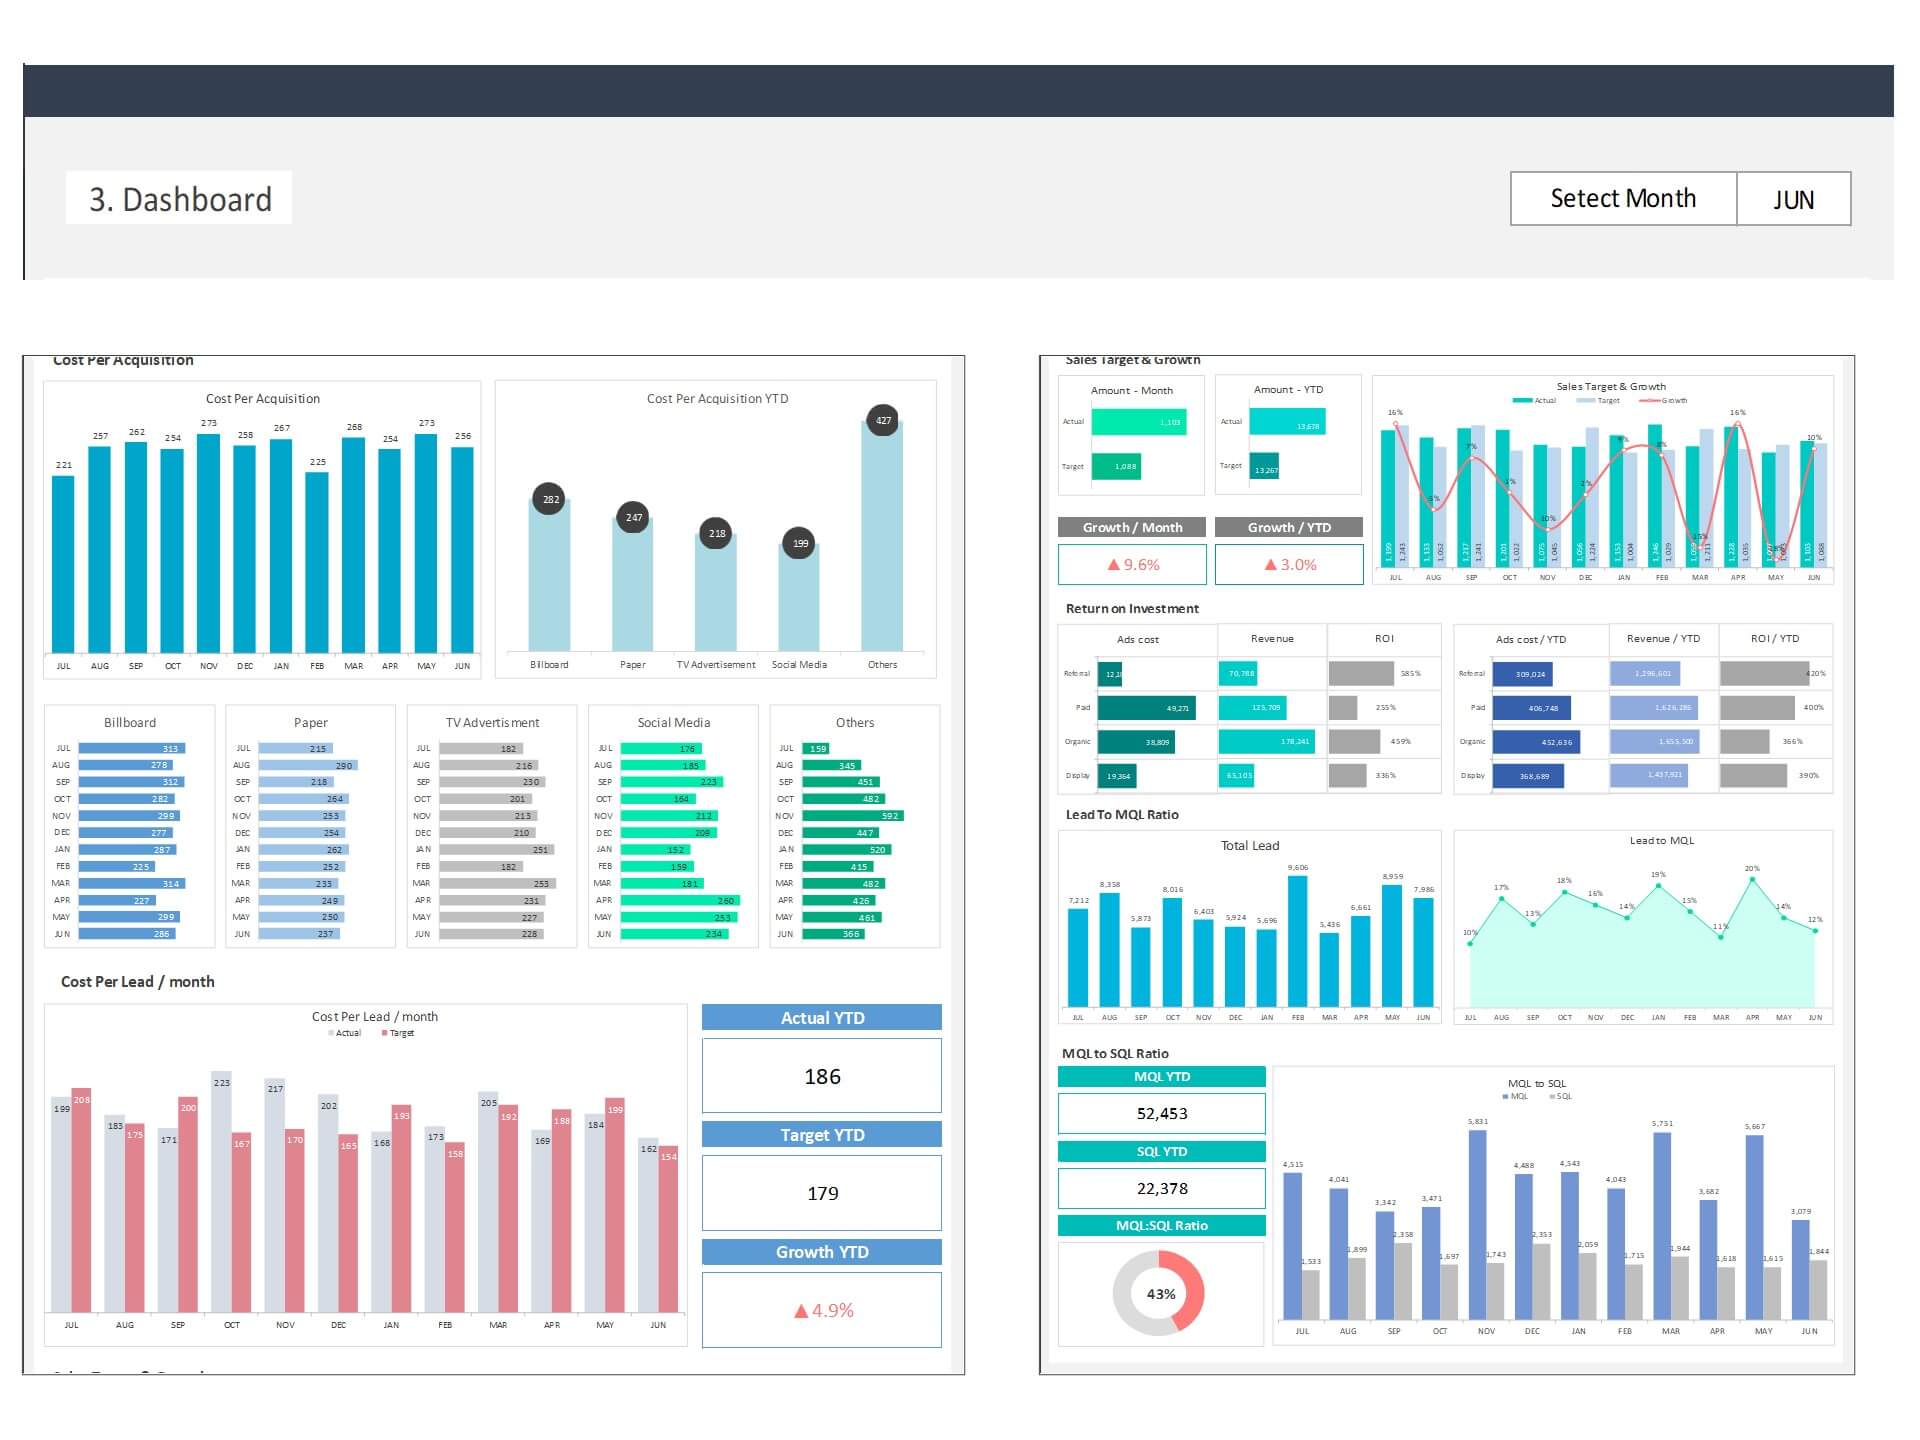
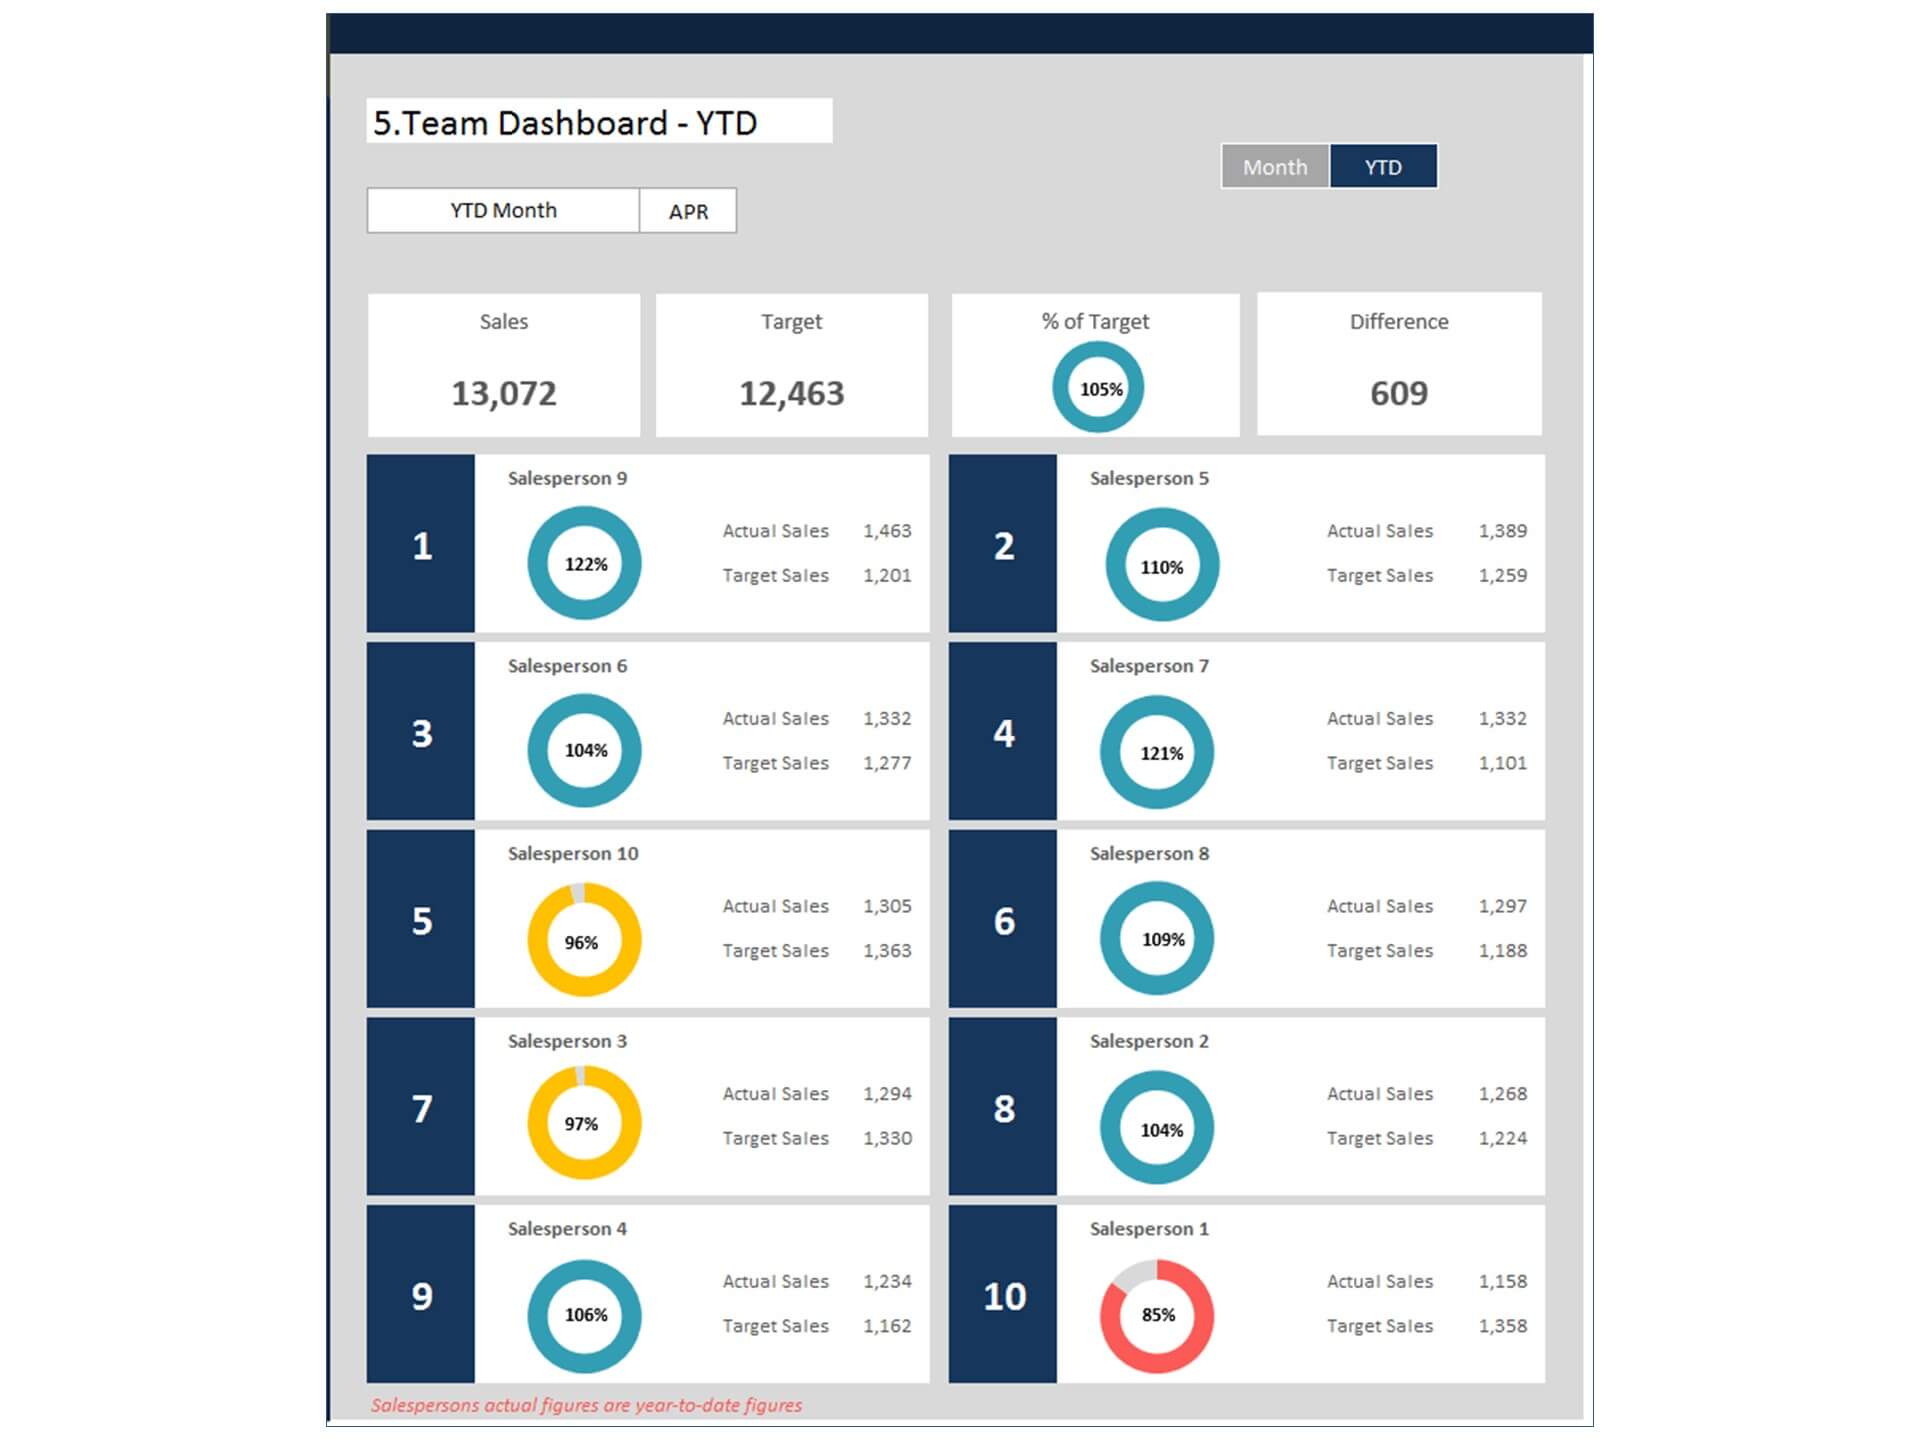
- Overall Sales Performance: Gain a comprehensive overview of your sales team's performance, including total sales, revenue, and profit. Monitor these key metrics on a monthly, quarterly, or annual basis to identify trends and areas for improvement.
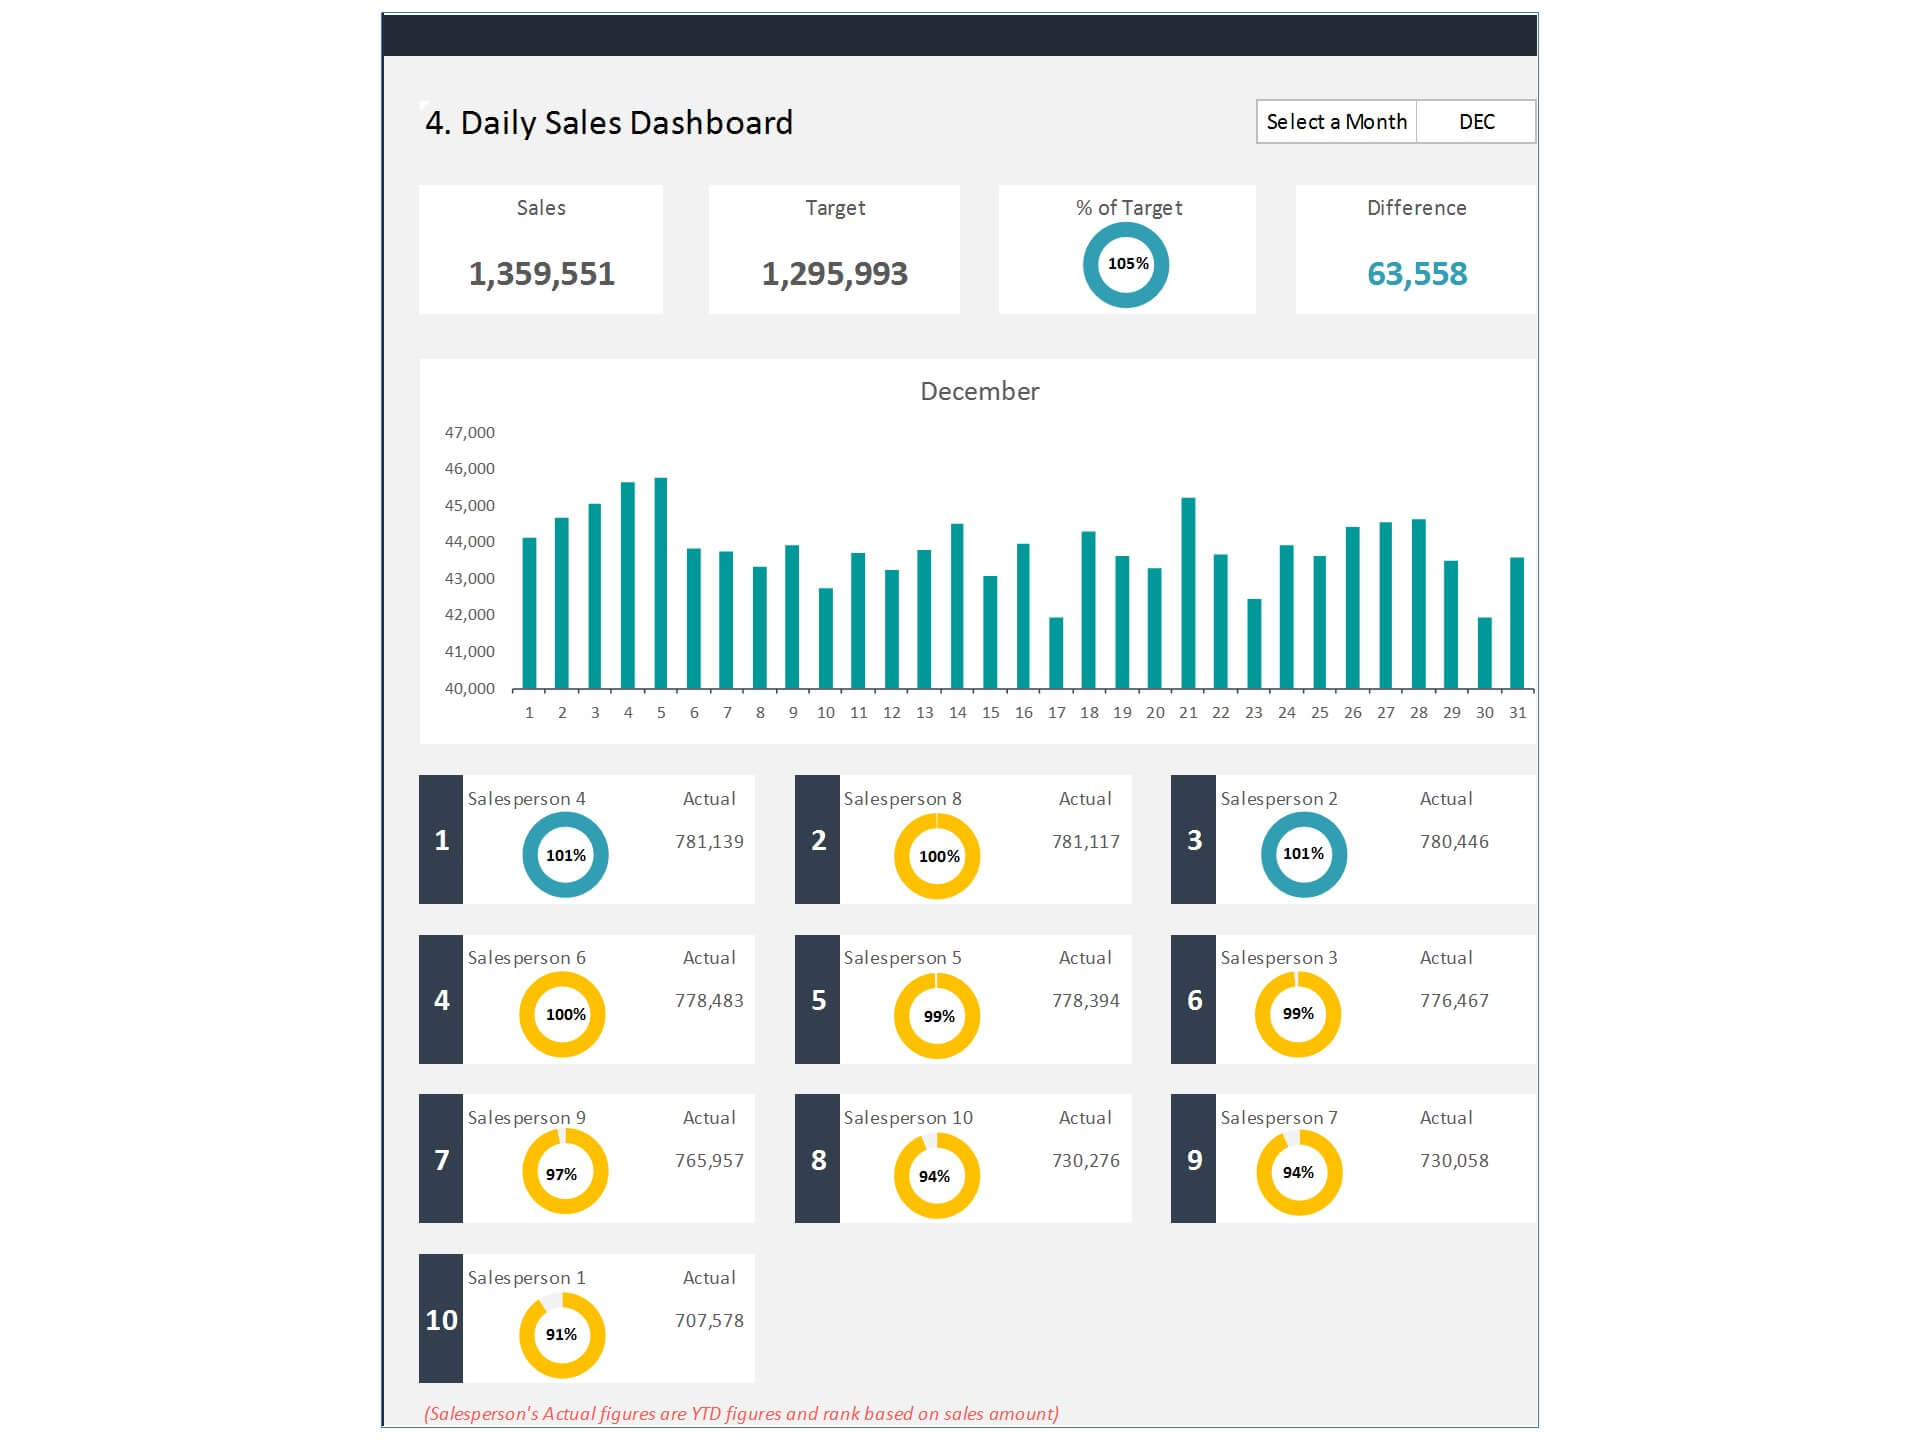
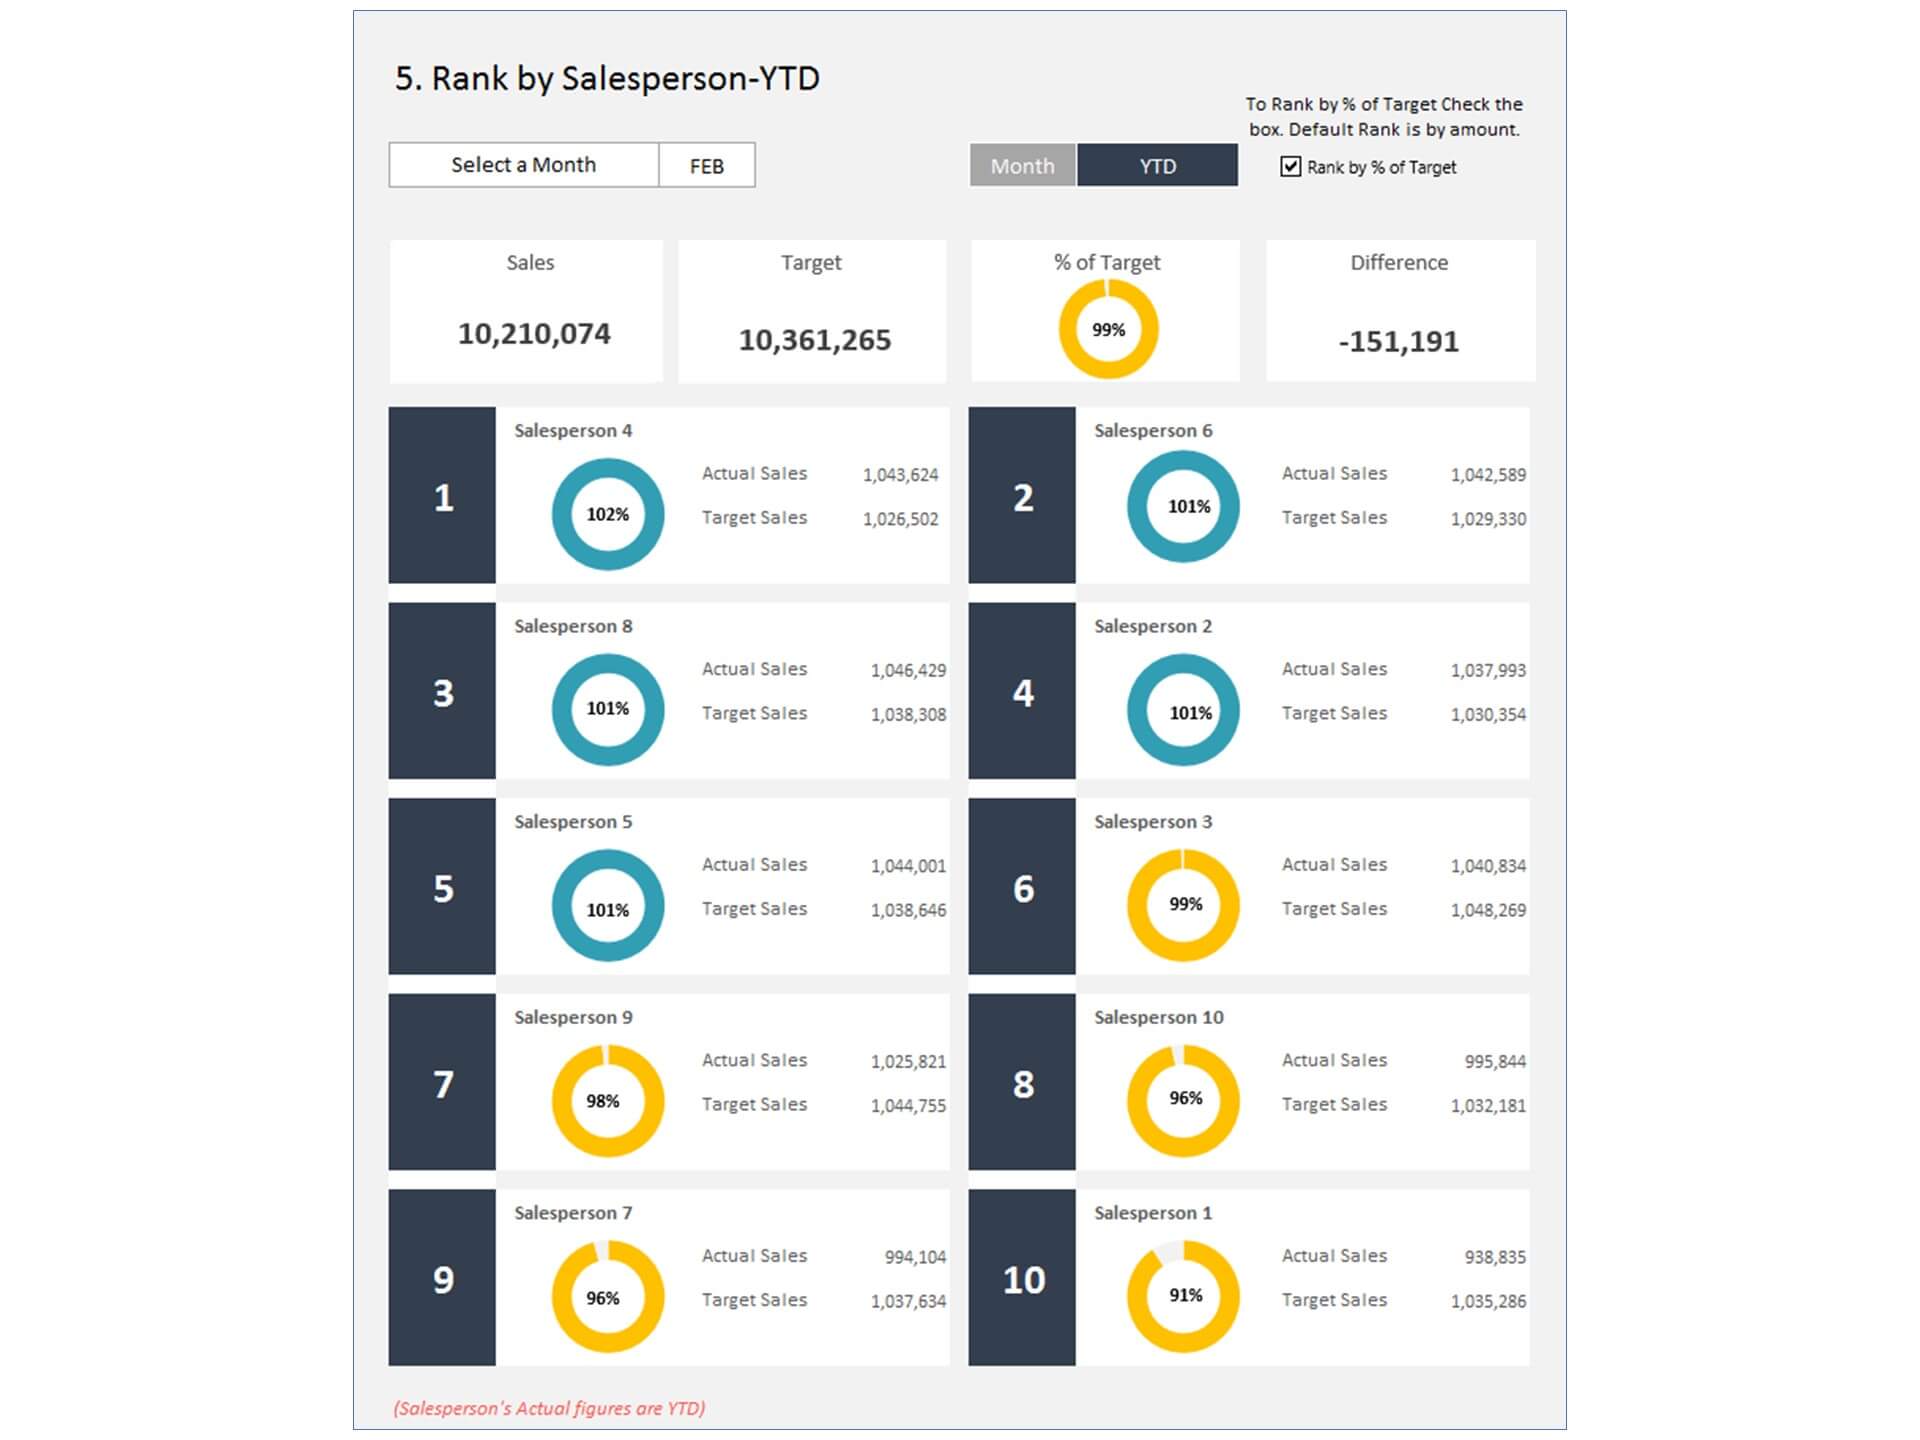
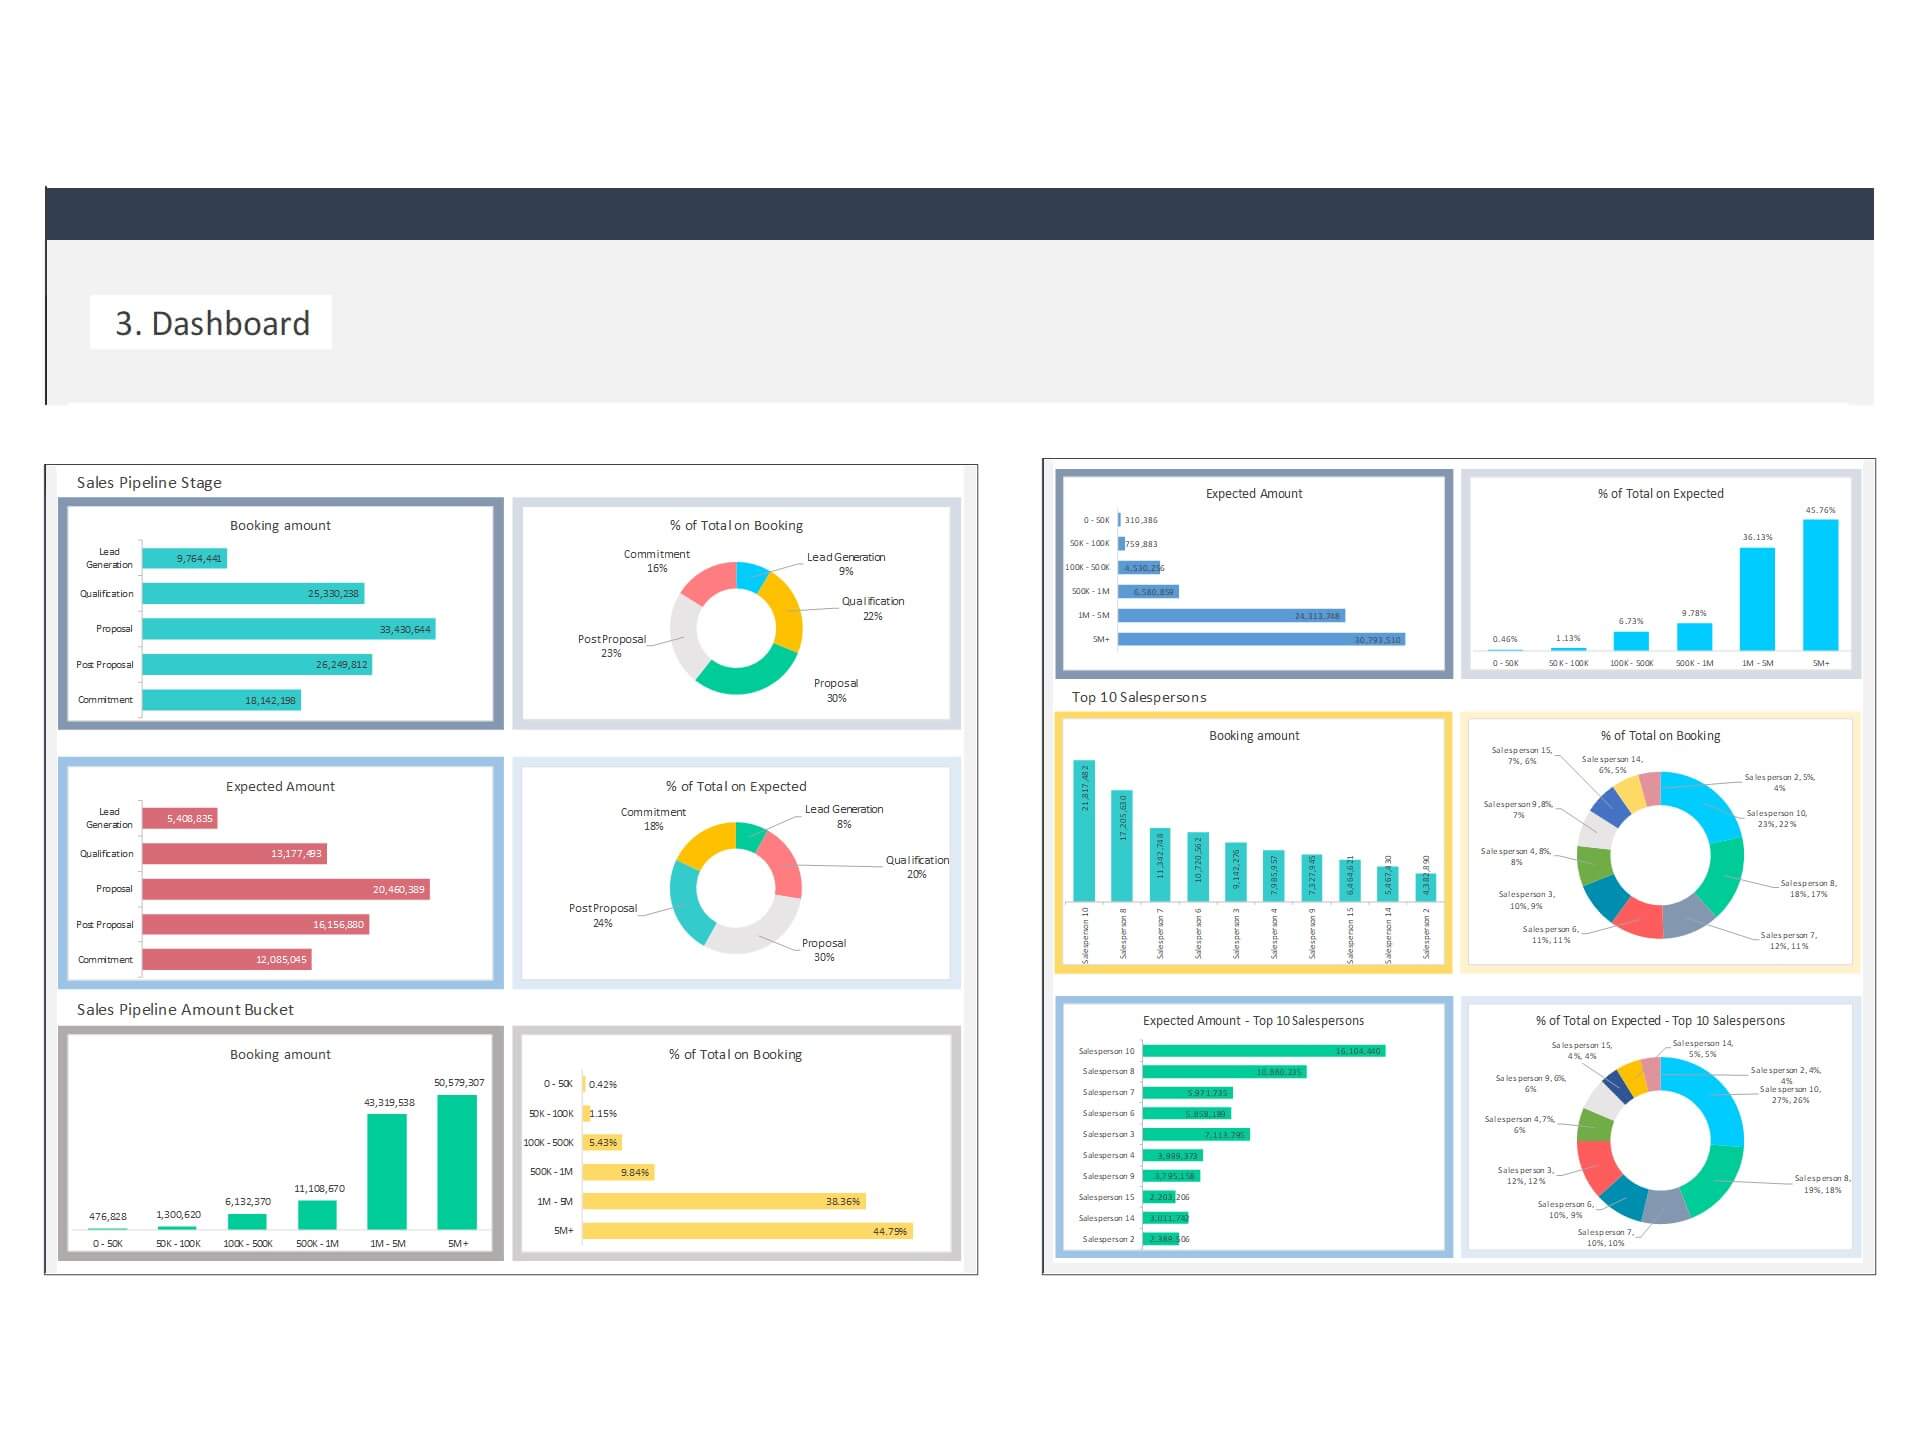
- Individual Sales Rep Performance: Evaluate the performance of each sales representative with detailed metrics such as sales targets, actual sales, conversion rates, and more. Identify your top performers and provide targeted coaching to those who need improvement.
- Product Sales Analysis: Understand which products or services are driving revenue by analyzing sales data by product category, SKU, or product line. Use this insight to focus your marketing and sales efforts on high-performing products.
- Territory Performance: If your sales team operates in multiple territories or regions, our template allows you to assess the performance of each area individually. Identify regions with growth potential and allocate resources accordingly.
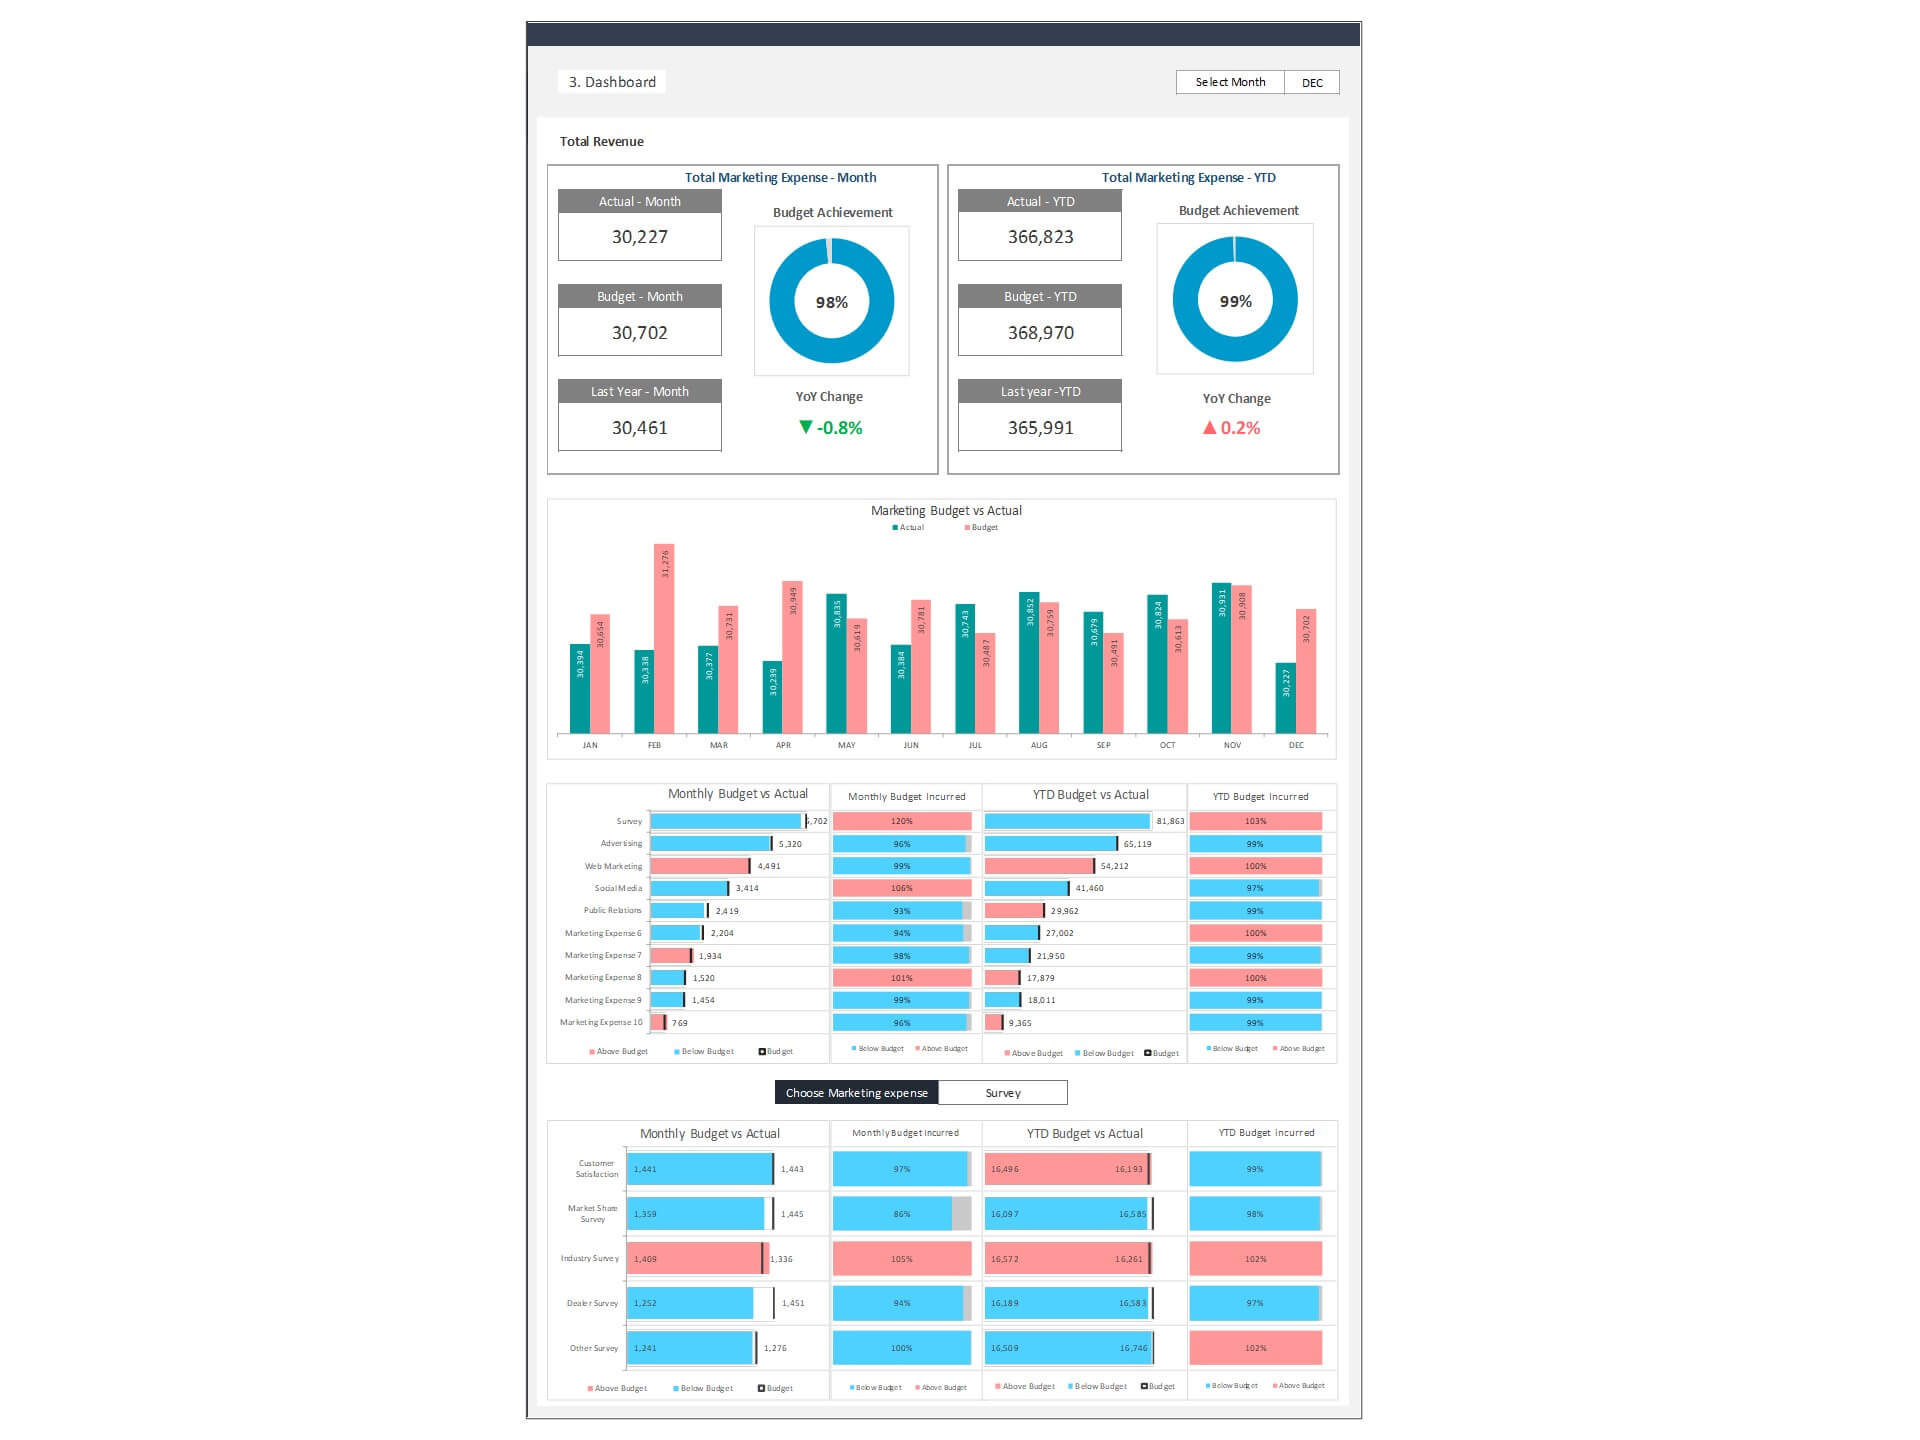
- Sales vs. Target Analysis: Measure your team's performance against predefined sales targets and goals. Identify areas where you're exceeding expectations and areas that require improvement to align with your objectives.
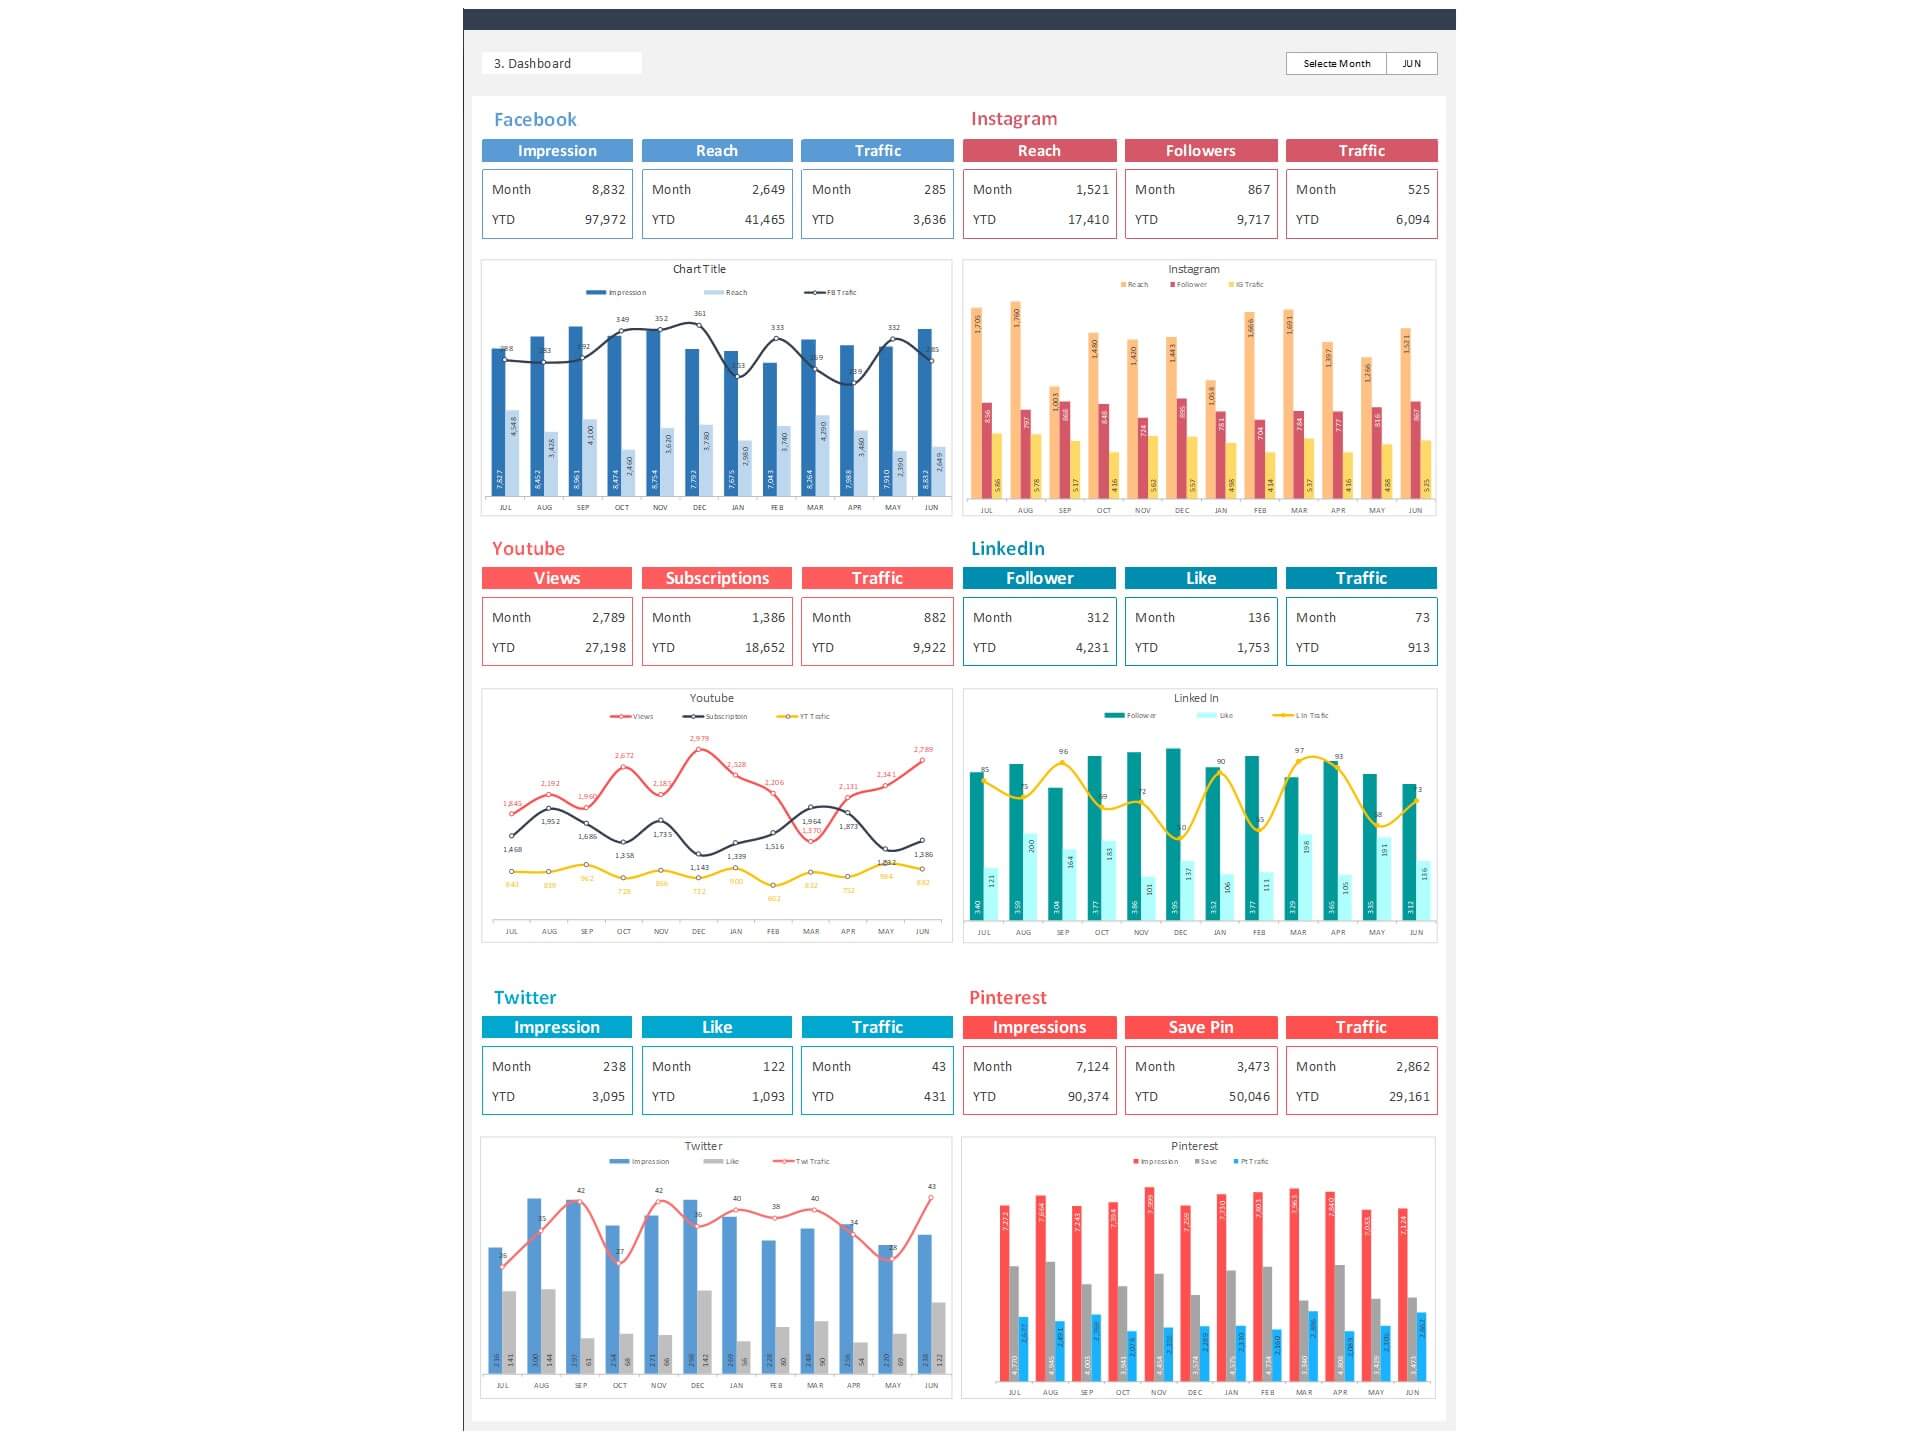
- Interactive Charts and Graphs: Visualize your sales data with interactive charts and graphs that make it easy to understand trends and patterns. Customize the dashboard to focus on the specific metrics that matter most to your business.
How the Sales Team Dashboard Excel Template Benefits Your Business
Implementing our Sales Team Dashboard Excel template offers several key benefits that can have a significant impact on your business's success:
- Improved Decision-Making: With real-time access to critical sales data, you can make informed decisions on sales strategies, resource allocation, and product offerings. Identify areas of strength and weakness and pivot your approach accordingly.
- Enhanced Sales Team Productivity: By tracking individual and team performance, you can identify coaching and training opportunities to boost the productivity and effectiveness of your sales team.
- Increased Sales Revenue: Identifying high-performing products, regions, or sales reps allows you to allocate resources where they will have the greatest impact, ultimately leading to increased sales and revenue.
- Better Sales Forecasting: Accurate sales forecasting helps you plan inventory, staffing, and marketing efforts more effectively, reducing waste and optimizing resource allocation.
- Streamlined Data Management: Our template simplifies data consolidation and reporting, saving your team valuable time and reducing the risk of errors associated with manual data entry.
- Customization and Scalability: Tailor the dashboard to meet your specific business needs. Whether you're a small startup or a large enterprise, our template is flexible and scalable to accommodate your requirements.
Getting Started with the Sales Team Dashboard Excel Template
Getting started with our Sales Team Dashboard Excel template is easy. Simply download the template, import your sales data, and start analyzing your team's performance. Whether you're a sales manager, business owner, or analyst, our template is a valuable tool for driving success in your sales operations.
In conclusion, effective sales management is essential for achieving your business goals and maintaining a competitive edge in the market. Our Sales Team Dashboard Excel template equips you with the tools and insights you need to optimize your sales strategies, maximize revenue, and lead your team to success. Harness the power of data-driven decision-making and take your sales performance to the next level with our comprehensive template.
Key Features of Dashboard Template:
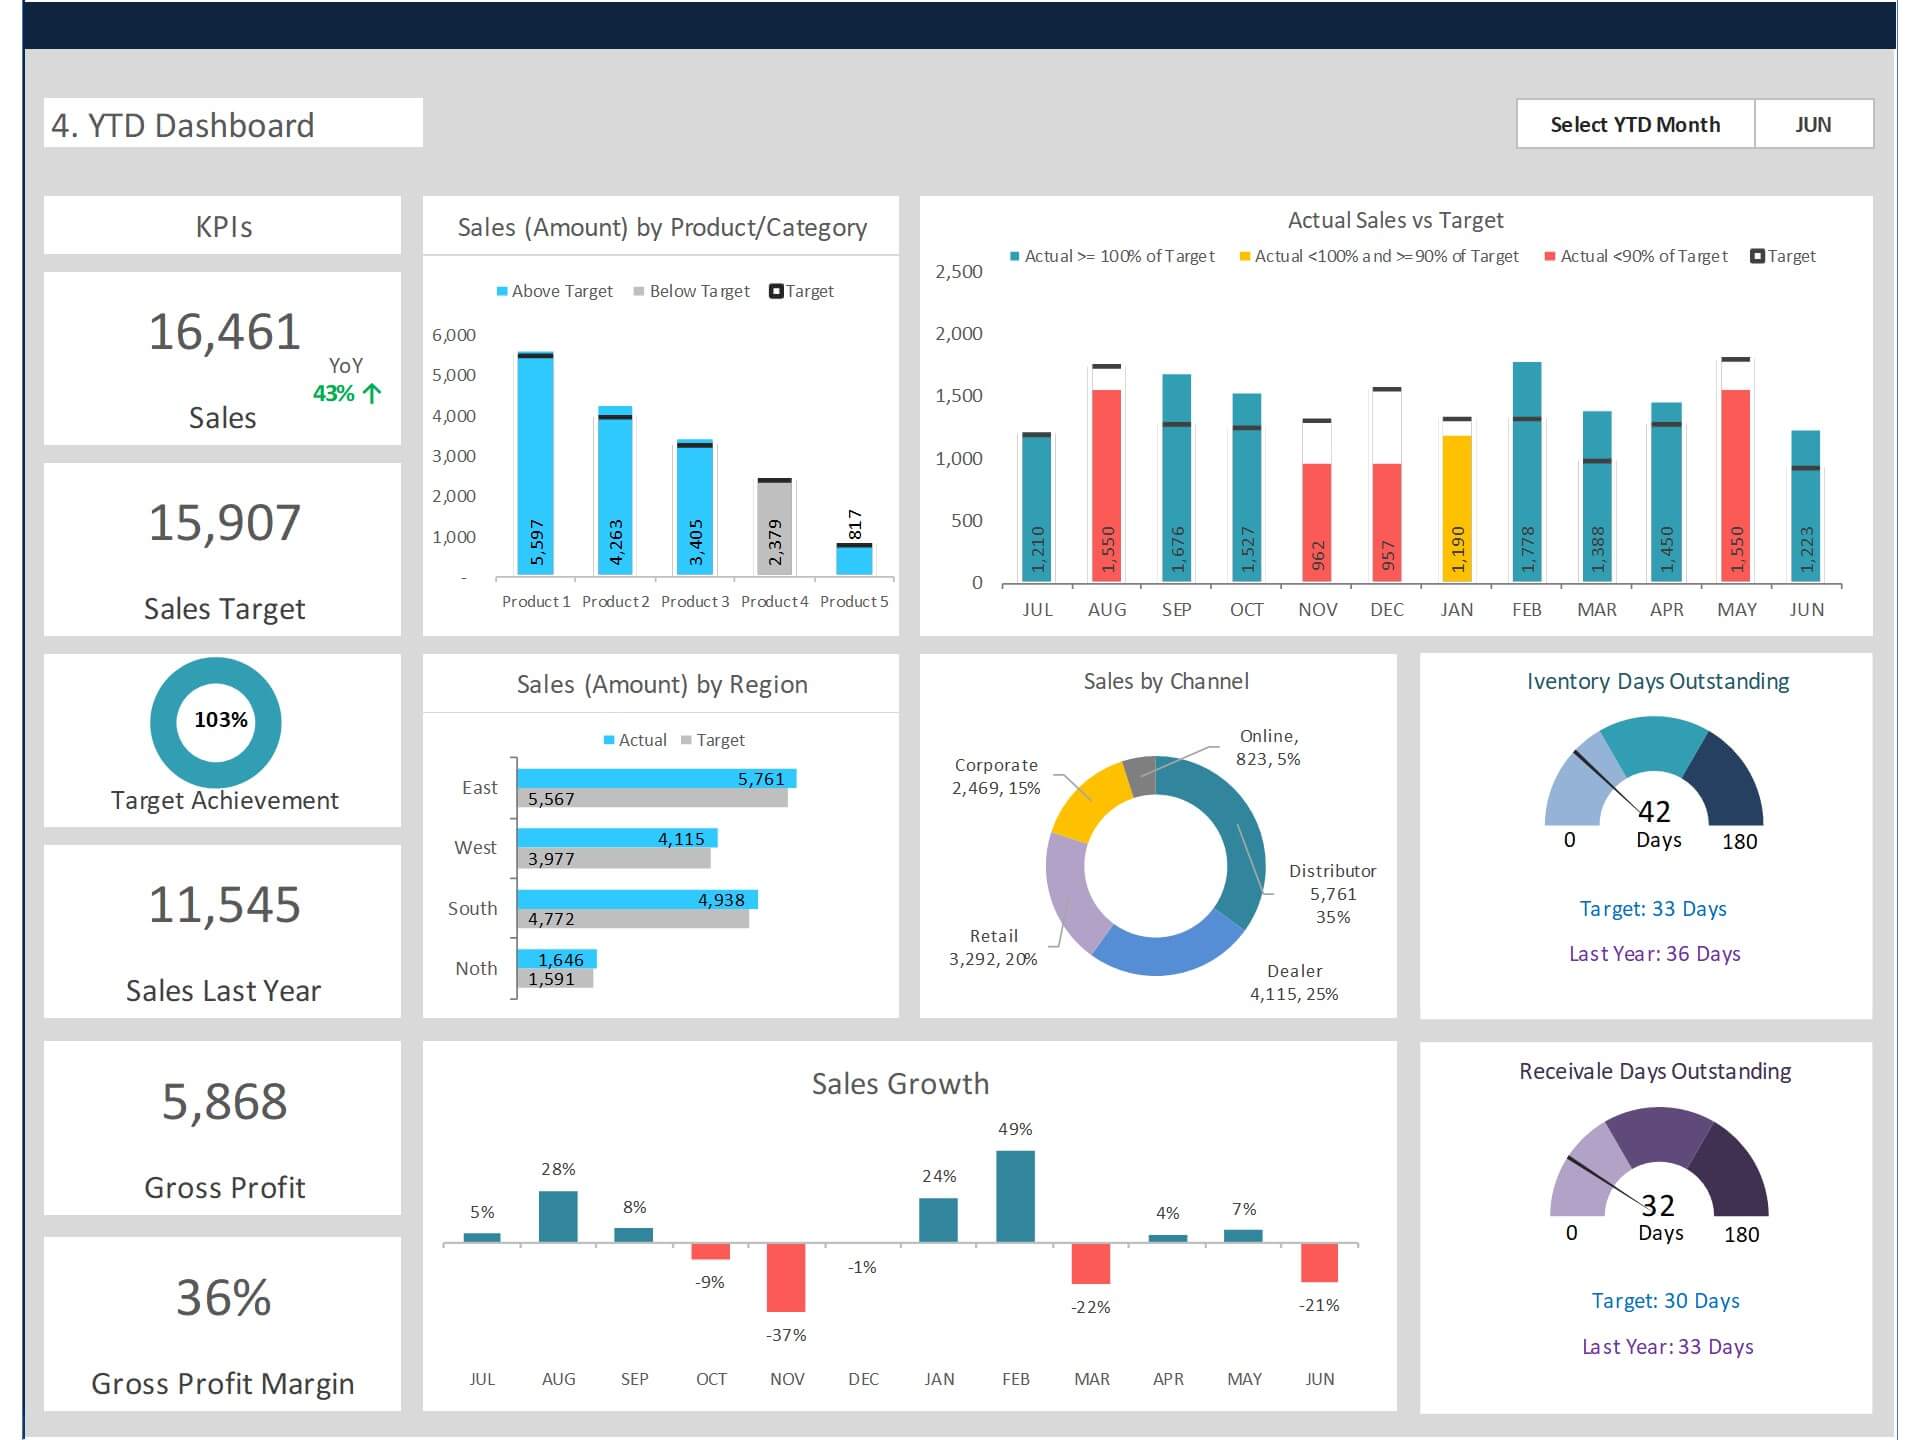
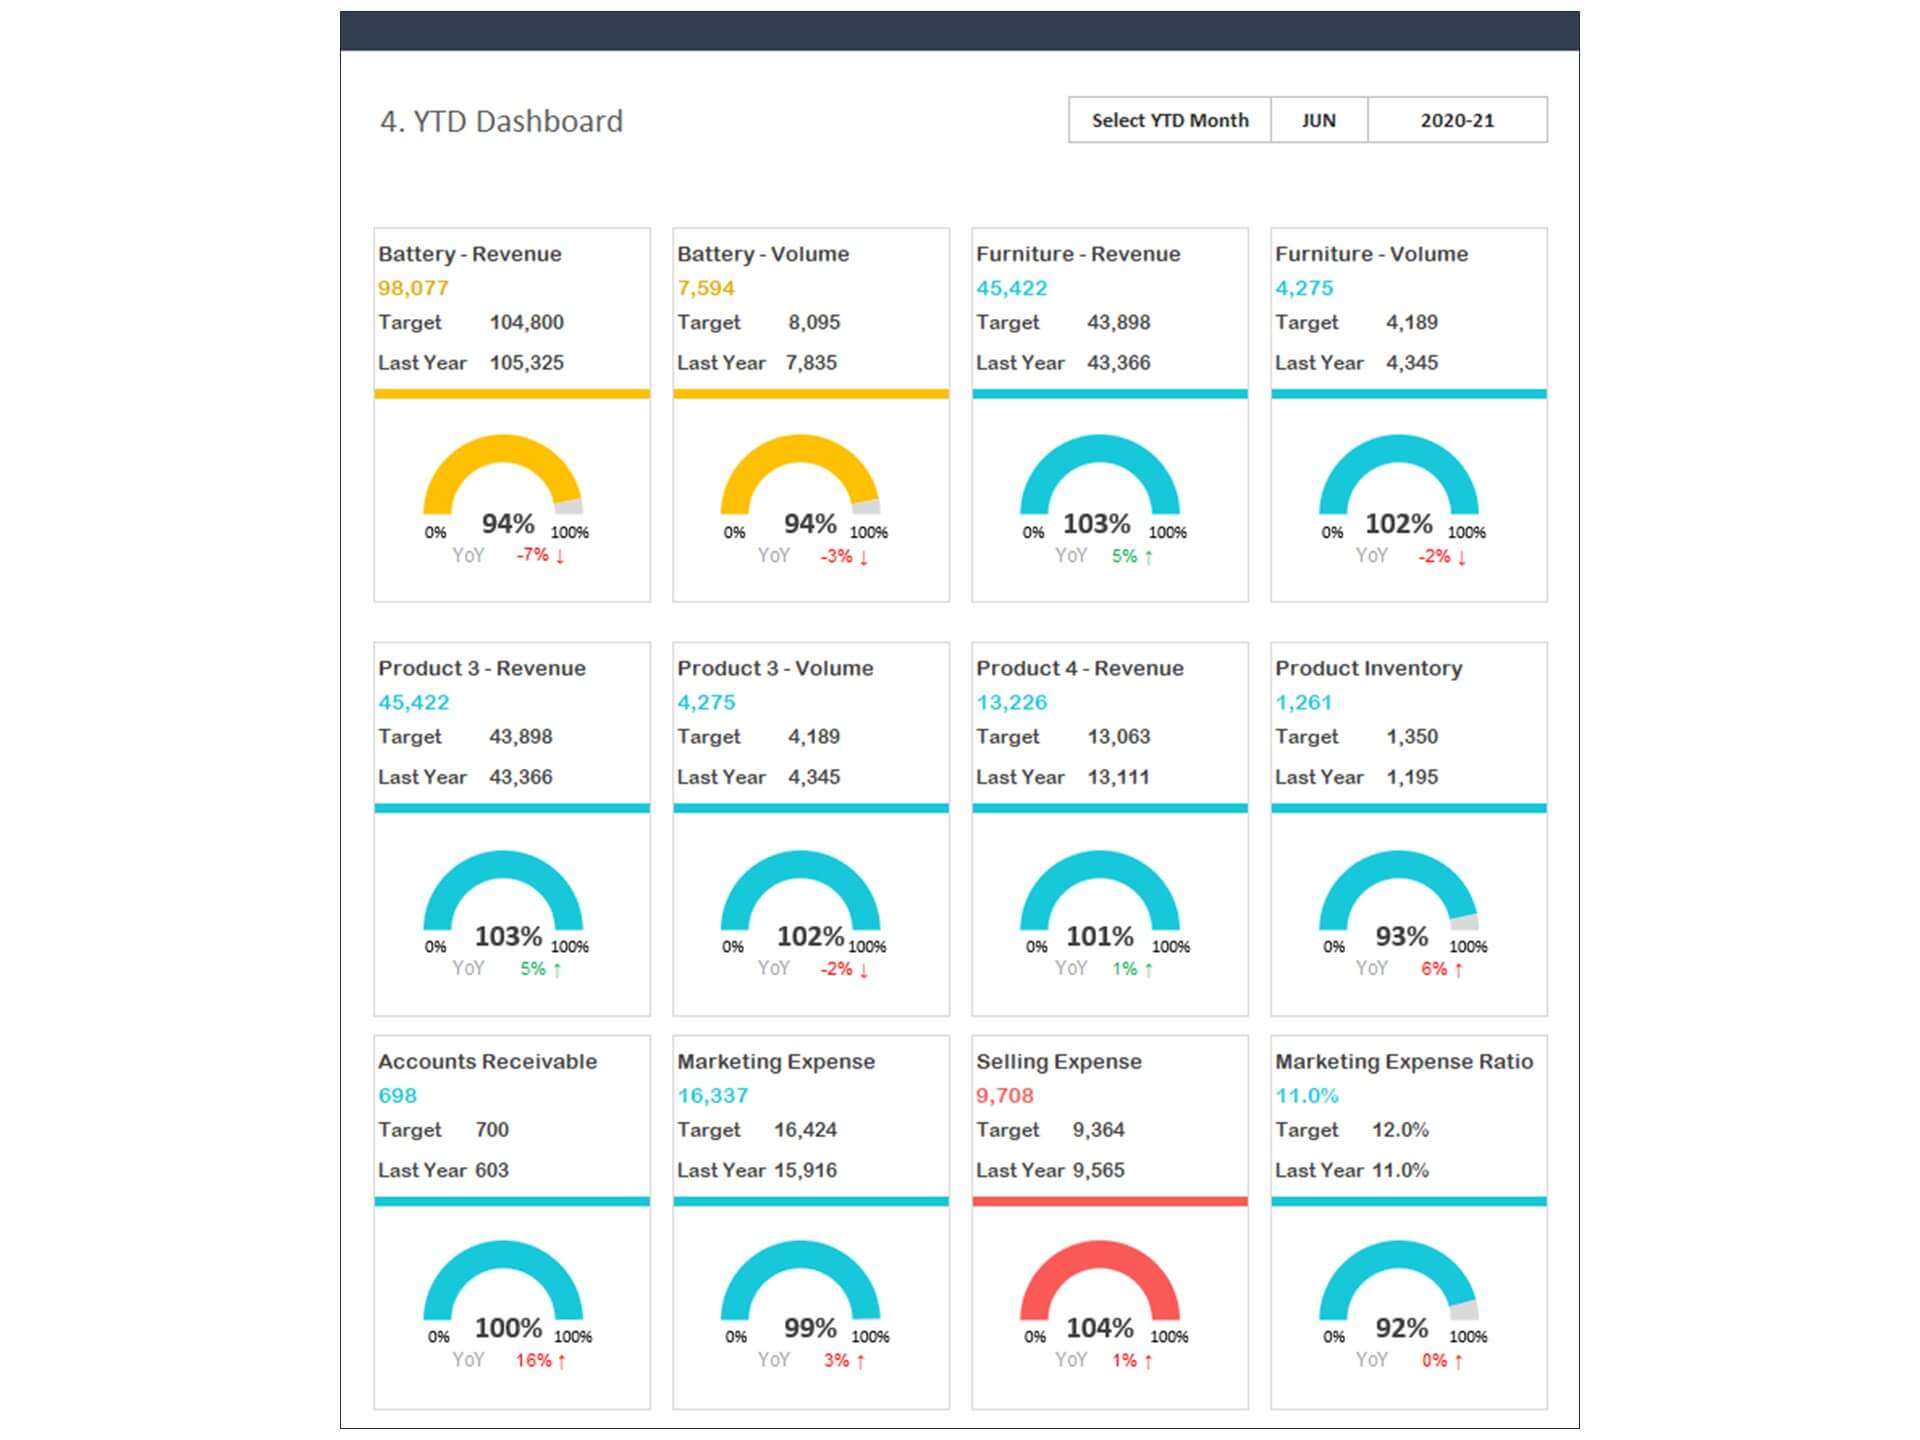
- Provides key sales insights for the CEO and sales team with details of total sales, sales by product/category, sales by channel, profitability and receivables
- Quickly and easily communicate to salespersons
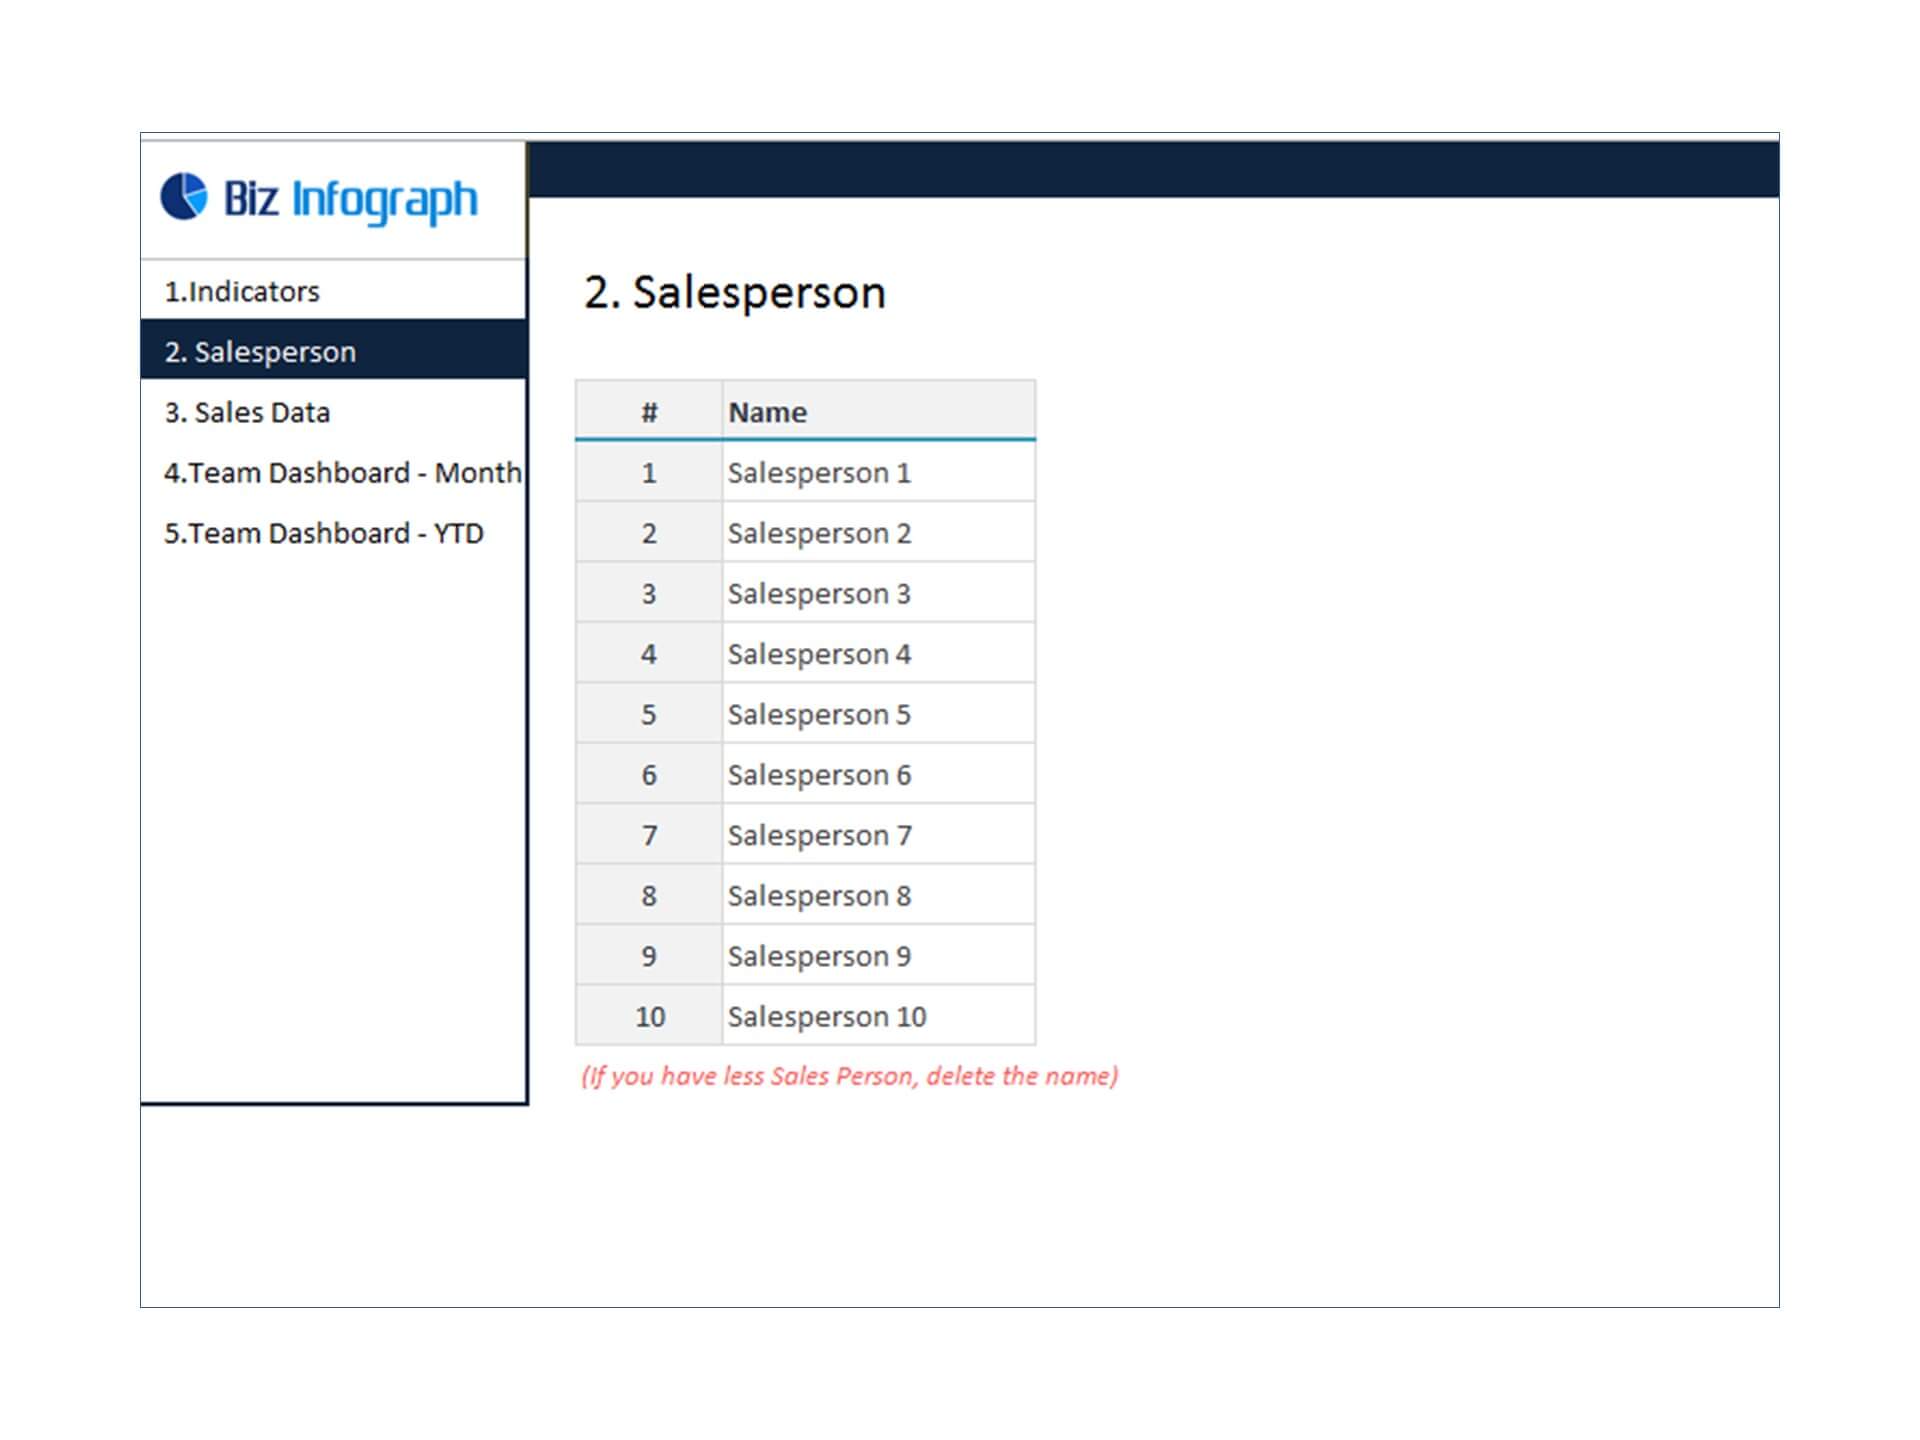
- Flexibility to add upto 20 salespersons data in the template
- Visualize overall sales performance
- Fully editable, easy to use, template with sample data
- Eye-catching design and customizable
- Change the sample data with your data
- Spreadsheets ready for printing without Biz Infograph logo
- Consolidate key financial performance indicators in one dashboard
- No monthly fees
- Immediate download
- No VBA, no Macro
- No installation necessary
- Professionally designed
What is included in this dashboard template?
- Just plug your data, the dashboard will be ready instantly and start using.
- A text file which contains a password to view and edit the formula
- A guide to unlocking all the elements in the dashboard
Professional Support:
- Video tutorial guide on how to navigate and use the Sales Team Dashboard Template
- Professional service to customize dashboard template in excel as per business need
- Help and support in post-purchase
- Payment secured by Stripe and PayPal (no PayPal account needed)
A brief guide to using the dashboard template:
- Open the dashboard template
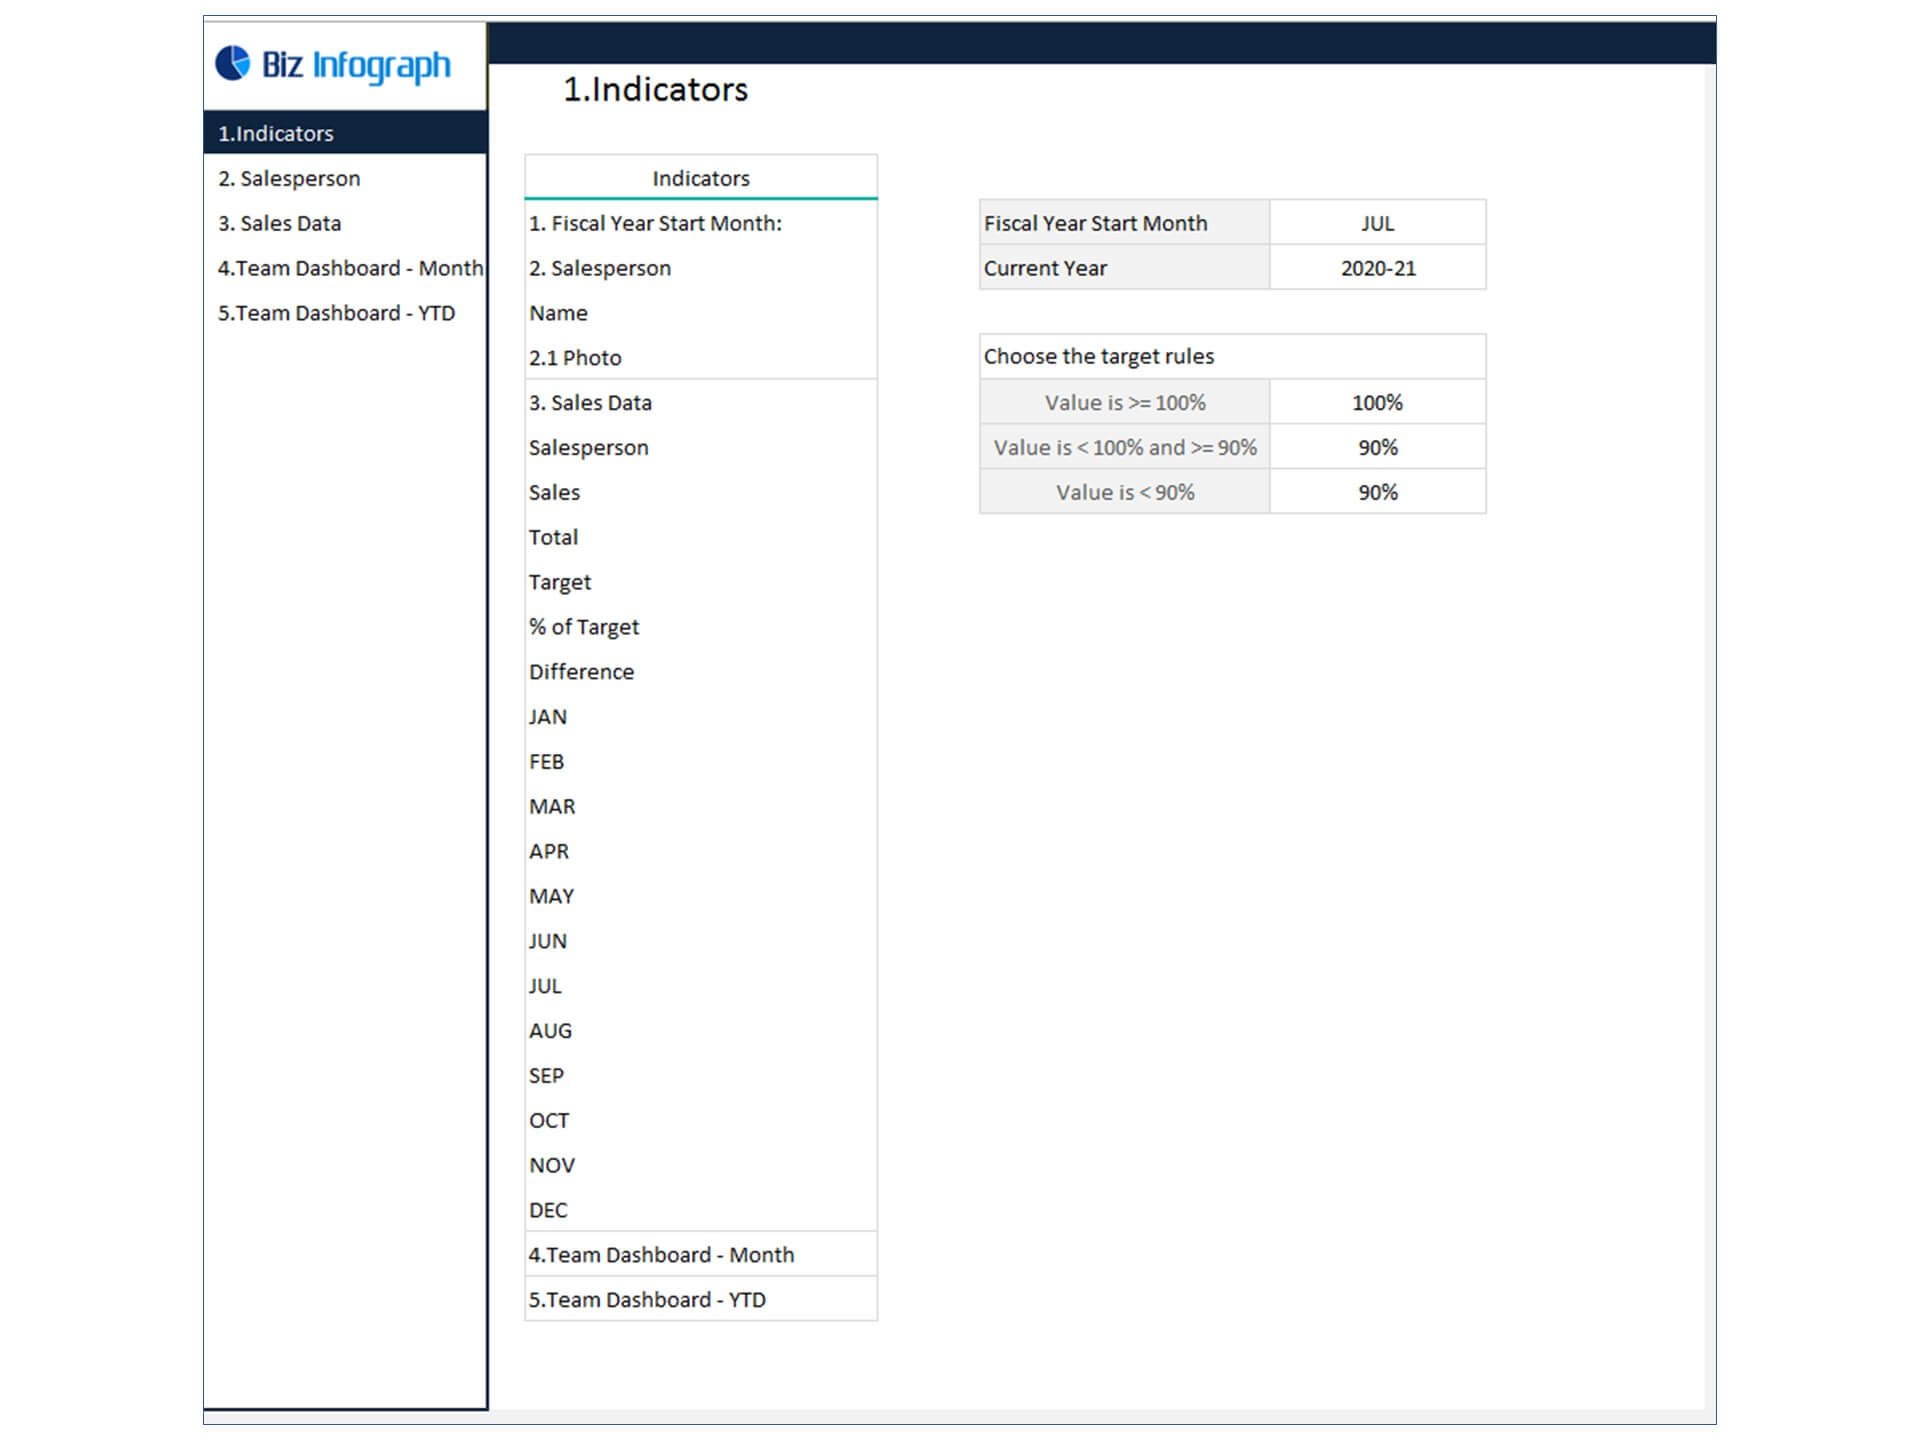
- Go to ‘Indicators’ menu – choose the start month of the fiscal year (i.e. Jan, Feb, Jul, etc.)
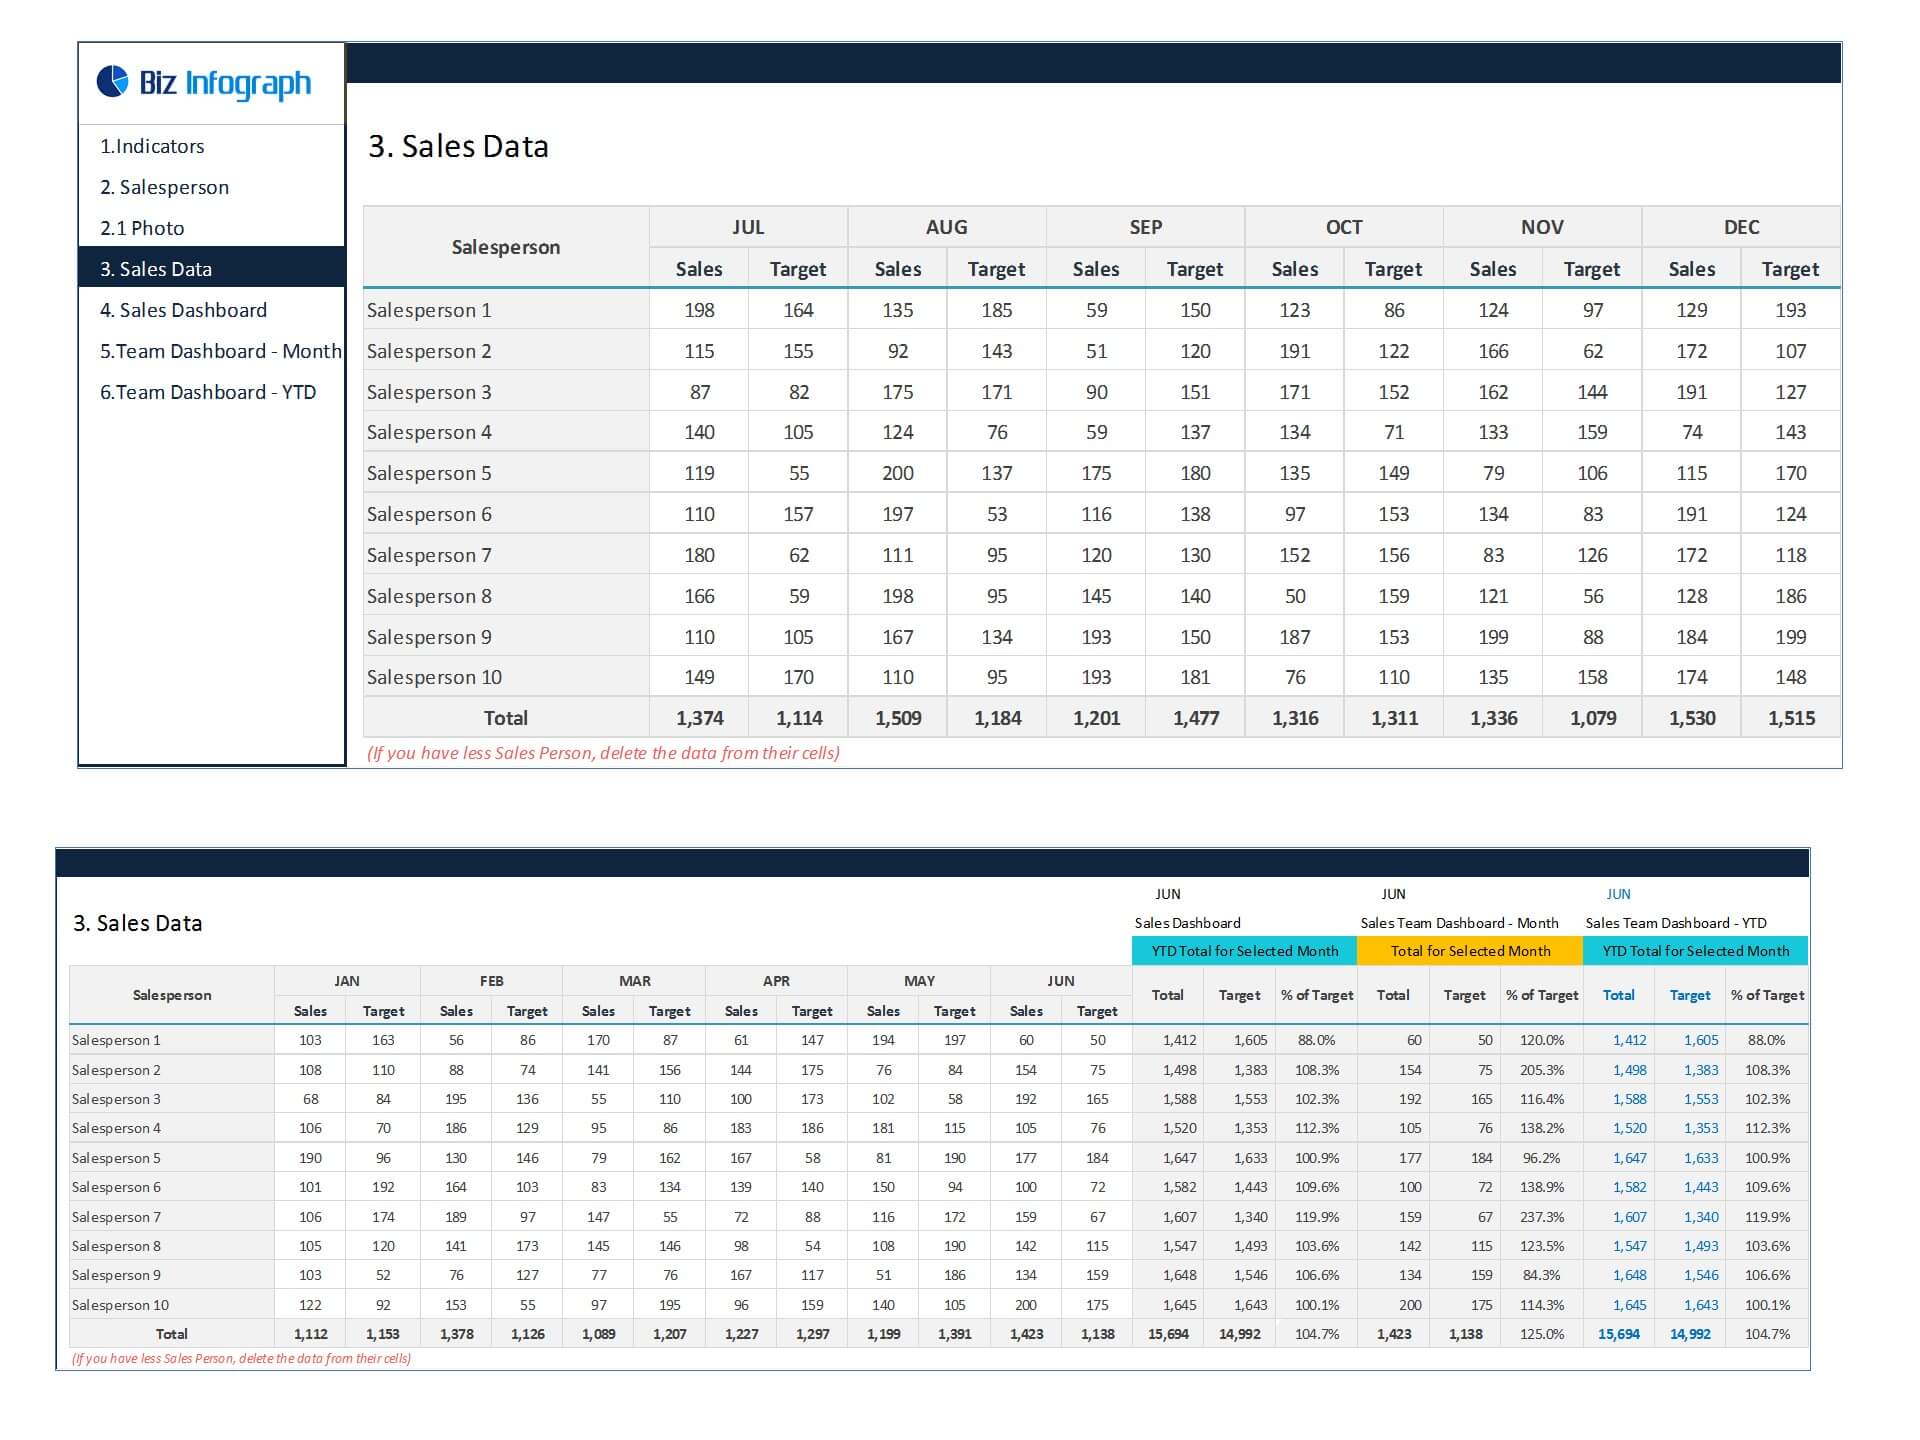
- Go to the ‘Enter Data’ menu – remove the sample data and give your actual data in the respective cells. Formula cells are locked, and you cannot edit it without a password.
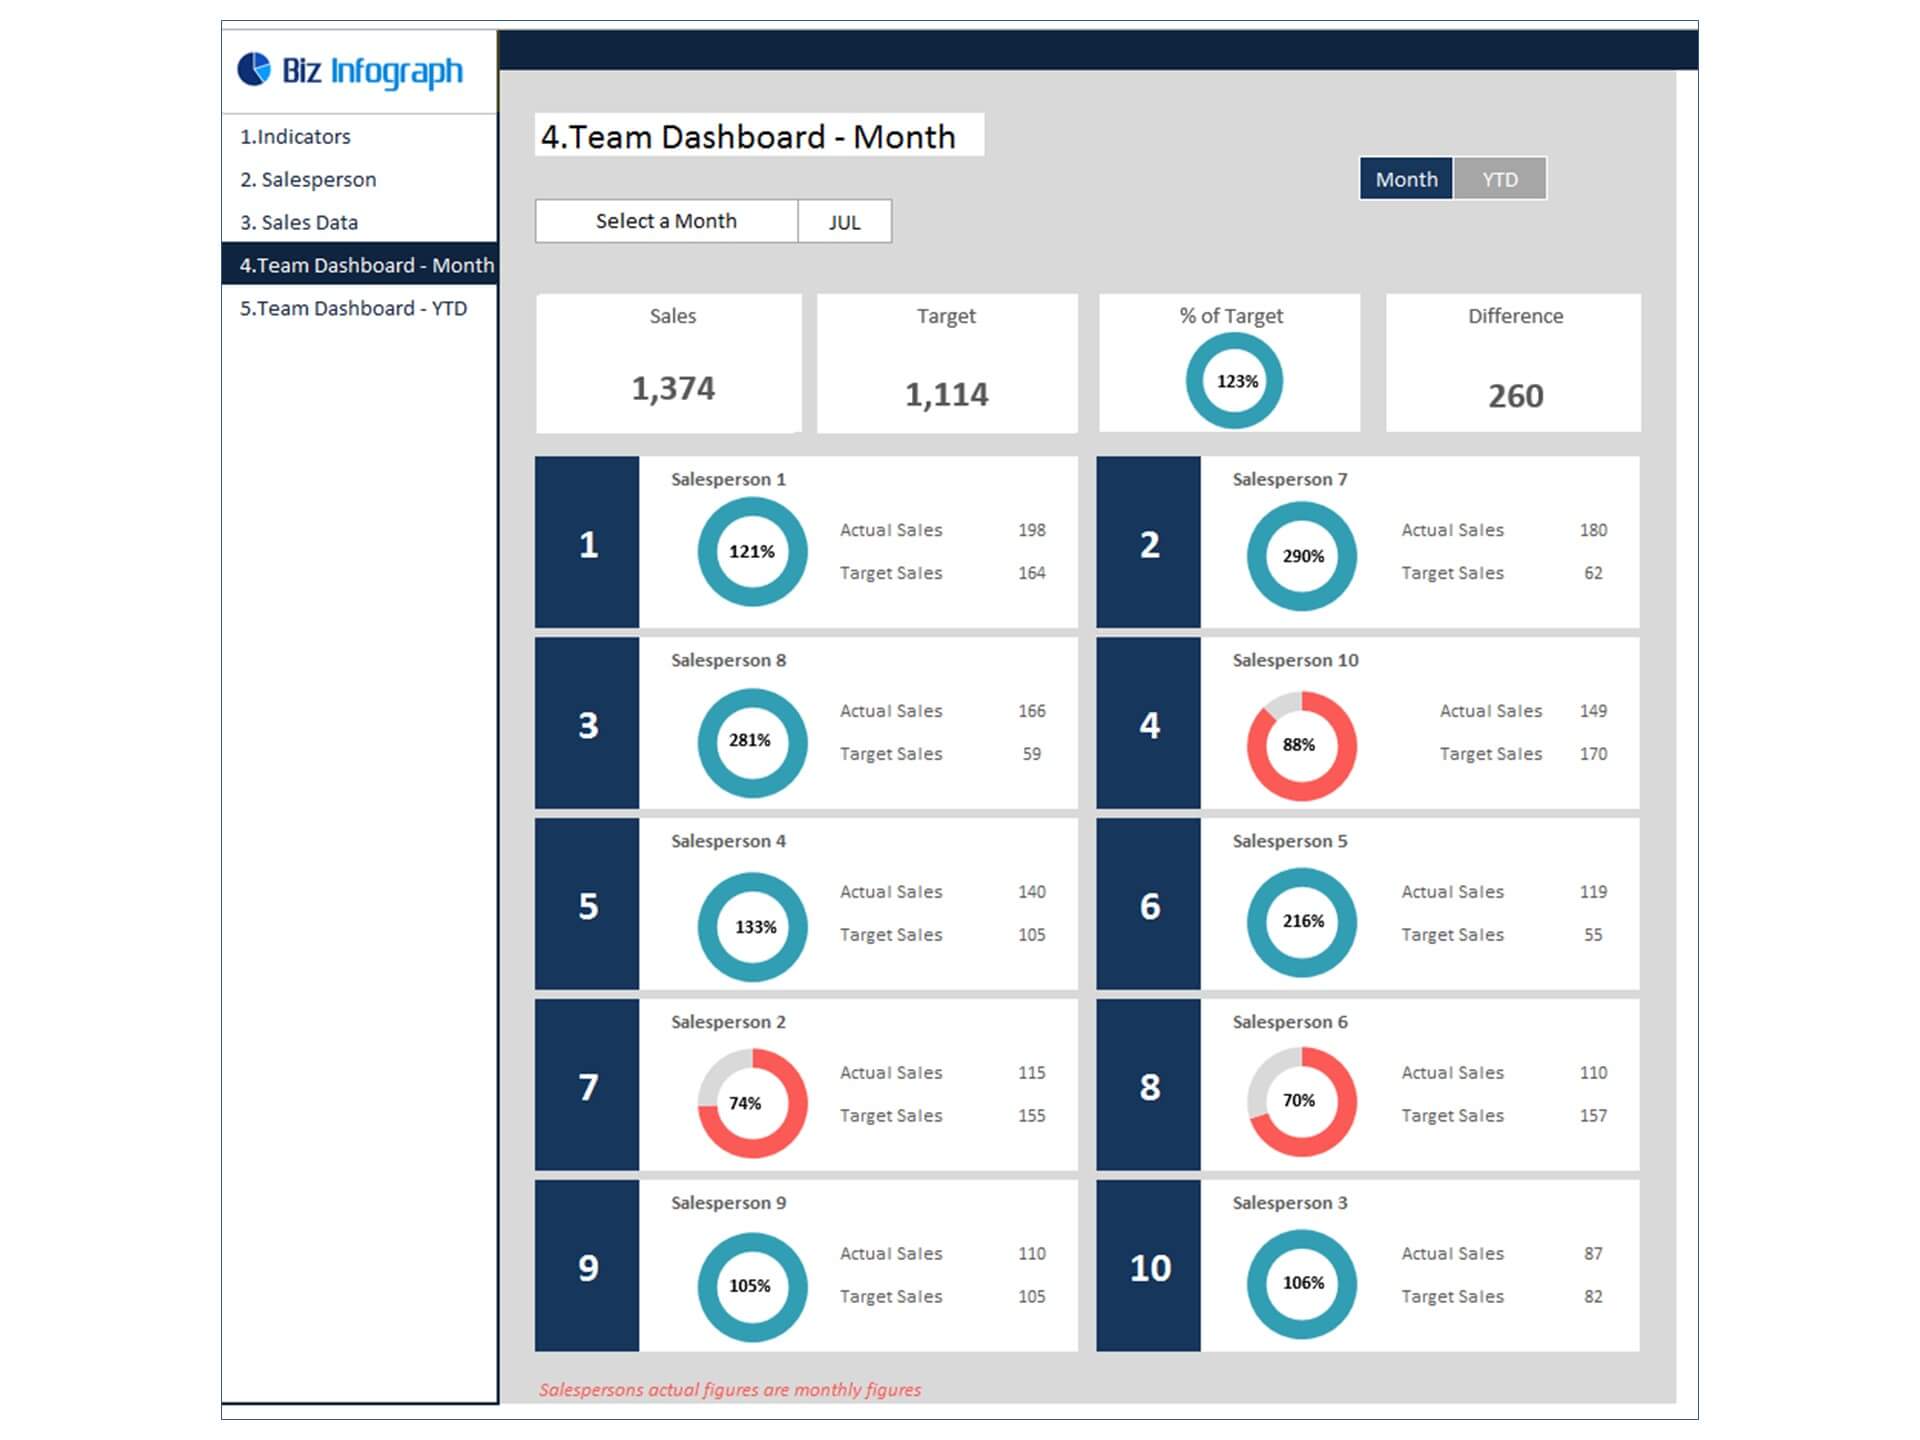
- Go to the ‘Monthly Dashboard’ menu – select the month name from the drop-down to see the monthly picture of performance indicators
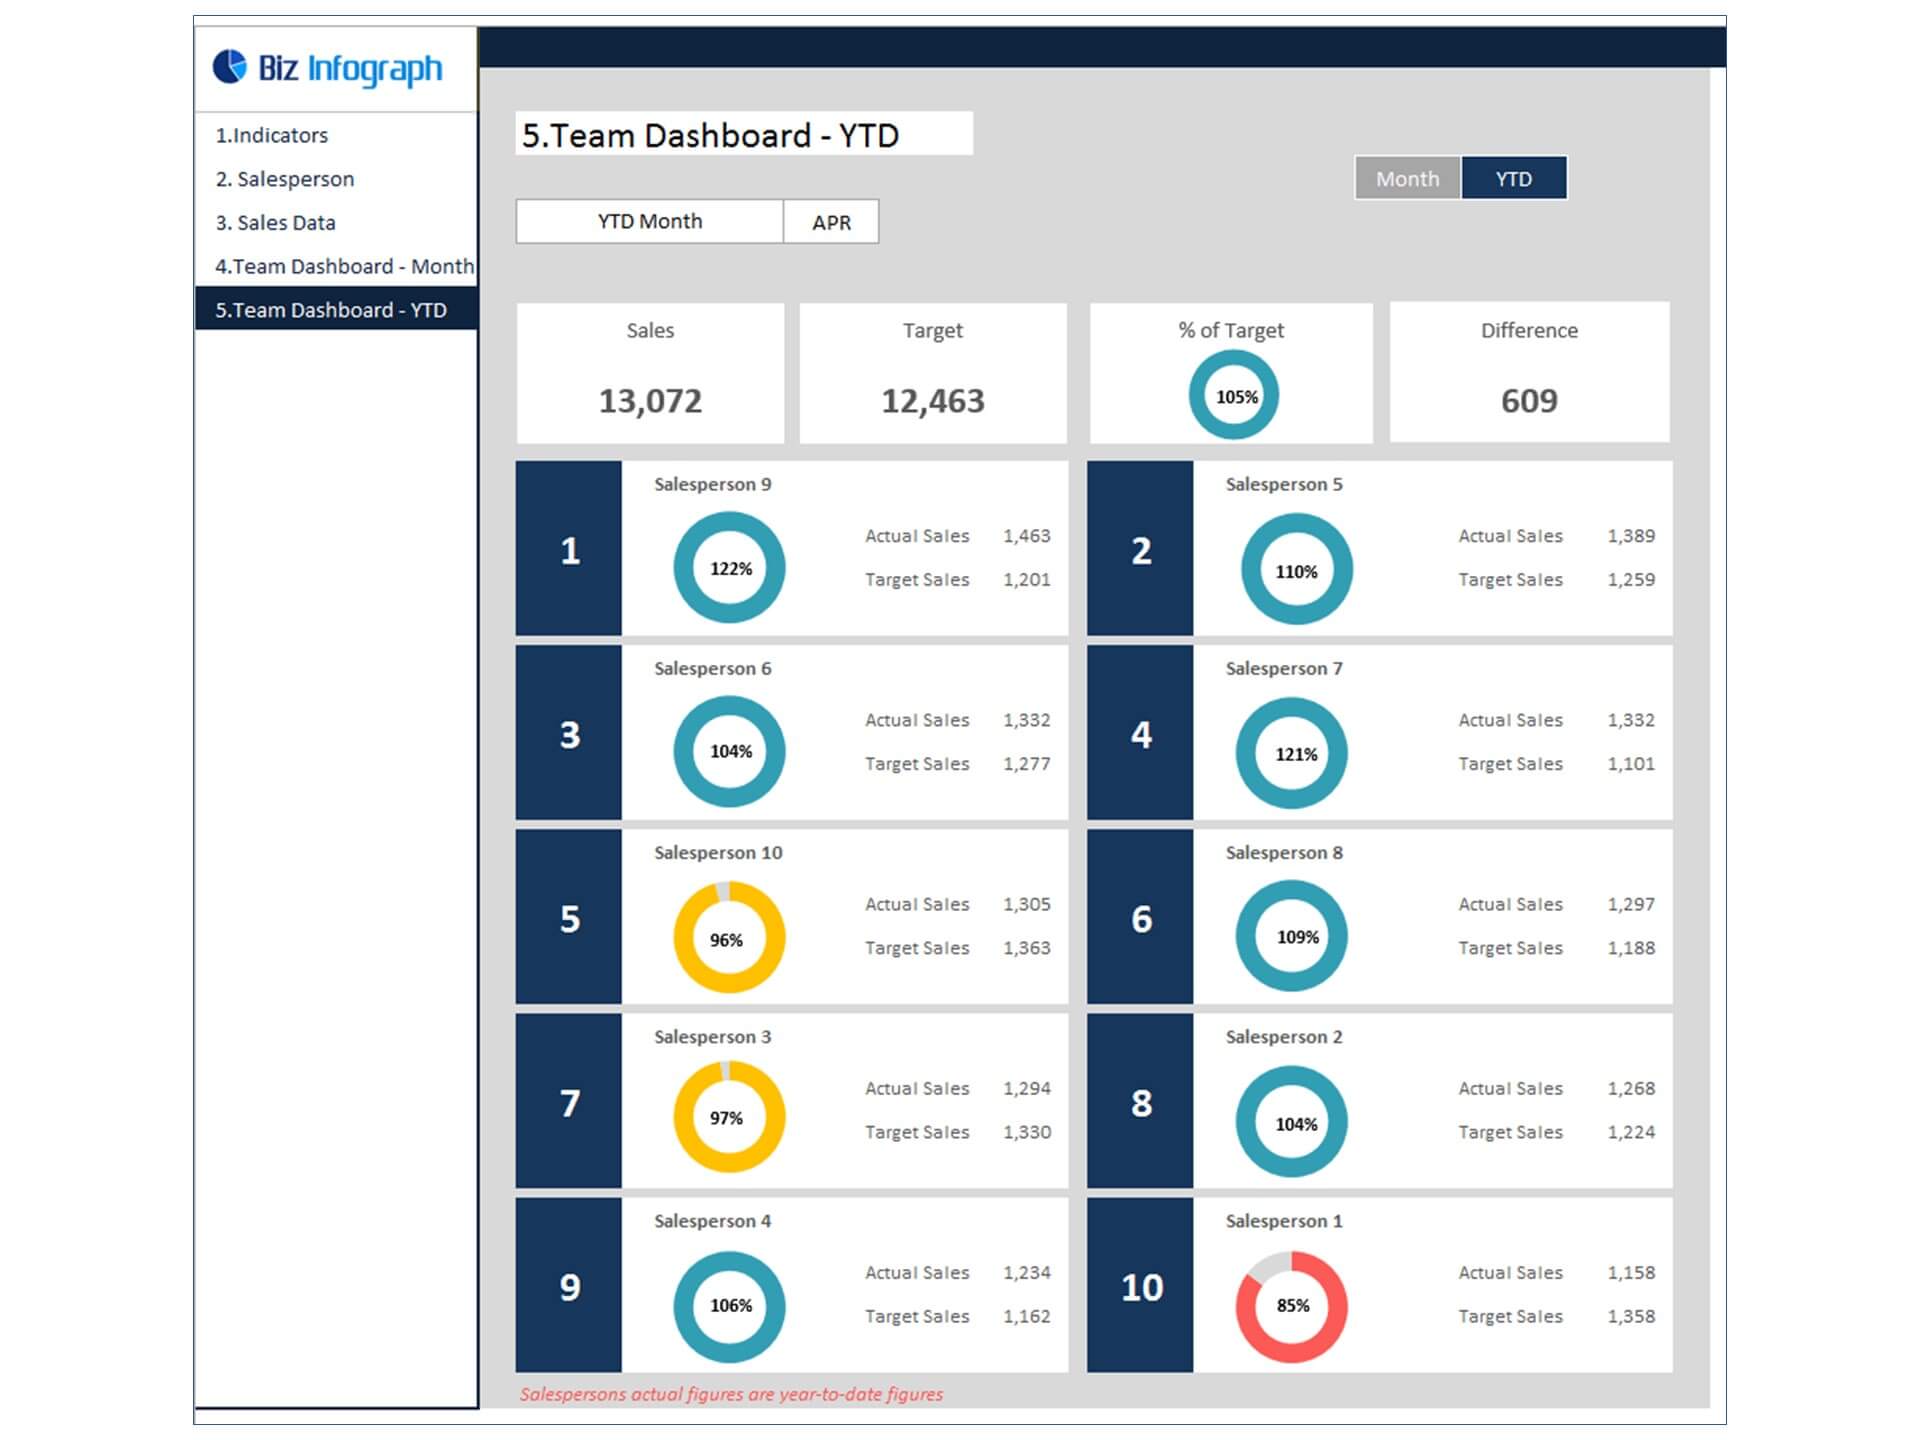
- Go to ‘YTD Dashboard’ menu - select month name from the drop-down to see the year-to-date picture of performance indicators
- Each page is ready for printing – just press CTRL+P
This Excel dashboard template is password-protected to avoid mistakes, such as accidentally deleting formulas. When you completed the purchase, the password will be available.
For ready-to-use Dashboard Templates: