Introduction to Logistics and Supply Chain Dashboard Package
What Is a Logistics and Supply Chain Dashboard Package and Why It Matters
A Logistics and Supply Chain Dashboard Package is a set of visual reports designed to help businesses monitor shipment activity, inventory movement, supplier performance, and fulfillment results in one place. In modern logistics and supply chain operations, teams need faster visibility into what is happening across the supply chain. A strong dashboard package gives that visibility. It helps managers track delays, costs, stock issues, and service levels without reviewing multiple files. For any logistics business or operational team, this matters because better reporting leads to faster responses, better coordination, and stronger control over daily performance.
How a Dashboard for Supply Chain Improves Visibility and Decision-Making
A good dashboard for supply chain management improves decision-making by turning raw operational records into a clear working view. It gives users a stronger view of the supply chain by combining shipment, warehouse, and inventory information into one report. This is especially useful in a complex supply chain where issues in one area can quickly affect another. Better reporting helps teams identify delays, stock gaps, or transport bottlenecks earlier. When businesses use supply chain dashboards, they reduce reporting blind spots and make better, faster decisions that support both service quality and cost control.
Why Businesses Use a Logistics and Supply Chain Dashboard Package Template
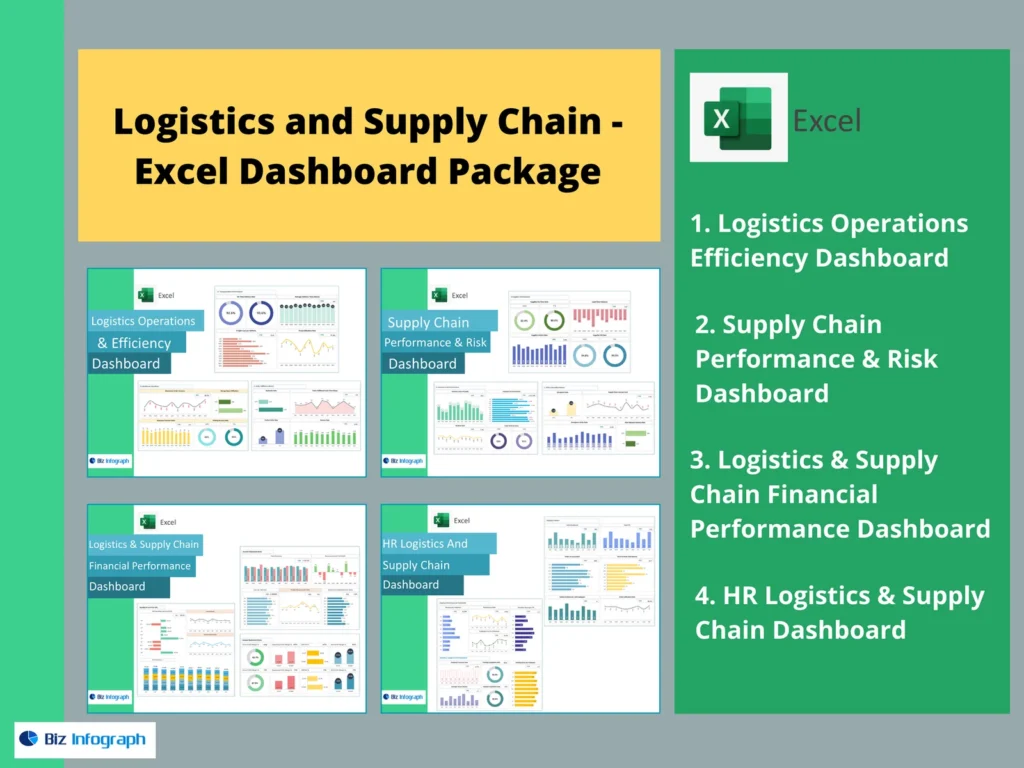
Many organizations choose a Logistics and Supply Chain Dashboard Package template because it gives them a repeatable way to manage reporting. A good template includes KPI cards, shipment summaries, planning views, and inventory analysis pages without requiring a redesign every period. This saves time and improves consistency. It also helps teams standardize performance review across departments. Strong dashboard templates are especially useful for companies managing many products, locations, or suppliers. By using a template, businesses can focus more on improving performance and less on rebuilding reports from scratch every week or month.
Core Benefits of a Logistics and Supply Chain Dashboard Package
Improving Supply Chain Visibility with a Supply Chain Dashboard
A strong supply chain dashboard improves visibility by centralizing the most important operational signals into one place. It helps users understand shipment status, inventory levels, supplier activity, and fulfillment flow without opening separate reports. This is important because supply chain visibility is one of the main requirements for improving operations. Without it, teams react too late. With it, they can identify issues early and manage them proactively. A clear dashboard creates stronger alignment across the entire supply chain and helps businesses monitor whether products are moving efficiently from source to destination.
How Logistics Dashboard Reporting Supports Better Supply Chain Management
A well-structured logistics dashboard for supply chain reporting supports better supply chain management because it connects operational activity with measurable outcomes. It allows logistics managers and supply chain professionals to review transport timing, inventory movement, service reliability, and order status in one place. This helps them coordinate more effectively and manage exceptions faster. Better reporting also improves collaboration between planning, warehousing, and delivery teams. When the dashboard is clear and actionable, it helps the business strengthen supply chain control and improve how logistics decisions are made at every stage of the operation.
Using Supply Chain Dashboards to Address Supply Chain Challenges
Businesses face many supply chain challenges, including stock shortages, shipment delays, supplier inconsistency, and rising logistics costs. A strong dashboard helps address these challenges by making them visible earlier. It can show weak fulfillment areas, transport delays, inventory imbalances, and service gaps before they become bigger issues. This is one reason many organizations use supply chain dashboards as part of continuous improvement. Better reporting helps teams focus on priorities, reduce delays, and take action with better timing. The result is stronger responsiveness and better operational discipline across the network.
Key Metrics in a Logistics and Supply Chain Dashboard Package
Essential Supply Chain KPIs Every Business Should Track
Every Logistics and Supply Chain Dashboard Package should include the most important supply chain kpis needed to manage performance clearly. These often include on-time delivery rate, order fill rate, inventory turnover, stock accuracy, shipment cycle time, and supplier lead time. These are the key supply chain measures that show whether the network is performing effectively. A good supply chain metrics dashboard makes these indicators easy to review and compare. Clear KPI tracking helps leadership and operations teams understand where improvement is needed and whether the business is moving toward a more efficient supply chain.
Measuring Inventory, Logistics Performance, and Key Supply Chain Metrics
A strong dashboard should connect inventory, logistics performance, and broader operational KPIs in one place. This includes monitoring stock availability, replenishment timing, warehouse throughput, and delivery reliability. It should also show the logistics kpis that matter most for the business model, such as shipping speed, handling productivity, and cost efficiency. These measures help teams identify whether goods are moving smoothly or whether inventory and transport are creating pressure. Better measurement helps businesses improve service, reduce waste, and strengthen supply chain efficiency by aligning planning and execution more effectively.
Using Supply Chain Data and Logistics Data for Better Performance Monitoring
A good dashboard depends on reliable supply chain data and logistics data. This may include transport records, warehouse transactions, order status, inventory files, and supplier activity. When this information is combined properly, the dashboard becomes much more useful for performance monitoring. It helps users understand not only what happened, but also why it happened. Better data improves analysis across fulfillment, transport, and planning. When teams can trust their data, they can make better decisions and create a stronger operating rhythm across the supply chain with less guesswork and more confidence.
Dashboard Types in a Logistics and Supply Chain Dashboard Package
Supply Chain Management Dashboard for Operational Oversight
A dashboard for supply chain management is designed for operational oversight and day-to-day monitoring. It gives users a central view of orders, stock, delivery status, and supplier performance. This kind of report is especially useful for businesses that need strong control over logistics and supply chain operations on a continuous basis. It supports better coordination between functions and improves visibility into where issues are developing. For teams working at a higher supply chain management level, it provides the structured information needed to manage performance consistently and respond quickly to operational risk.
Planning Dashboard for Forecasting, Inventory, and Resource Decisions
A planning dashboard helps businesses align future demand, stock, and logistics capacity more effectively. It can show forecast trends, inventory needs, supplier lead times, and warehouse or transport requirements so teams can plan resources before pressure builds. This is important in both local operations and global supply chains, where planning mistakes can affect many locations at once. Better planning dashboards help reduce overstock, stockouts, and delivery disruption. They also support stronger coordination between procurement, operations, and logistics, which is essential for improving supply chain performance over time.
Performance Dashboard for Monitoring Logistics and Supply Chain Results
A performance dashboard focuses on outcome measures such as delivery reliability, inventory turnover, fill rate, and transport efficiency. It helps users evaluate whether the company is meeting service and cost expectations and whether the operation is improving. A strong supply chain performance dashboard is especially valuable for leadership because it turns large operational datasets into a clear summary of results. This makes it easier for supply chain leaders and managers to review progress, compare locations, and identify where the biggest performance gaps exist. Better performance reporting supports more focused operational improvement.
Logistics and Supply Chain Dashboard Package Features
How a Dashboard for Supply Chain Management Simplifies Reporting
A strong dashboard for supply chain management simplifies reporting by replacing scattered files with one structured package of visual reports. Instead of checking multiple spreadsheets, teams can review shipment activity, inventory balances, and delivery performance in one place. This improves speed and reduces reporting confusion. It also makes it easier to communicate performance across operations teams and leadership. A good dashboard package is especially useful when the business needs regular operational visibility without depending on manual summaries. Simpler reporting gives managers more time to solve issues and less time to prepare updates.
Building Better Reports with Supply Chain Dashboard Software and KPI Views
Modern supply chain dashboard software helps teams create better reports by organizing operational data into clear KPI views and visual summaries. These dashboards can show fulfillment status, shipment trends, stock movement, and supplier performance in a format that is easier to use than raw transaction reports. Strong bi dashboards and logistics analytics dashboards help users move from summary to detail quickly. Better KPI design also makes it easier for managers to focus on what matters most. Clear reports support better operational communication and make performance review more practical across teams.
Why a Logistics and Supply Chain Dashboard Package Template Saves Time and Improves Accuracy
A reusable Logistics and Supply Chain Dashboard Package template saves time because users can refresh the latest data instead of redesigning the report structure. It also improves accuracy because the same calculations, KPI logic, and visual layout are used consistently each cycle. This reduces reporting errors and makes comparisons more dependable across periods or facilities. For businesses that manage daily, weekly, or monthly supply chain review, templates provide a practical and scalable reporting solution. They help standardize performance tracking and support stronger operational decision-making without repetitive report-building effort.
Practical Use Cases for Logistics and Supply Chain Dashboards
Using a Logistics Dashboard for Supply Chain Shipment and Delivery Monitoring
A strong logistics dashboard for supply chain operations helps businesses monitor shipments, delivery timing, and transport reliability in one place. It can show late deliveries, route performance, order flow, and customer fulfillment outcomes clearly. This is especially useful for a logistics company or internal transport function that needs immediate visibility into delays and service risks. Better shipment monitoring improves response speed and reduces the chance that small delivery issues become major customer problems. This kind of reporting strengthens both service control and operational coordination across logistics and transportation activities.
How to Use Supply Chain Dashboards for Inventory and Planning Control
Businesses can use supply chain dashboards for stronger inventory and planning control by reviewing stock positions, reorder timing, and forecast alignment in one report. This helps teams understand whether inventory is supporting service properly or creating risk through shortage or excess. It also supports better planning because users can compare expected demand with actual stock and supply movement. A dashboard makes these patterns easier to understand and helps planning teams act sooner. Better inventory and planning control improves execution and strengthens the business’s ability to operate a more efficient supply chain.
Solutions for Supply Chain Reporting Across Different Business Needs
Different industries need different solutions for supply chain reporting. A manufacturing business may care more about material availability and supplier lead times, while a distributor may focus more on order flow and transport reliability. A retailer may prioritize inventory turnover and store fulfillment. A flexible Logistics and Supply Chain Dashboard Package can support these different needs by adapting KPI views, operational summaries, and exception reporting. This makes the dashboard package more useful in practice and helps ensure that reporting reflects the real priorities of each business and operational environment.
Dashboard Examples and Design Ideas
Learning from Dashboard Examples and Supply Chain Dashboard Examples
Reviewing dashboard examples and supply chain dashboard examples is one of the best ways to improve report quality. Good examples show how to organize summary KPIs, planning views, shipment status, and inventory trends in a way that is easy to follow. They also help teams understand what information belongs on operational versus executive pages. Learning from examples reduces design mistakes and gives faster direction during development. For teams building their first package, studying examples of supply chain dashboards can make the final report more practical, more usable, and more aligned with operational needs.
Understanding the Types of Supply Chain Dashboards and Types of Dashboards
There are many types of supply chain dashboards, and each serves a different purpose. Some are operational, some are strategic, and some focus on planning or risk. More broadly, businesses also work with different types of dashboards depending on whether the audience is management, analysis, or daily operations. Understanding these differences helps teams choose the right structure for their reporting goals. A business that needs real-time transport control may need a different dashboard than one focused on forecasting or supplier performance. Choosing the right type improves usability and reporting value.
Choosing the Right Management Dashboard for Supply Chain Management Level Needs
The right management dashboard depends on the supply chain management level of the user. Frontline users need exception visibility and daily execution details, while senior managers often need summary performance, risk exposure, and trend review. A strong Logistics and Supply Chain Dashboard Package should serve these different audiences in a structured way. This is especially important in a modern supply chain, where information needs vary across teams and hierarchy levels. Choosing the right dashboard structure improves communication, reduces clutter, and makes the reporting more useful for both operational and leadership review.
Conclusion
Why a Logistics and Supply Chain Dashboard Package Is a Practical Business Tool
A Logistics and Supply Chain Dashboard Package is a practical business tool because it brings structure, visibility, and consistency to complex operational reporting. It helps teams review shipments, inventory, fulfillment, and supplier performance more clearly and act on problems earlier. It also improves communication across functions by giving everyone a shared view of results. For businesses managing dynamic operations, this kind of reporting is essential. A well-designed dashboard package supports better control, better planning, and stronger performance across the full logistics and supply chain environment.
Final Thoughts on Using a Logistics and Supply Chain Dashboard Package Template for Better Supply Chain Visibility
A well-built Logistics and Supply Chain Dashboard Package template helps businesses improve supply chain visibility, strengthen execution, and make better operational decisions. It supports clearer reporting across inventory, shipment flow, and fulfillment performance while giving users a more complete picture of activity across the supply chain. Better visibility leads to better control, and better control leads to better service, lower risk, and stronger performance. For businesses that want clearer operations and faster response, a dashboard package is one of the most valuable tools they can use.
For ready-to-use Dashboard Templates: