
What is a Financial Services Sector Dashboard?
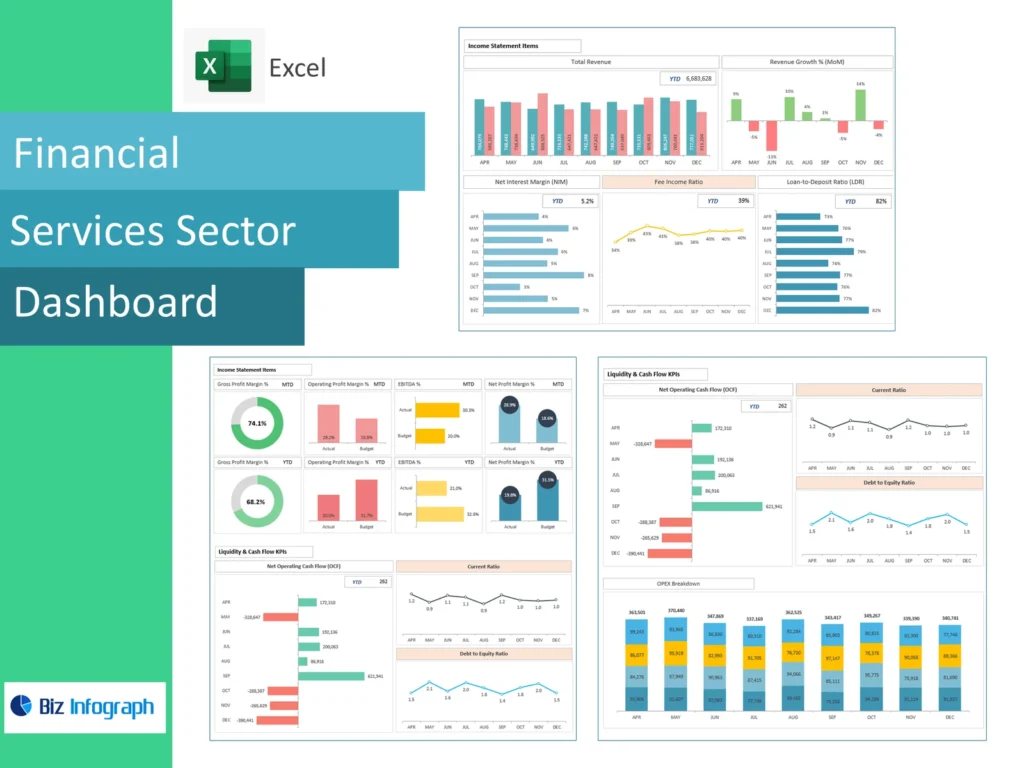
How a financial dashboard works as a powerful tool for financial institutions
A financial dashboard is a powerful tool that pulls data from multiple finance and operational systems — ERP, accounting software, and spreadsheet exports — into one organized view. For banks and credit unions, wealth management firms, and large corporations alike, it gives finance teams a single place to track key performance indicators instead of switching between disconnected reports. CFOs and finance professionals rely on this consolidated financial picture to manage risk, monitor financial health, and respond to market conditions without waiting on manual data pulls.
Key differences between a performance dashboard and a standard reporting tool
A standard reporting tool typically shows static numbers from a closed period. A performance dashboard, by contrast, compares actuals against rolling forecasts and financial goals in real time, helping financial analysts spot variance as it happens. This shift from backward-looking reporting to forward-looking financial analysis is what separates a sophisticated financial dashboard from a basic spreadsheet. For financial services firms operating in volatile market conditions, that difference can mean catching financial risk weeks before it shows up in a quarterly close.
Core metrics tracked across the financial services sector
Financial performance metrics: revenue, margins, and portfolio health indicators
Financial performance metrics form the backbone of any dashboard built for the financial services sector. Return on equity and return on assets reveal how efficiently a firm is generating income from its capital, while accounts receivable aging and loan portfolio quality show near-term cash and risk exposure. Tracking these key metrics together gives financial professionals a detailed financial view of growth and profitability, helping them identify financial challenges early and protect long-term profitability across the organization.
Real-time analytics for tracking the financial services industry’s moving parts
The financial services industry moves quickly, and real-time data is what allows finance teams to keep pace. Financial analytics dashboards aggregate daily financial activity from multiple systems, giving stakeholders real-time insights into market performance and actual performance against budget. For financial firms exposed to interest rate shifts or credit market volatility, this kind of business intelligence helps teams react to changing market conditions proactively rather than discovering issues after the fact in a delayed monthly report.
Portfolio and venture capital metrics for a complete financial picture
For venture capital firms and wealth management teams, assets under management and portfolio performance sit at the center of the dashboard. Tracking these alongside broader financial markets context helps teams understand how their holdings compare to the economy as a whole. Combining portfolio metrics with savings accounts and credit products data — for firms that offer both — produces a more complete financial picture, giving finance professionals the actionable insights needed to rebalance, hedge, or reallocate capital with confidence.
Financial Services Sector Dashboard template: how to get started
Choosing the right dashboard template for your financial institution’s needs
A Financial Services Sector Dashboard template should reflect the scale and complexity of your organization — a CFO dashboard for a large corporation looks different from one built for a community bank. Start by identifying the financial instruments and revenue lines most relevant to your business, then select a template that surfaces those key performance indicators by default. The best financial dashboard templates are flexible enough to adapt as financial goals shift, without requiring a full rebuild each quarter.
Financial dashboard example: a step-by-step template for financial planning
A practical financial dashboard example for financial planning starts with a summary panel showing actuals versus rolling forecasts, followed by department-level performance data and a risk exposure snapshot. This step-by-step structure helps finance teams move from high-level financial health down to the underlying drivers without losing context. Many financial services firms across the U.S. use this layered template approach to support both day-to-day financial management and longer-term strategic planning in a single, organized view.
Financial Services Sector Dashboard Excel: building it in a spreadsheet
Setting up your financial dashboard Excel file with key metric columns
A Financial Services Sector Dashboard Excel file remains a common starting point for smaller financial firms without a dedicated analytics platform. Build columns for revenue, expenses, return on assets, and loan portfolio performance, then use pivot tables to break down financial performance by business unit or product line. Conditional formatting can flag metrics that fall outside target ranges, helping financial analysts spot financial challenges quickly even when working from a basic spreadsheet rather than a connected ERP feed.
When to move from Excel to a real-time financial reporting tool
Spreadsheets work well for small, slow-moving data sets, but financial firms operating across multiple markets quickly outgrow them. A dedicated financial reporting tool connects directly to ERP and banking systems, delivering real-time data instead of a static export. For organizations managing financial risk across volatile financial markets, this shift gives finance professionals access to critical information the moment it changes — letting CFOs make data-driven decisions instead of relying on figures that may already be a week old.
Using the dashboard to make data-driven decisions across the sector
How financial planning teams use real-time data to guide strategy
Financial planning teams use dashboard-driven real-time data to build more accurate forecasts and adjust strategy as market conditions shift. Rather than relying solely on quarterly actuals, teams can compare rolling forecasts against live performance data to optimize budgets throughout the year. This ongoing visibility helps organizations across the financial sector — from banking industry players to insurance providers — stay ahead of financial risk and make informed decisions grounded in current numbers rather than outdated assumptions.
Supporting venture capital and investment decisions with live financial analytics
Venture capital firms and investment teams depend on live financial analytics to evaluate portfolio companies and market opportunities. A connected dashboard surfaces insights gleaned from assets under management, growth trends, and sector-specific risk exposure, helping investment professionals act before market windows close. This same approach extends to other financial instruments, giving stakeholders the tools to analyze deal performance and future performance projections without waiting for analysts to manually compile updates from scattered sources.
Financial Services Sector Dashboard best practices for financial institutions
Keeping your financial dashboard data clean for accurate reporting
The reliability of any financial dashboard depends on the quality of the data feeding it. Before connecting an ERP system or building out financial reporting views, financial institutions should audit data sources for duplicate entries, mismatched account codes, and inconsistent categorization. Clean, well-governed data is what allows a dashboard to produce accurate forecasts and trustworthy key performance indicators — giving CFOs and finance teams the confidence to base organizational decisions on the numbers in front of them.
Scaling your dashboard into a full financial analytics system
As financial firms grow, a single dashboard example can expand into a full financial analytics system covering every part of the business. Layering in wealth management data, credit products performance, and rolling forecasts turns a basic reporting tool into a sophisticated financial dashboard capable of supporting the entire organization. This scaled approach helps banks and credit unions, as well as larger financial services firms, maintain a unified financial picture as transaction volume and product complexity increase over time.
For ready-to-use Dashboard Templates: