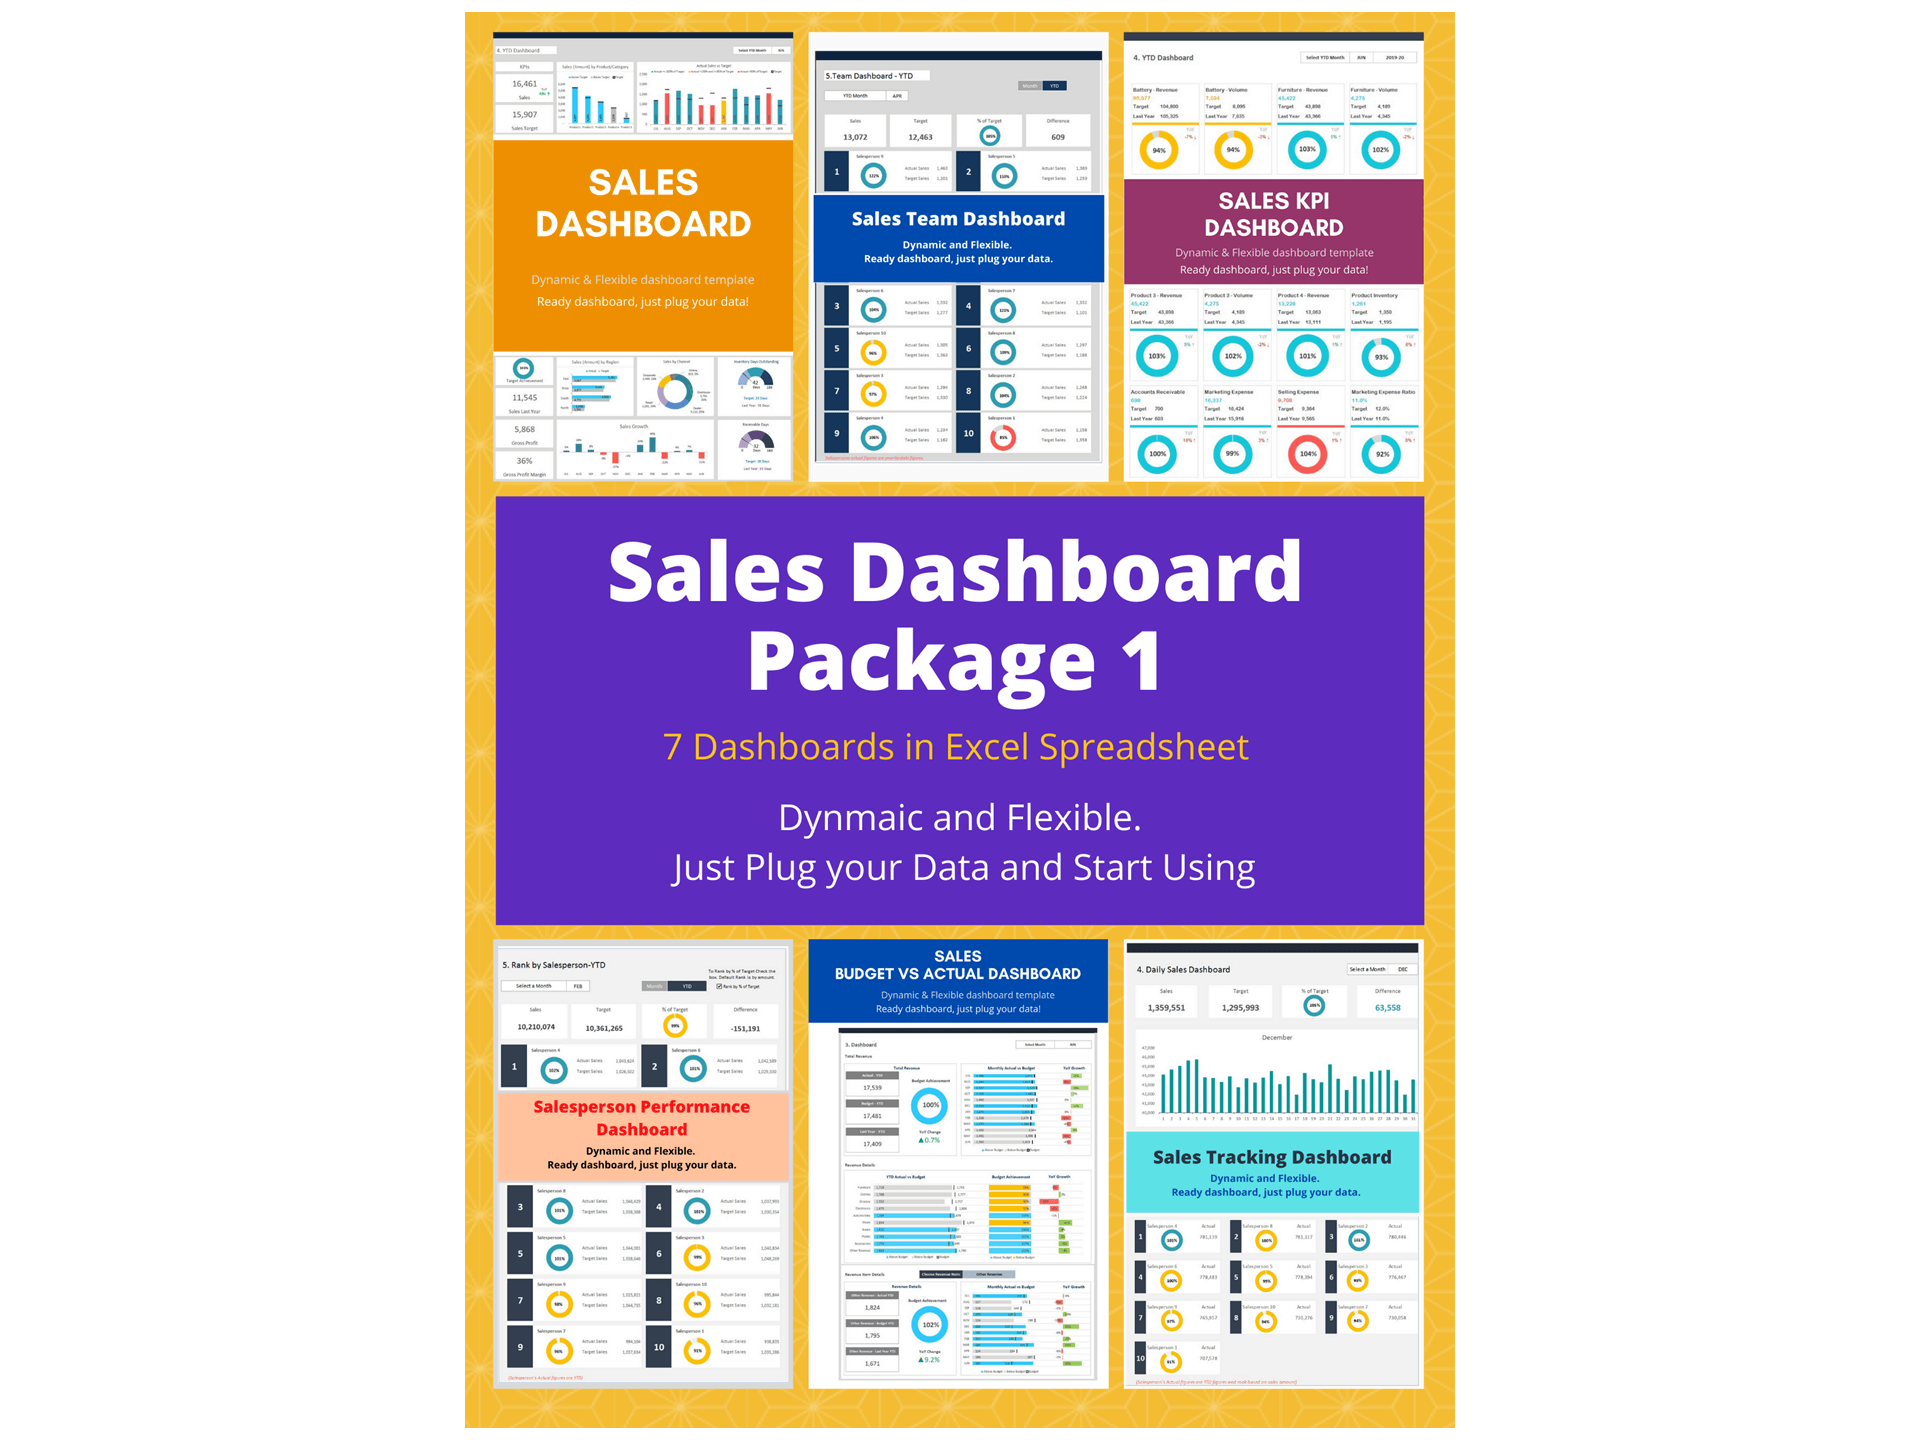
Sales KPI Dashboard Excel Template and Google Sheets
The Sales KPI Dashboard Excel Template is a powerful Dashboard in Excel designed to help businesses monitor and improve their Sales Performance through clear data visualization and performance tracking. This template provides a structured way to analyze key sales metrics and measure progress toward business goals.
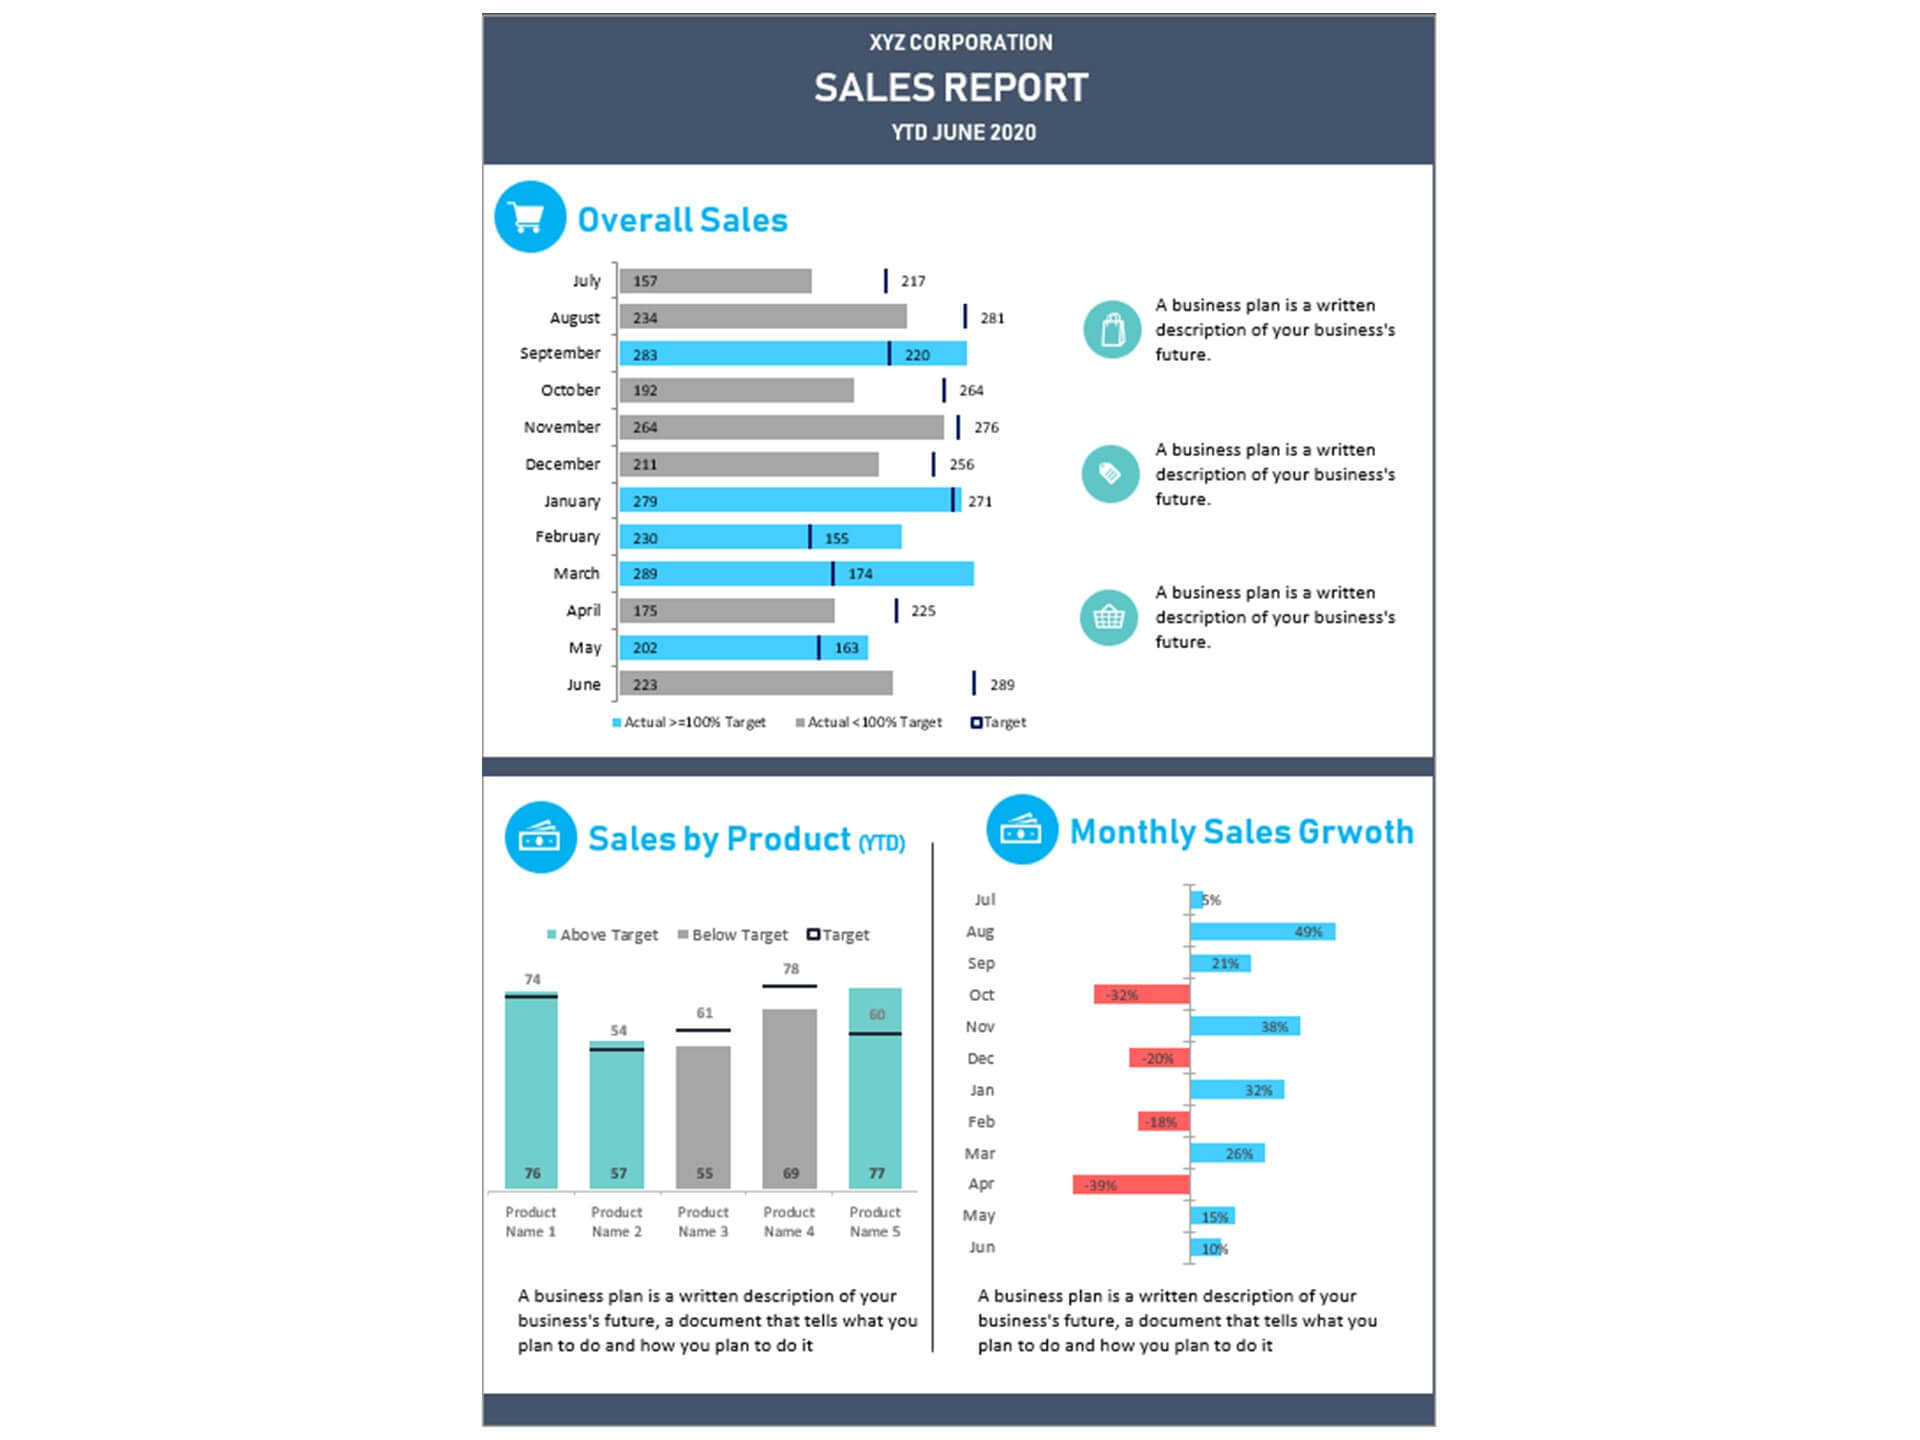
The Sales KPI Dashboard consolidates important sales data into one comprehensive Sales Dashboard, allowing managers to quickly review revenue trends, target achievement, product performance, and regional sales results. By displaying key Sales KPI metrics such as sales growth, conversion rates, and average deal value, the dashboard helps leadership teams understand how effectively the sales team is performing.
Built as a Dynamic Dashboard, the template automatically updates charts and reports when new sales data is entered. This feature makes it easy for organizations to maintain accurate and up-to-date sales reporting without manual recalculations. The visual charts and performance indicators make complex data easy to interpret for managers and executives.
As a practical Business Dashboard, the template supports strategic decision-making by highlighting strengths, identifying sales gaps, and tracking progress against targets. Overall, the Sales KPI Dashboard Excel Template helps businesses improve performance analysis, strengthen sales strategies, and drive sustainable revenue growth.
Unleash the Power of Data Visualization
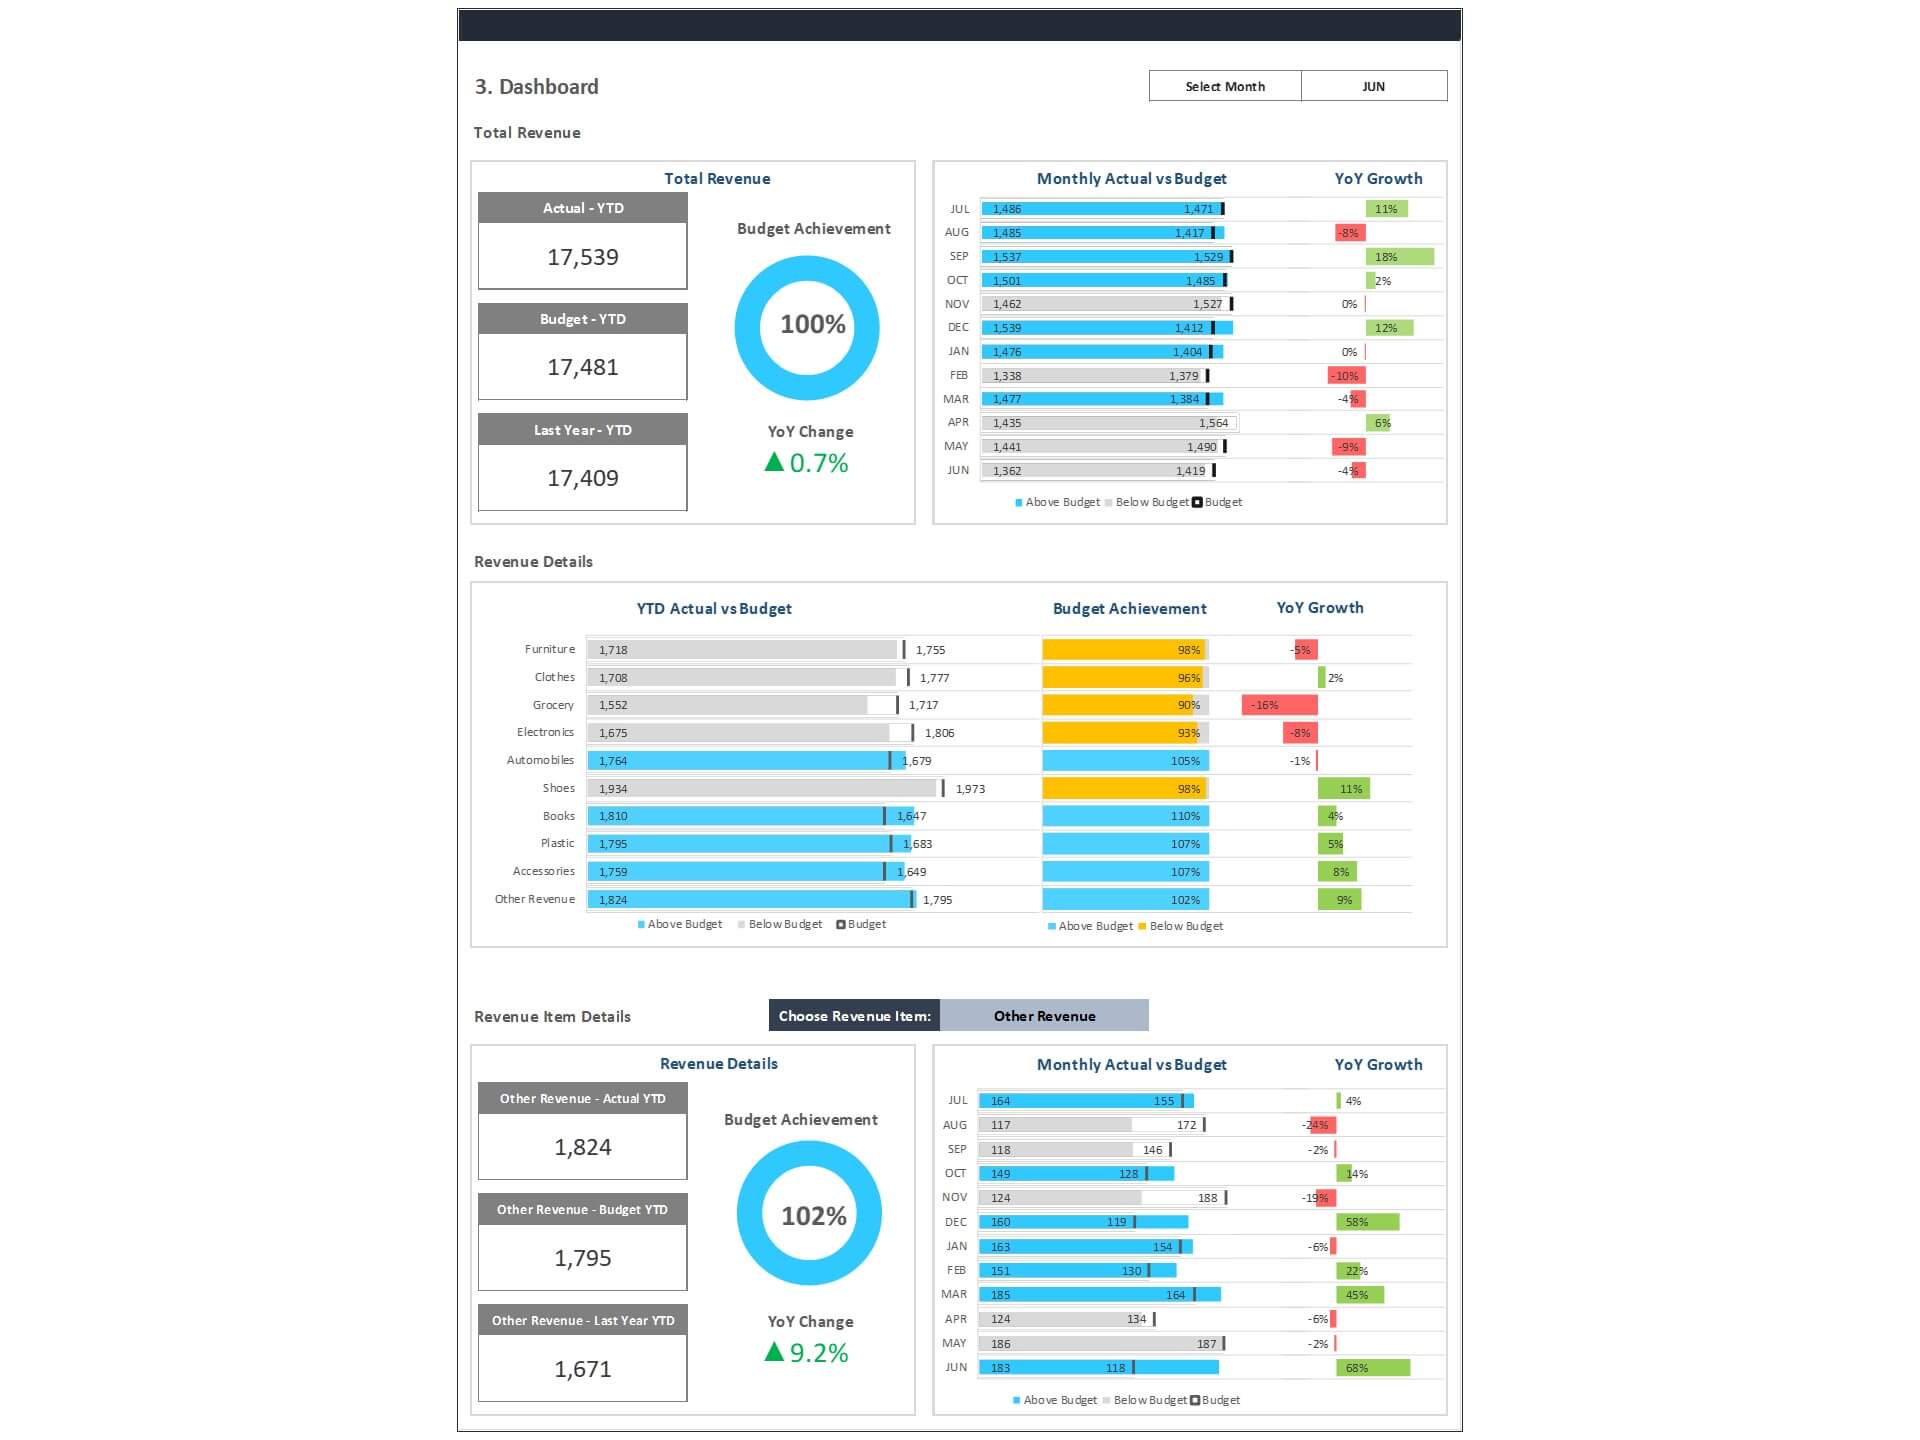
The Sales KPI Dashboard Excel Template is designed to transform complex sales data into actionable insights at a glance. Featuring a visually appealing and intuitive interface, this template allows you to display critical sales metrics, trends, and performance indicators in a way that's easy to understand. With customizable charts, graphs, and tables, you can instantly identify patterns, assess performance, and spot opportunities for growth.
Key Features:
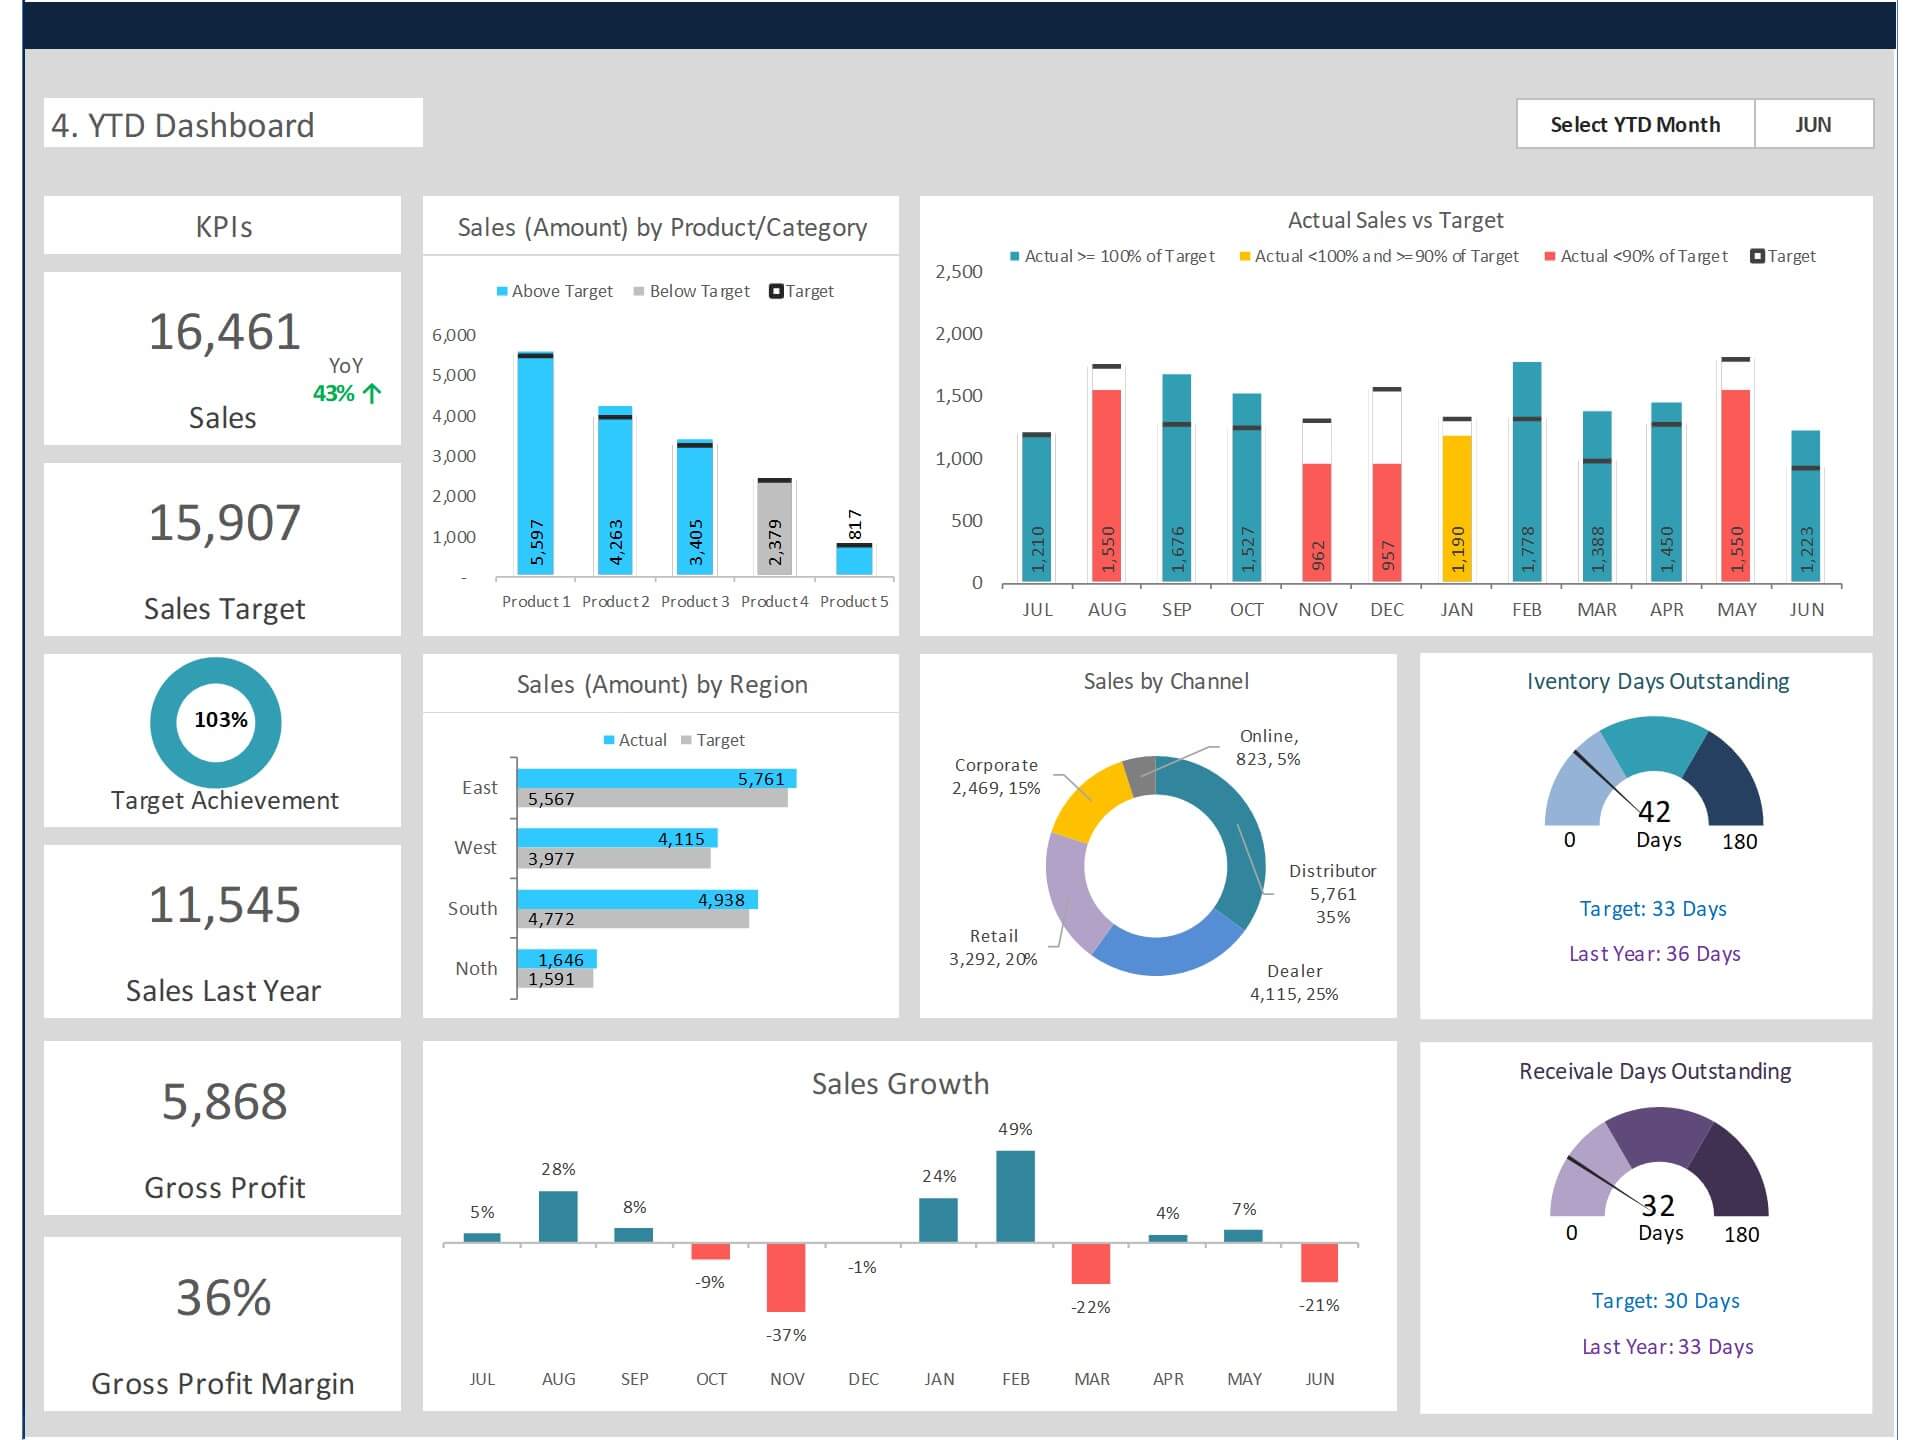
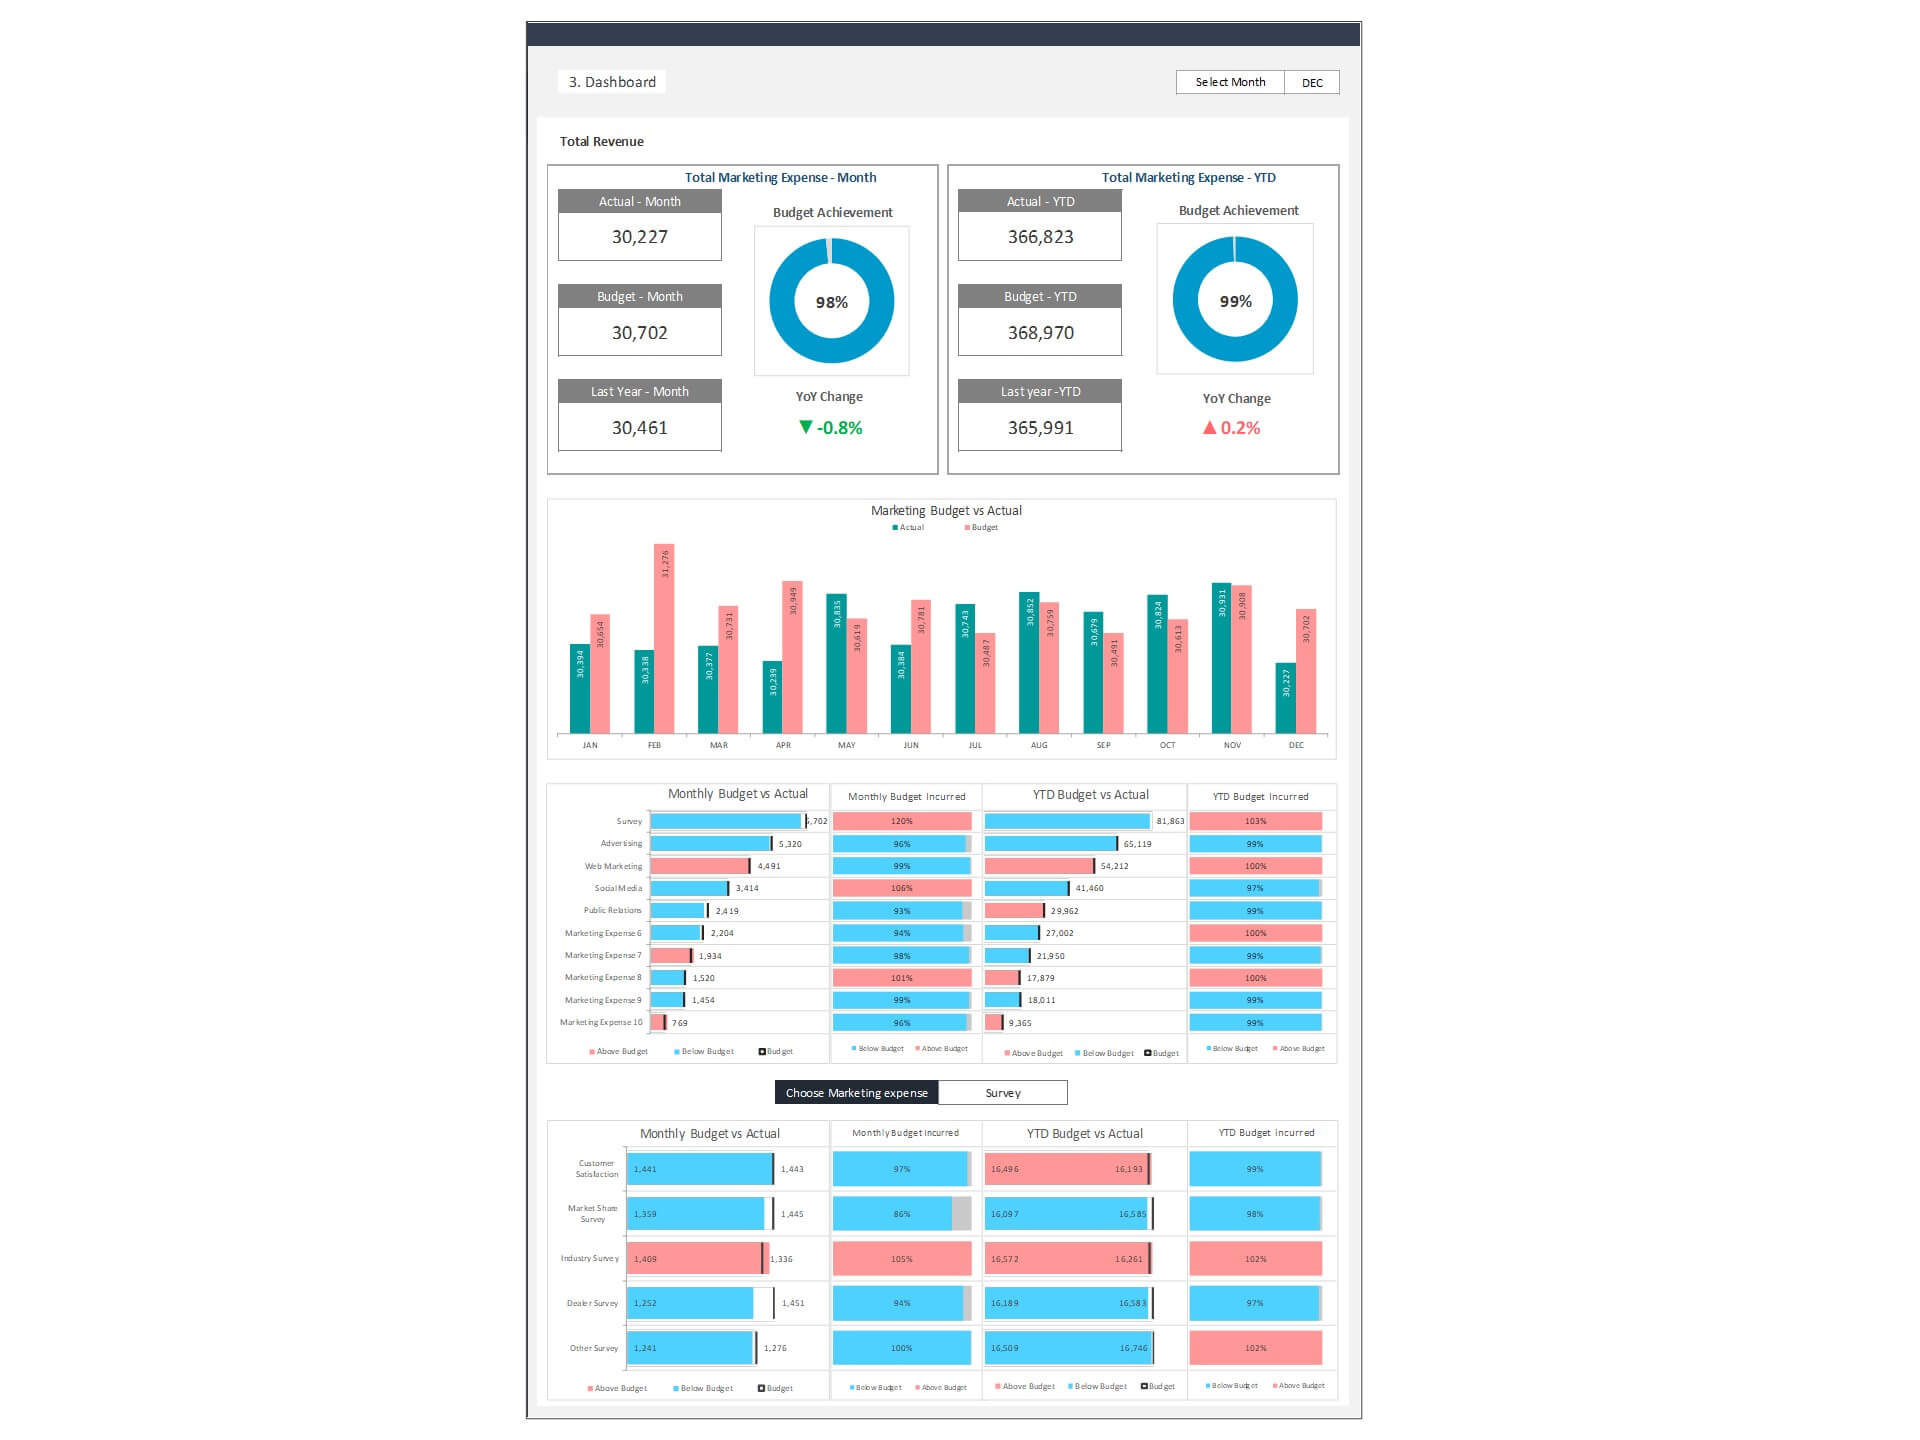
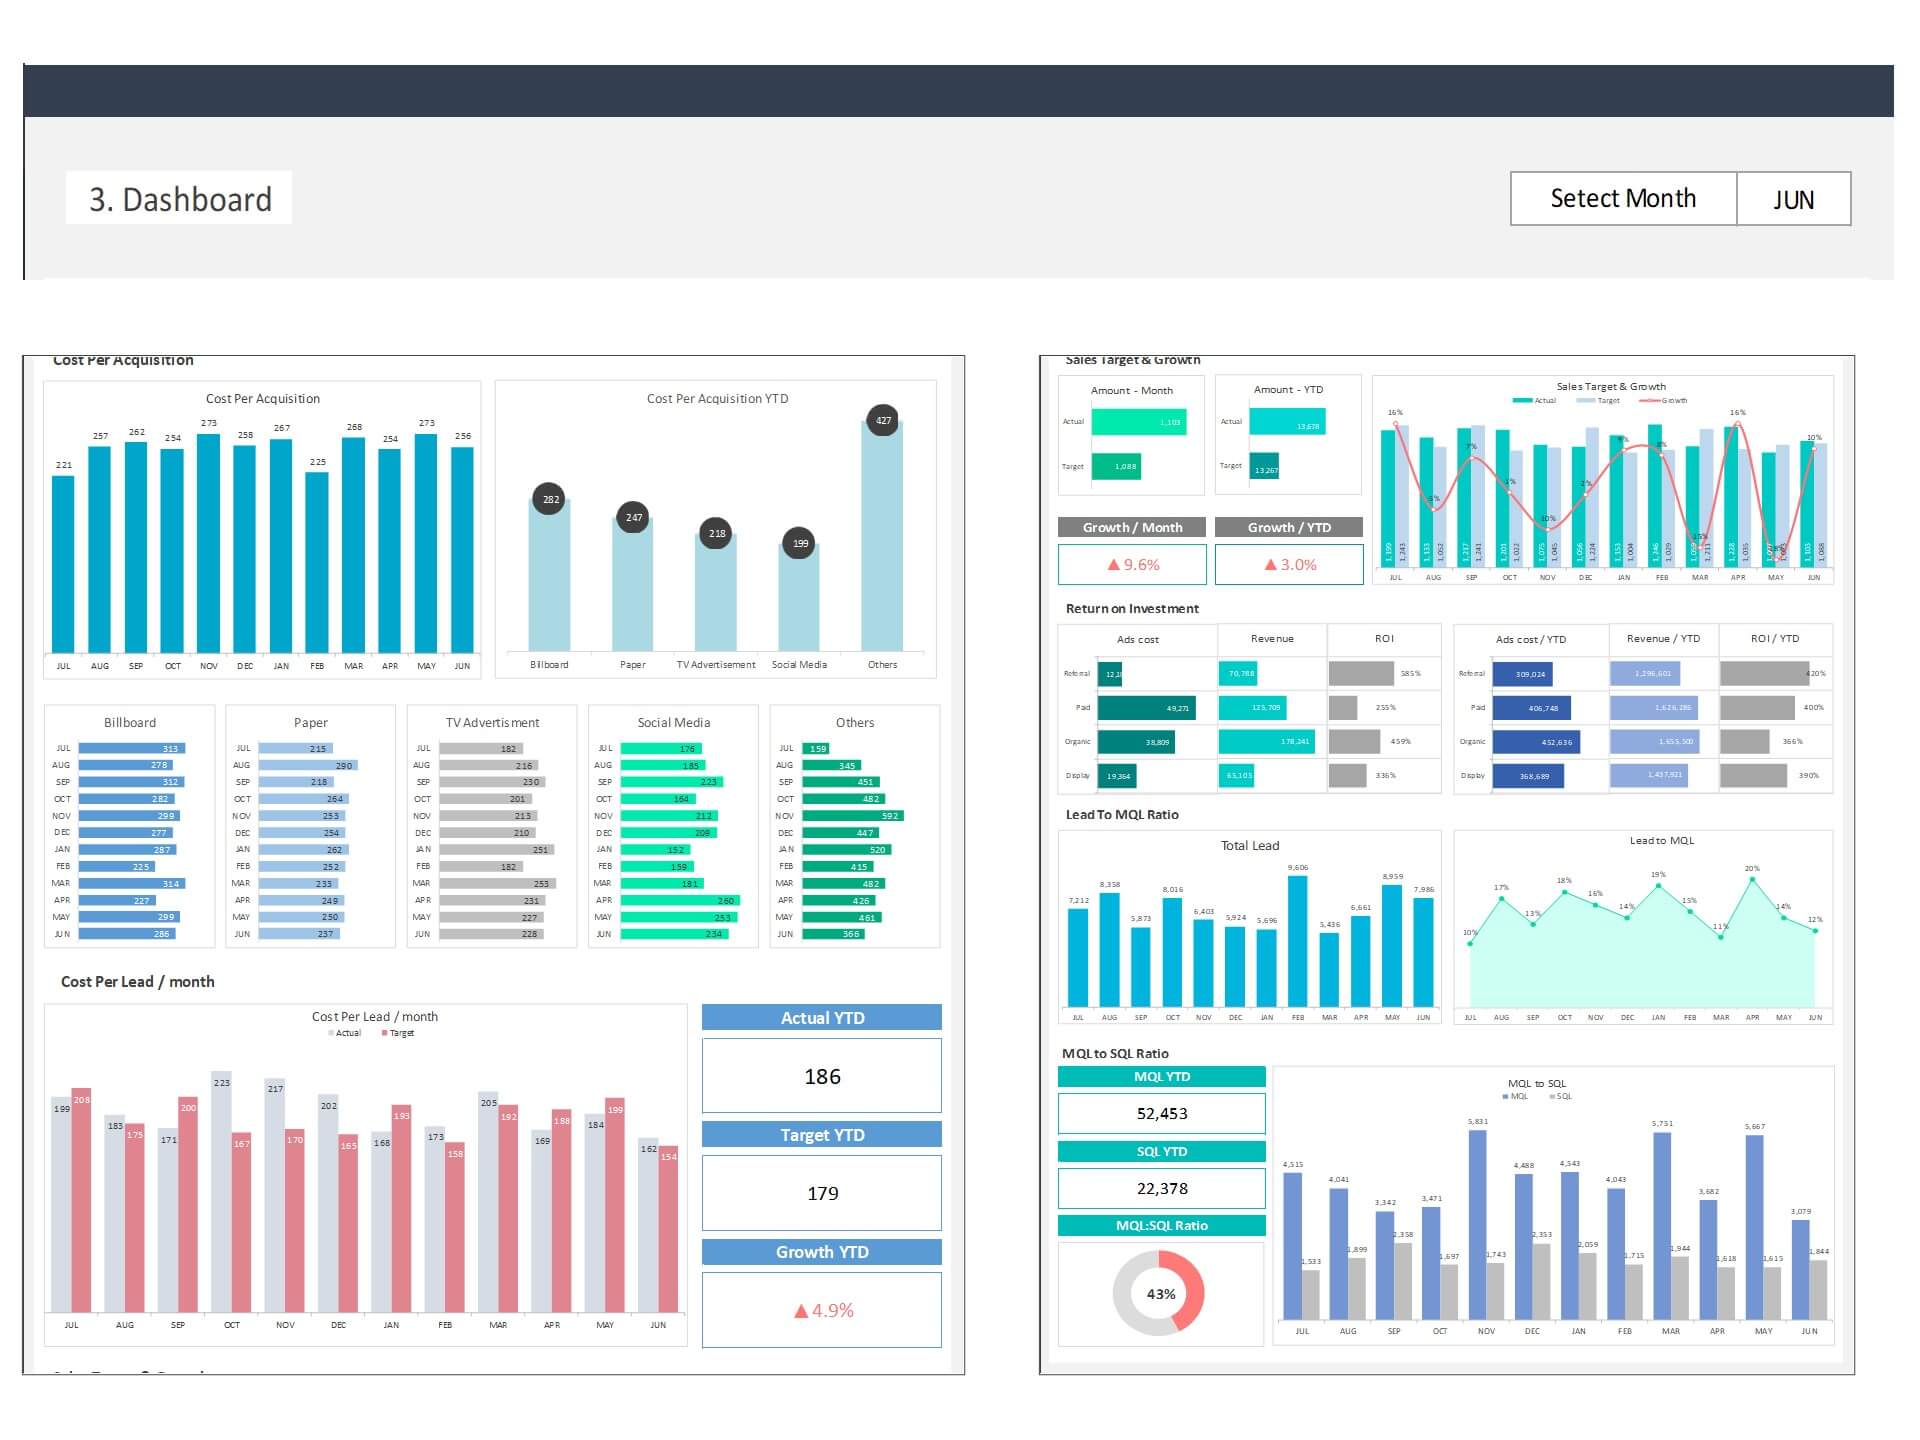
- Comprehensive KPI Tracking: Monitor a wide range of KPIs, including sales revenue, profit margins, customer acquisition costs, and more, all in one place.
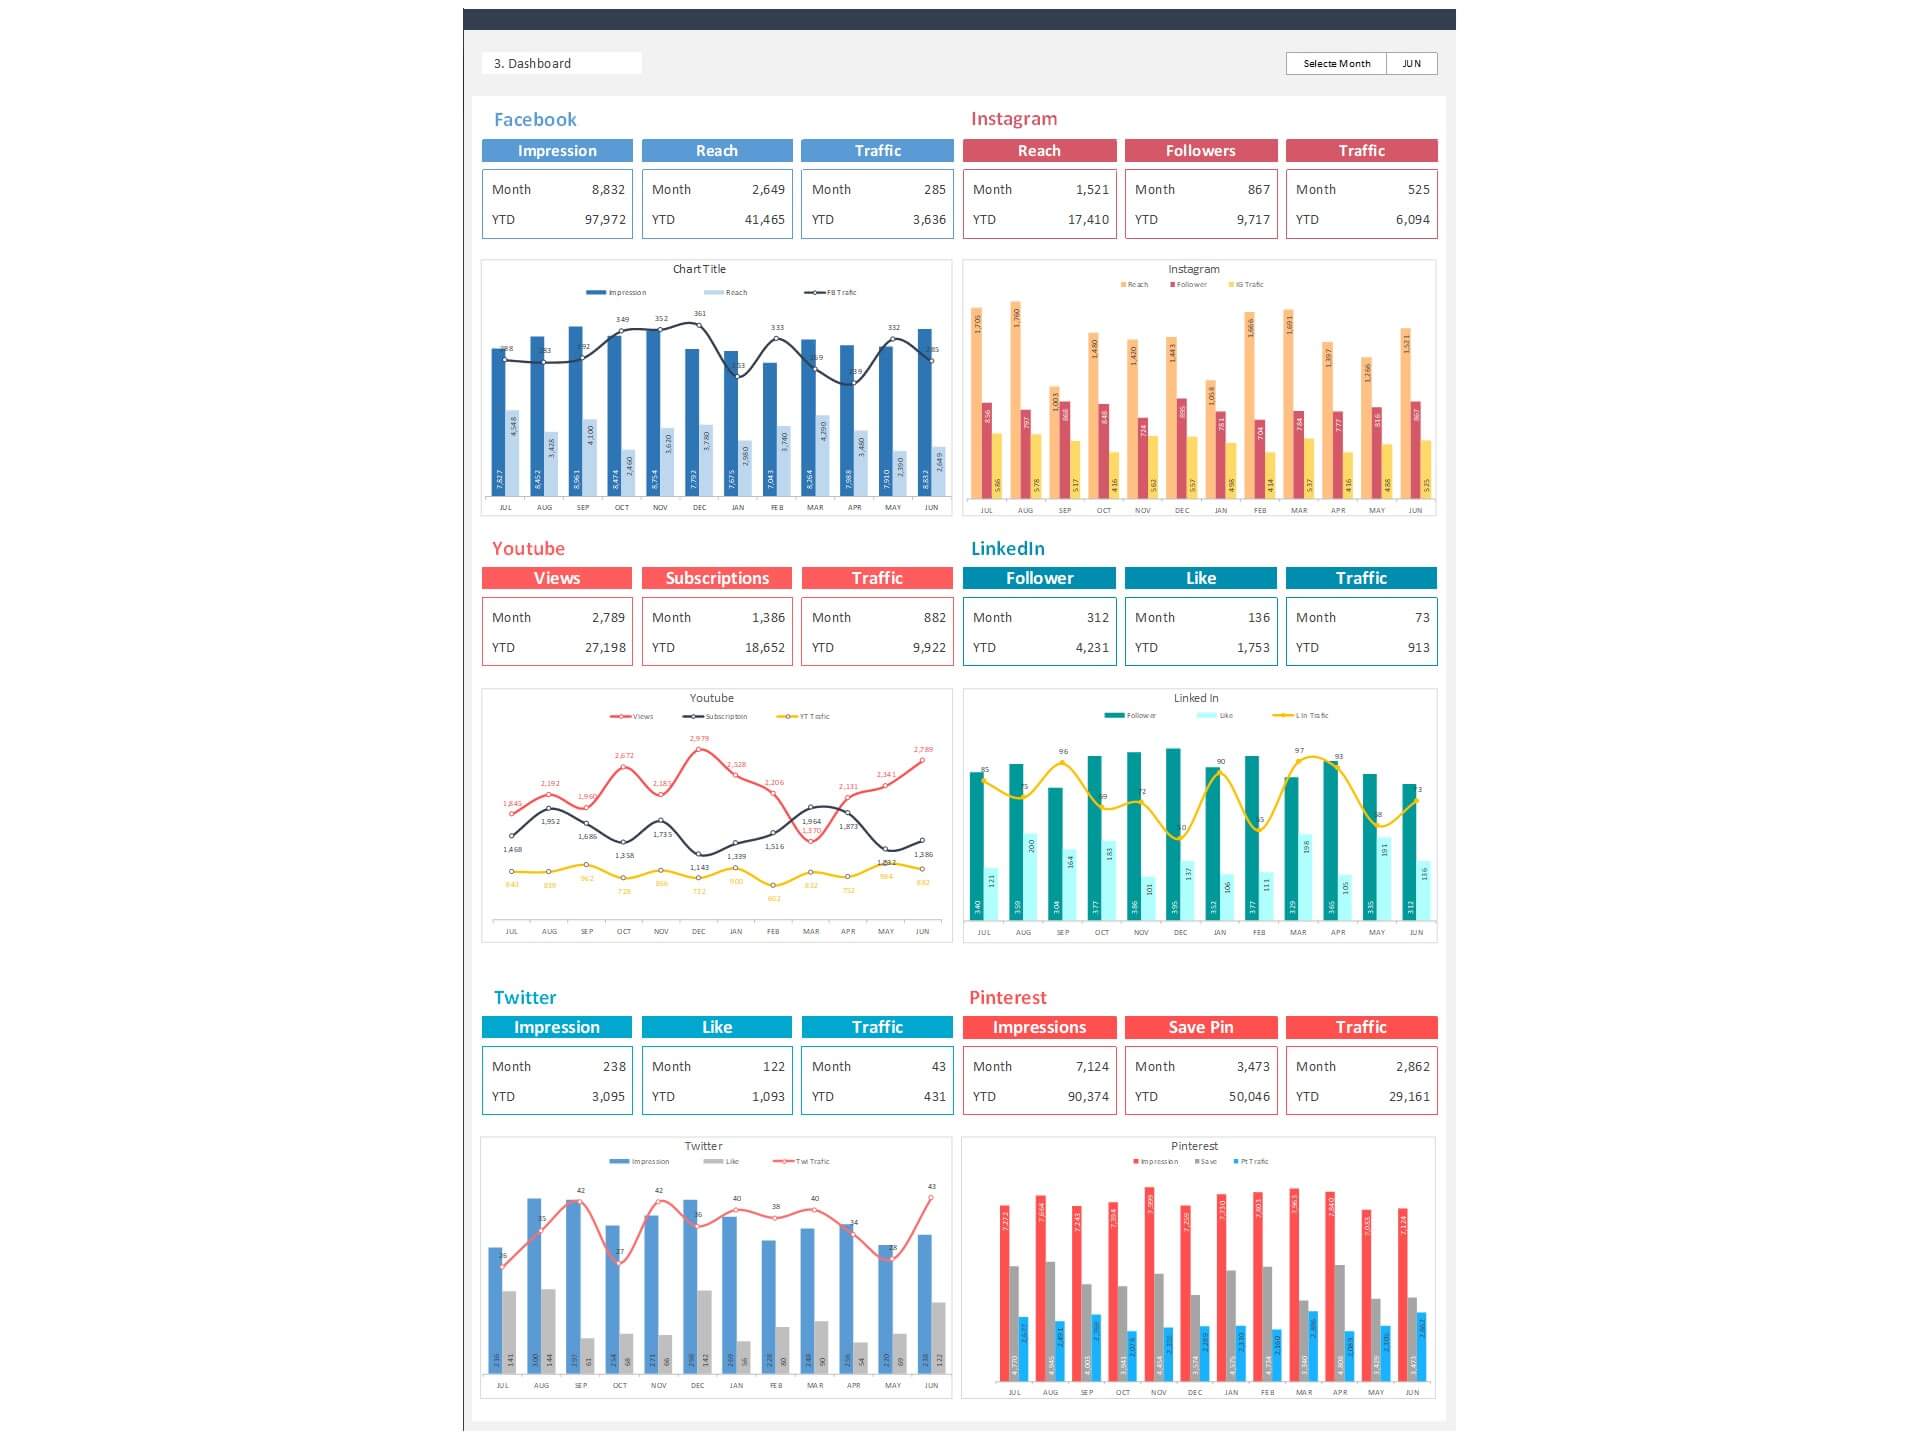
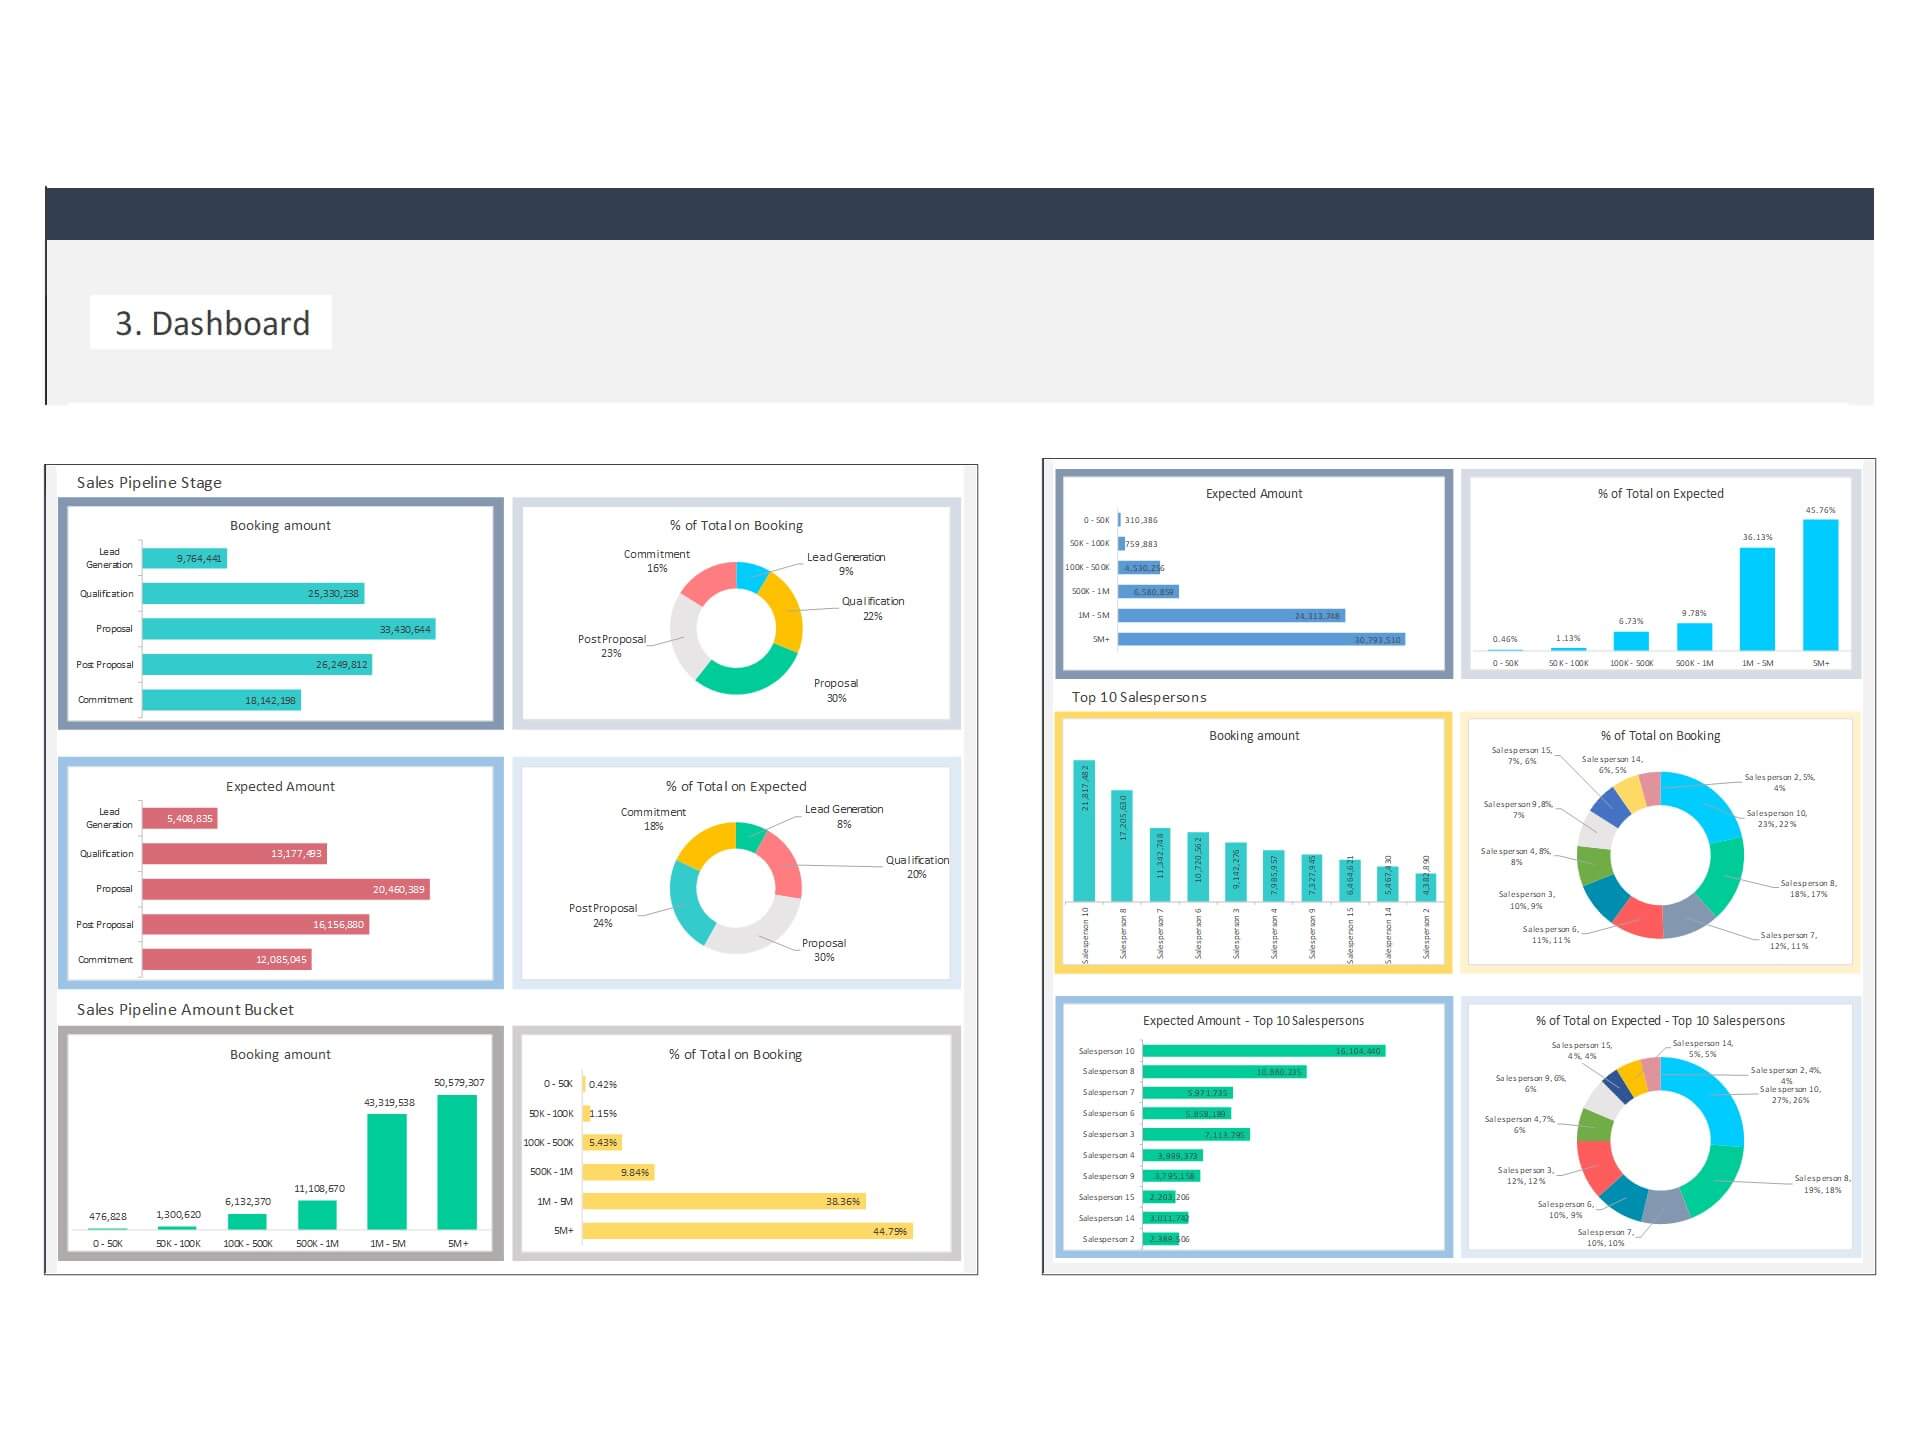
- Interactive Charts: Visualize your data with interactive charts like line graphs, bar charts, and pie charts, providing a clear picture of your sales performance.
- Forecasting: Leverage historical data to create accurate sales forecasts, enabling you to plan inventory, allocate resources, and set realistic targets.
- Goal Tracking: Set specific sales goals and track your progress towards achieving them, motivating your team to strive for success.
- Cost Analysis: Keep an eye on expenses related to sales activities, helping you manage costs and optimize your budget.
Benefits of Using the Sales KPI Dashboard Excel Template:
- Efficiency: Say goodbye to manual data analysis and reporting. With this template, you can generate comprehensive sales reports in a matter of minutes.
- Visibility: Gain a 360-degree view of your sales performance, allowing you to spot trends and outliers that may otherwise go unnoticed.
- Data-Driven Decisions: Base your business decisions on real-time, accurate data, ensuring you're always on the right track.
- Goal Alignment: Keep your team aligned with your sales goals, ensuring everyone is working towards a common objective.
- Competitive Advantage: Stay ahead of your competitors by responding quickly to market changes and customer preferences.
- Customization: Tailor the dashboard to your specific business needs, adding or removing KPIs and charts as required.
- User-Friendly: You don't need to be a data expert to use this template. Its user-friendly interface makes it accessible to everyone in your organization.
Who Can Benefit from the Sales KPI Dashboard Excel Template:
- Small Business Owners: Easily track sales performance, identify growth opportunities, and make data-driven decisions without the need for a dedicated analytics team.
- Sales Managers: Monitor your team's performance, set targets, and motivate your sales force to achieve their goals.
- Executives and CEOs: Gain a high-level overview of your company's sales performance and make strategic decisions to drive success.
- Finance Teams: Use the template to analyze revenue streams, assess profitability, and manage budgets effectively.
- Marketing Teams: Understand customer behavior, track campaign performance, and optimize marketing efforts based on real data.
- Retailers and E-commerce Businesses: Keep a close watch on product sales, inventory levels, and customer satisfaction, ensuring seamless operations.
Key Features:
- Provides key financial insights for the Sales team with details of targeted vital performance indicators
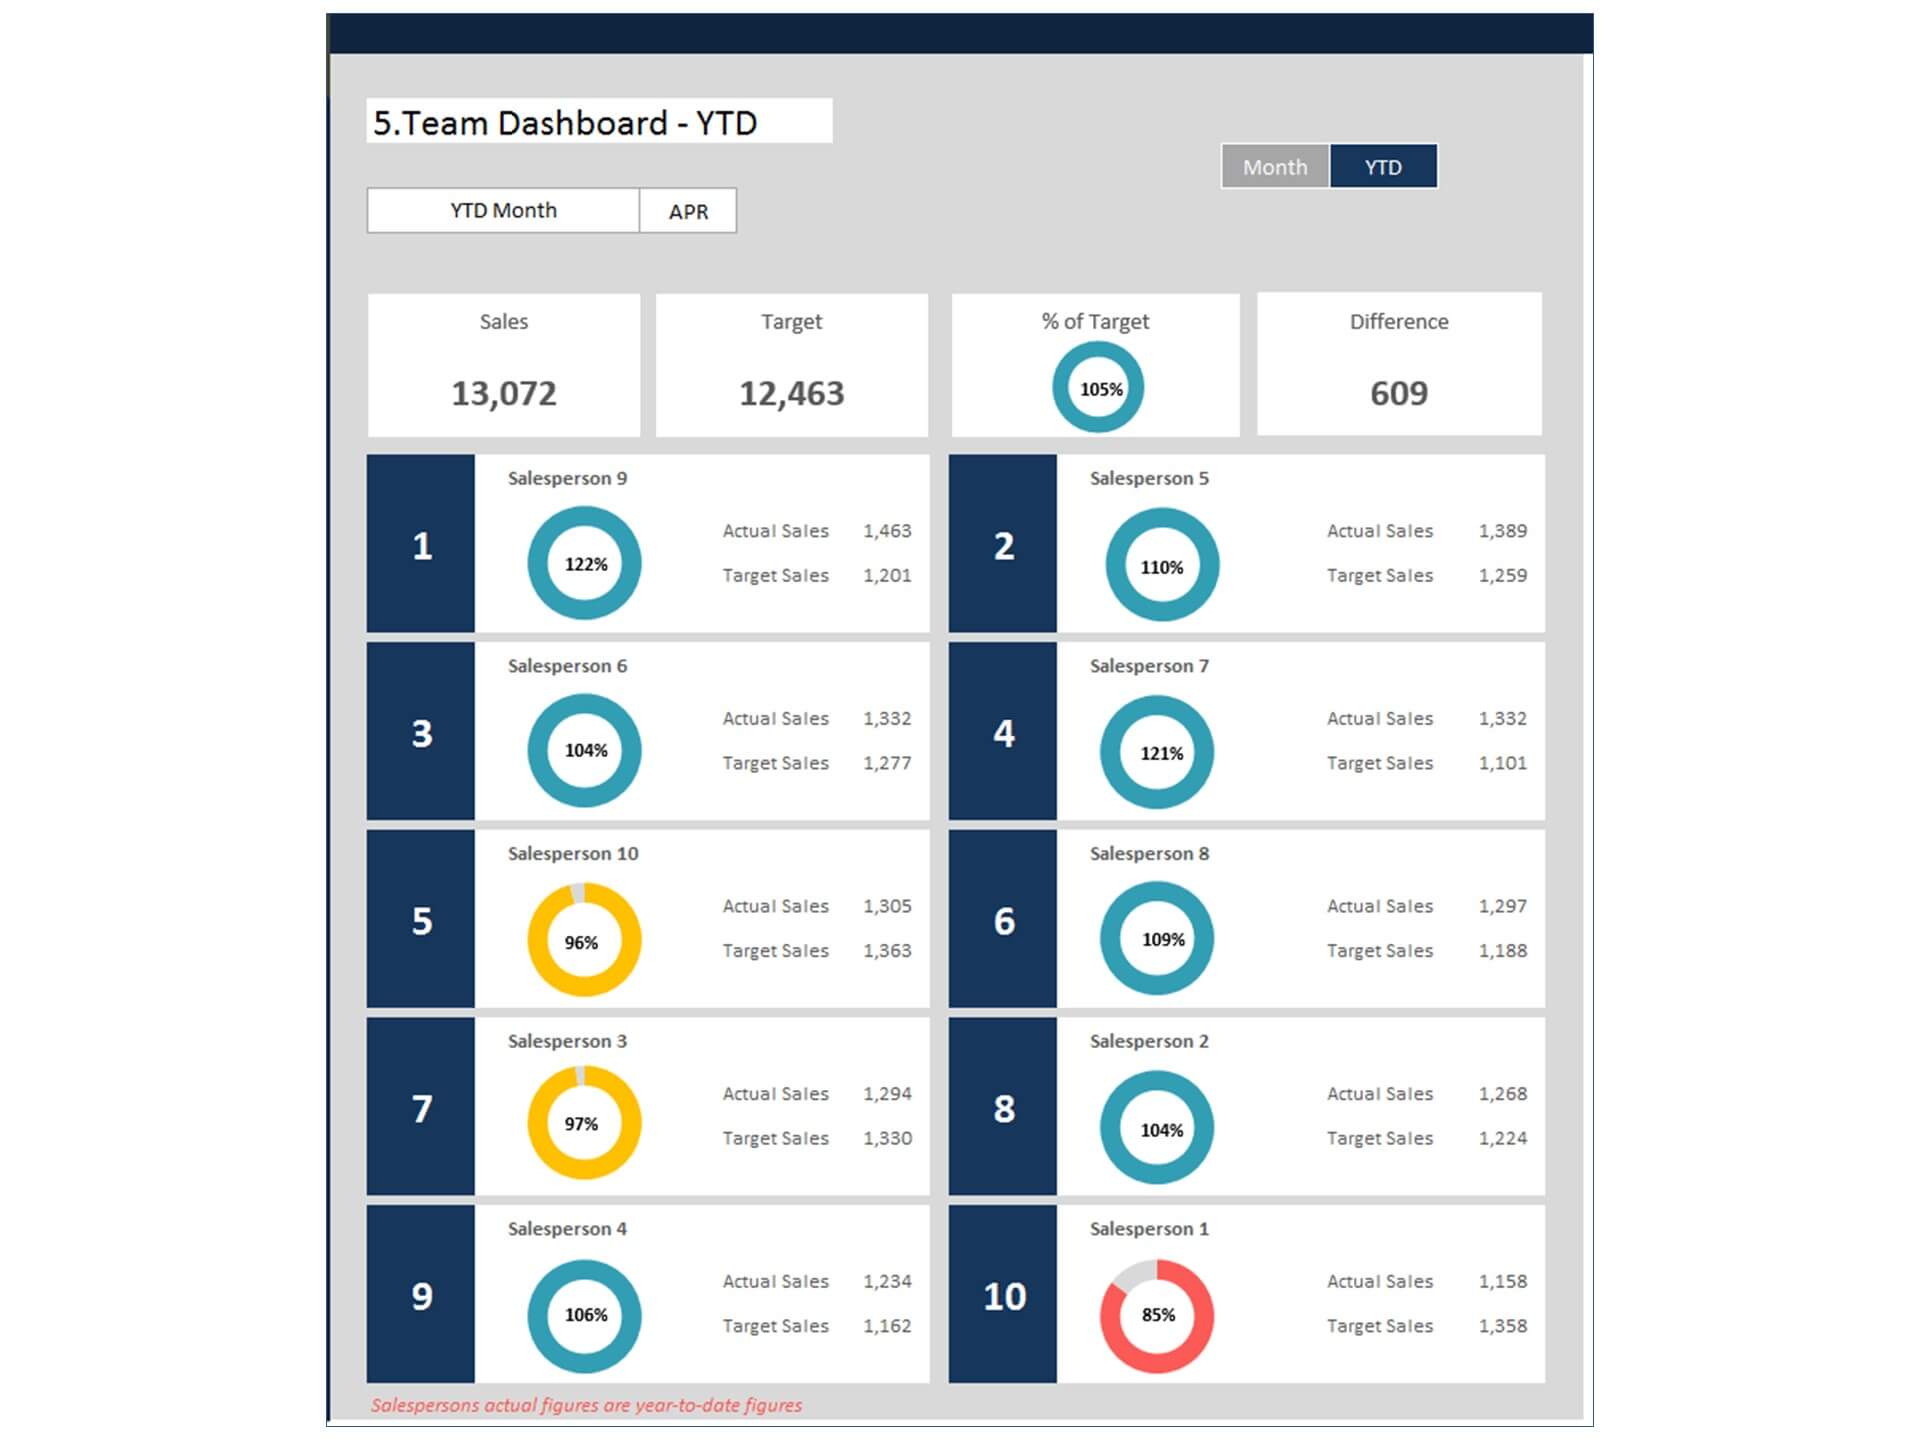
- Beautiful dashboard and reports to display performance KPI’s
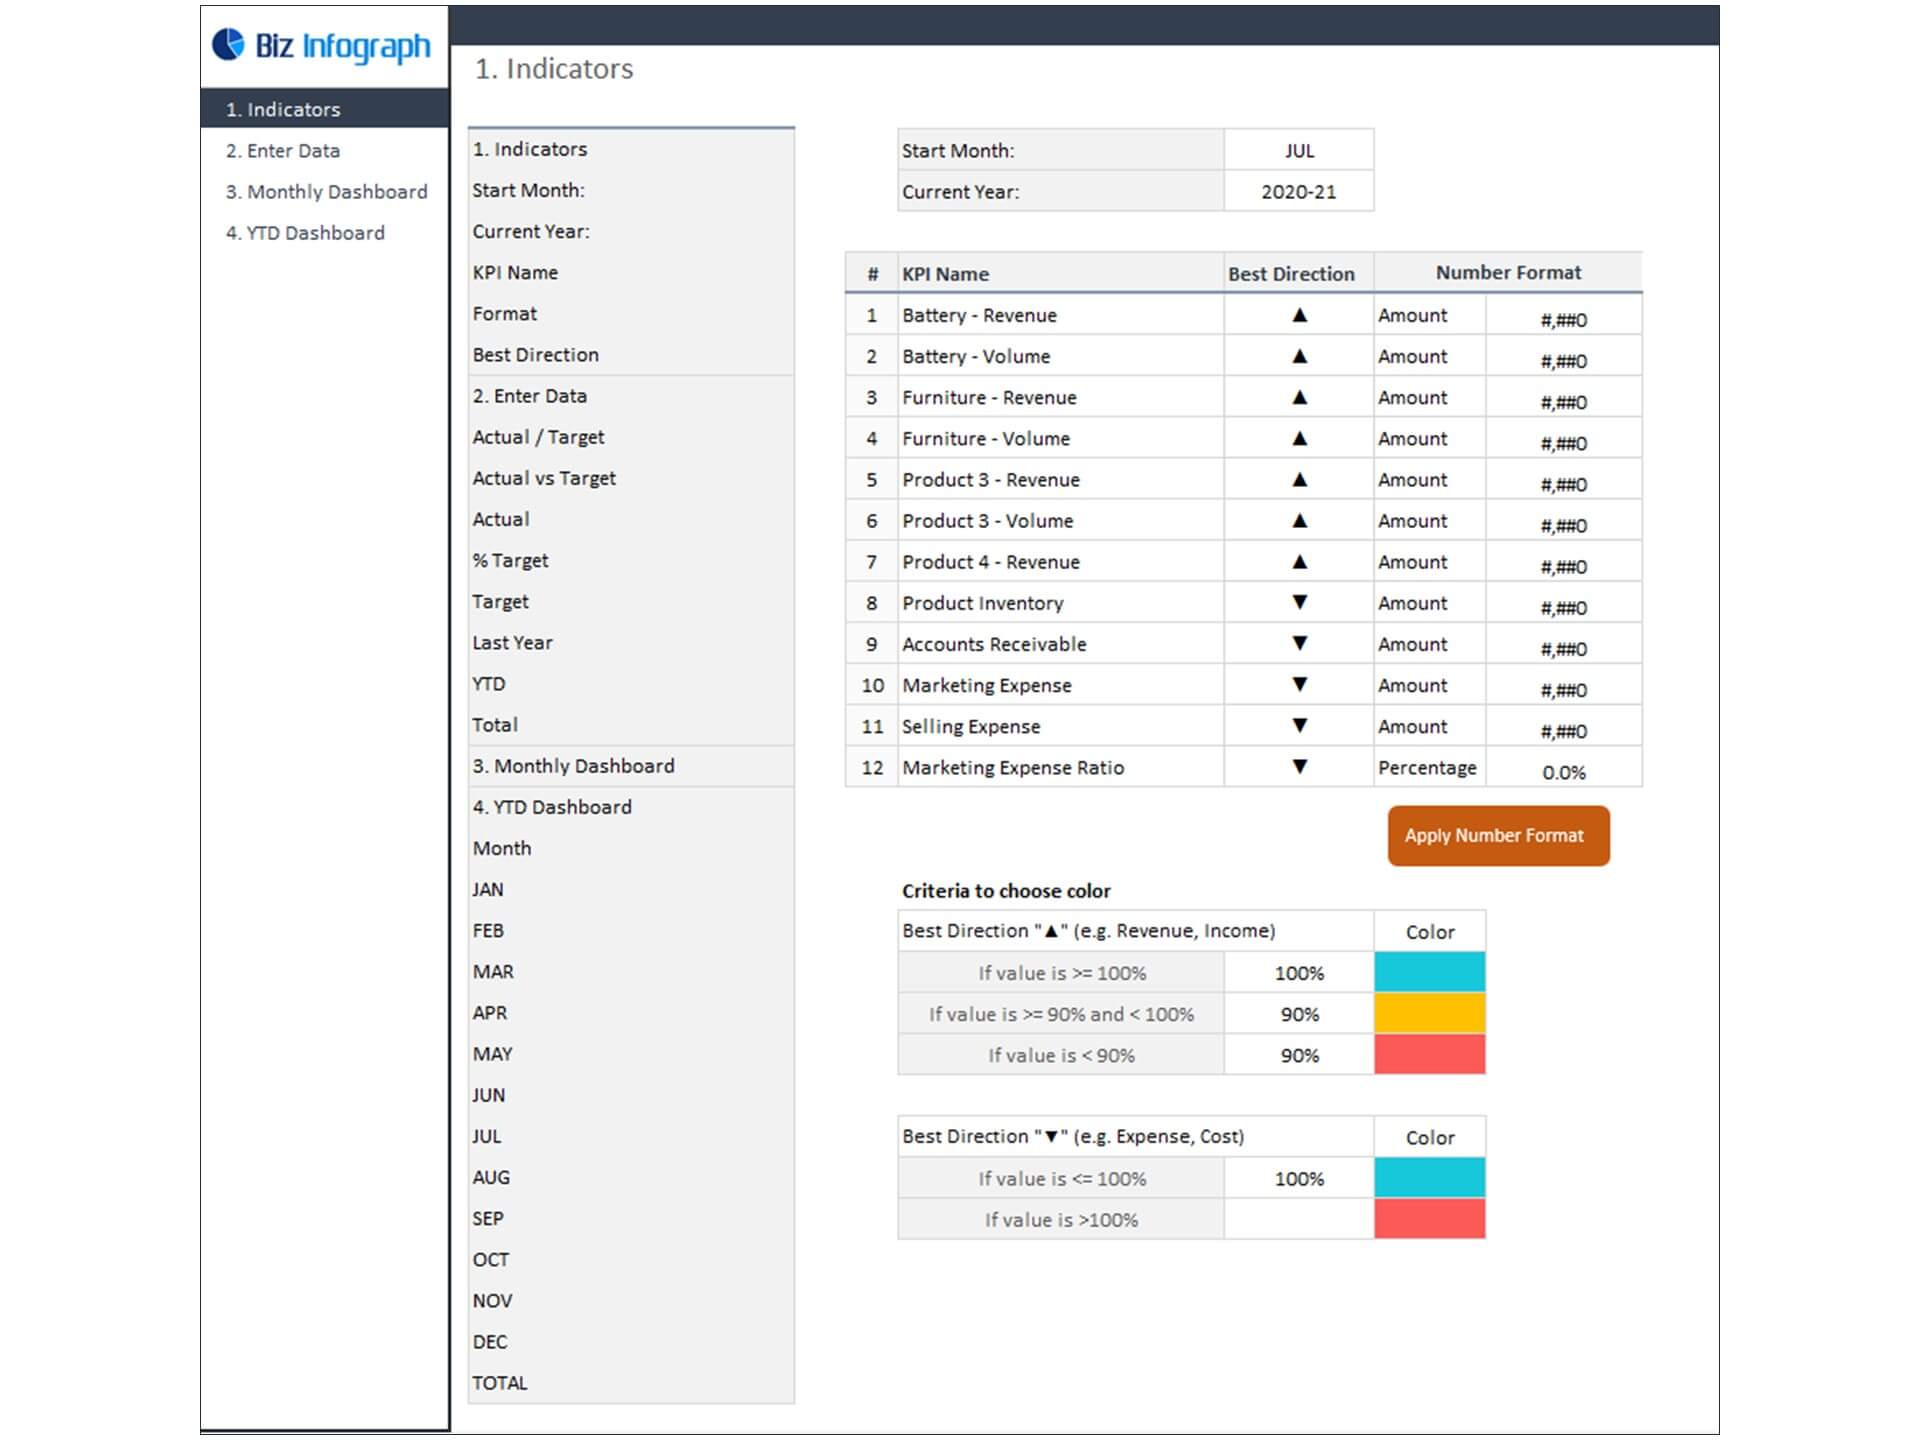
- Allows you to register up to 12 indicators
- Fully editable, easy to use, template with sample data
- Eye-catching design and customizable
- Change the sample data with your data
- Spreadsheets ready for printing without Biz Infograph logo
- Consolidate key financial performance indicators in one dashboard
- No monthly fees
- Immediate download
- No VBA, no Macro
- No installation necessary
- Professionally designed
What is included in this dashboard template?
- Just plug your data, the dashboard will be ready instantly and start using.
- A text file which contains a password to view and edit the formula
- A guide to unlocking all the elements in the dashboard
Professional Support:
- Video tutorial guide on how to navigate and use Sales KPI Dashboard Template
- Professional service to customize dashboard template in excel as per business need
- Help and support in post-purchase
- Payment secured by Stripe and PayPal (no PayPal account needed)
A brief guide to using the dashboard template:
- Open the dashboard template
- Go to ‘Indicators’ menu – choose the start month of the fiscal year (i.e. Jan, Feb, Jul, etc.)
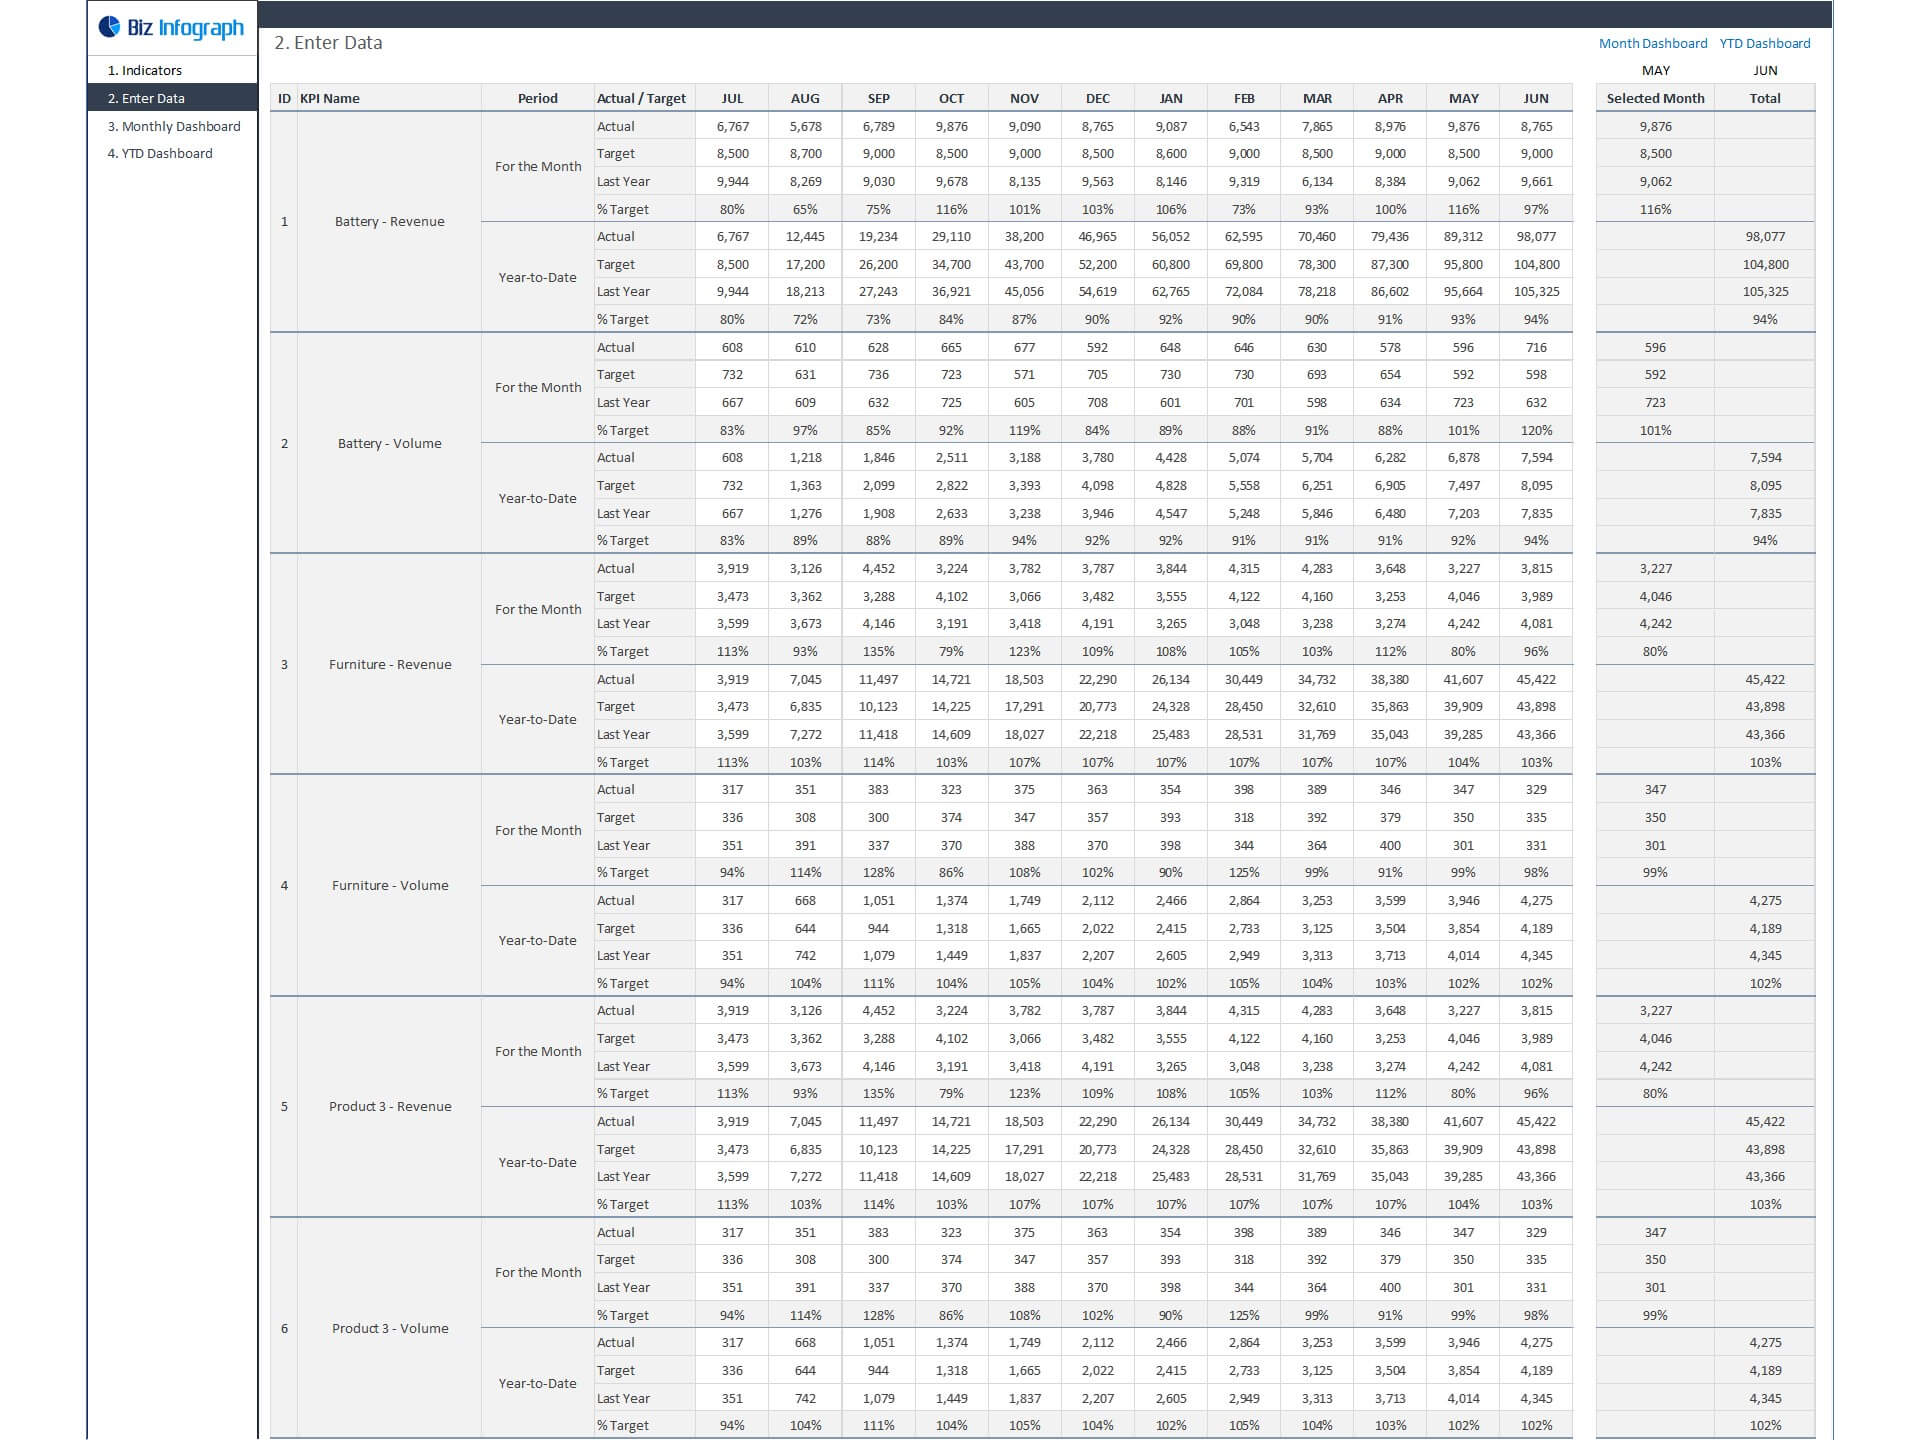
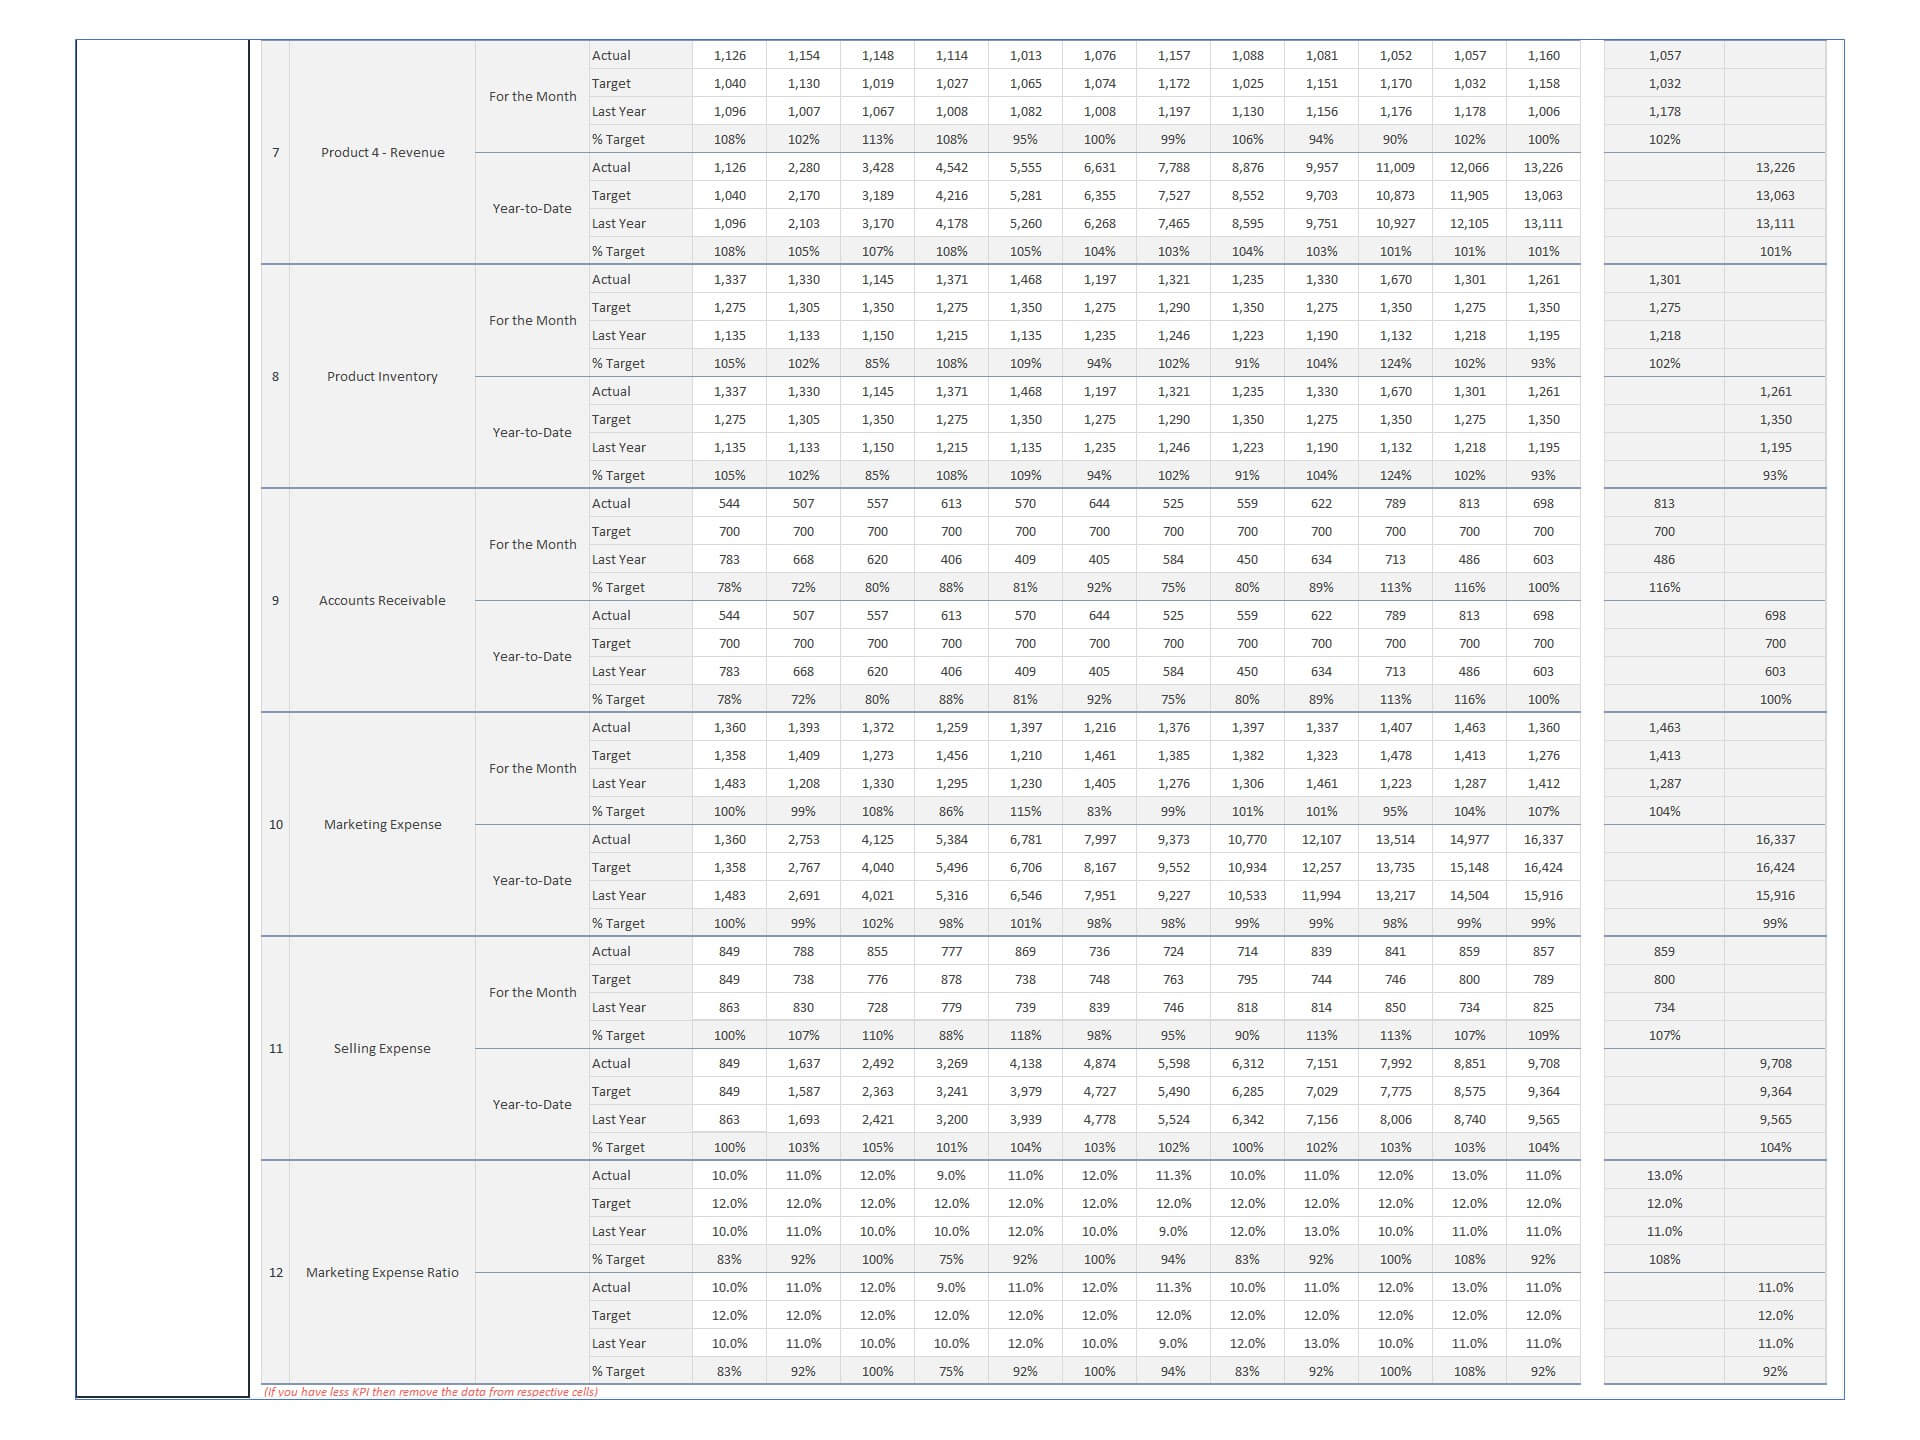
- Go to the ‘Enter Data’ menu – remove the sample data and give your actual data in the respective cells. Formula cells are locked, and you cannot edit it without a password.
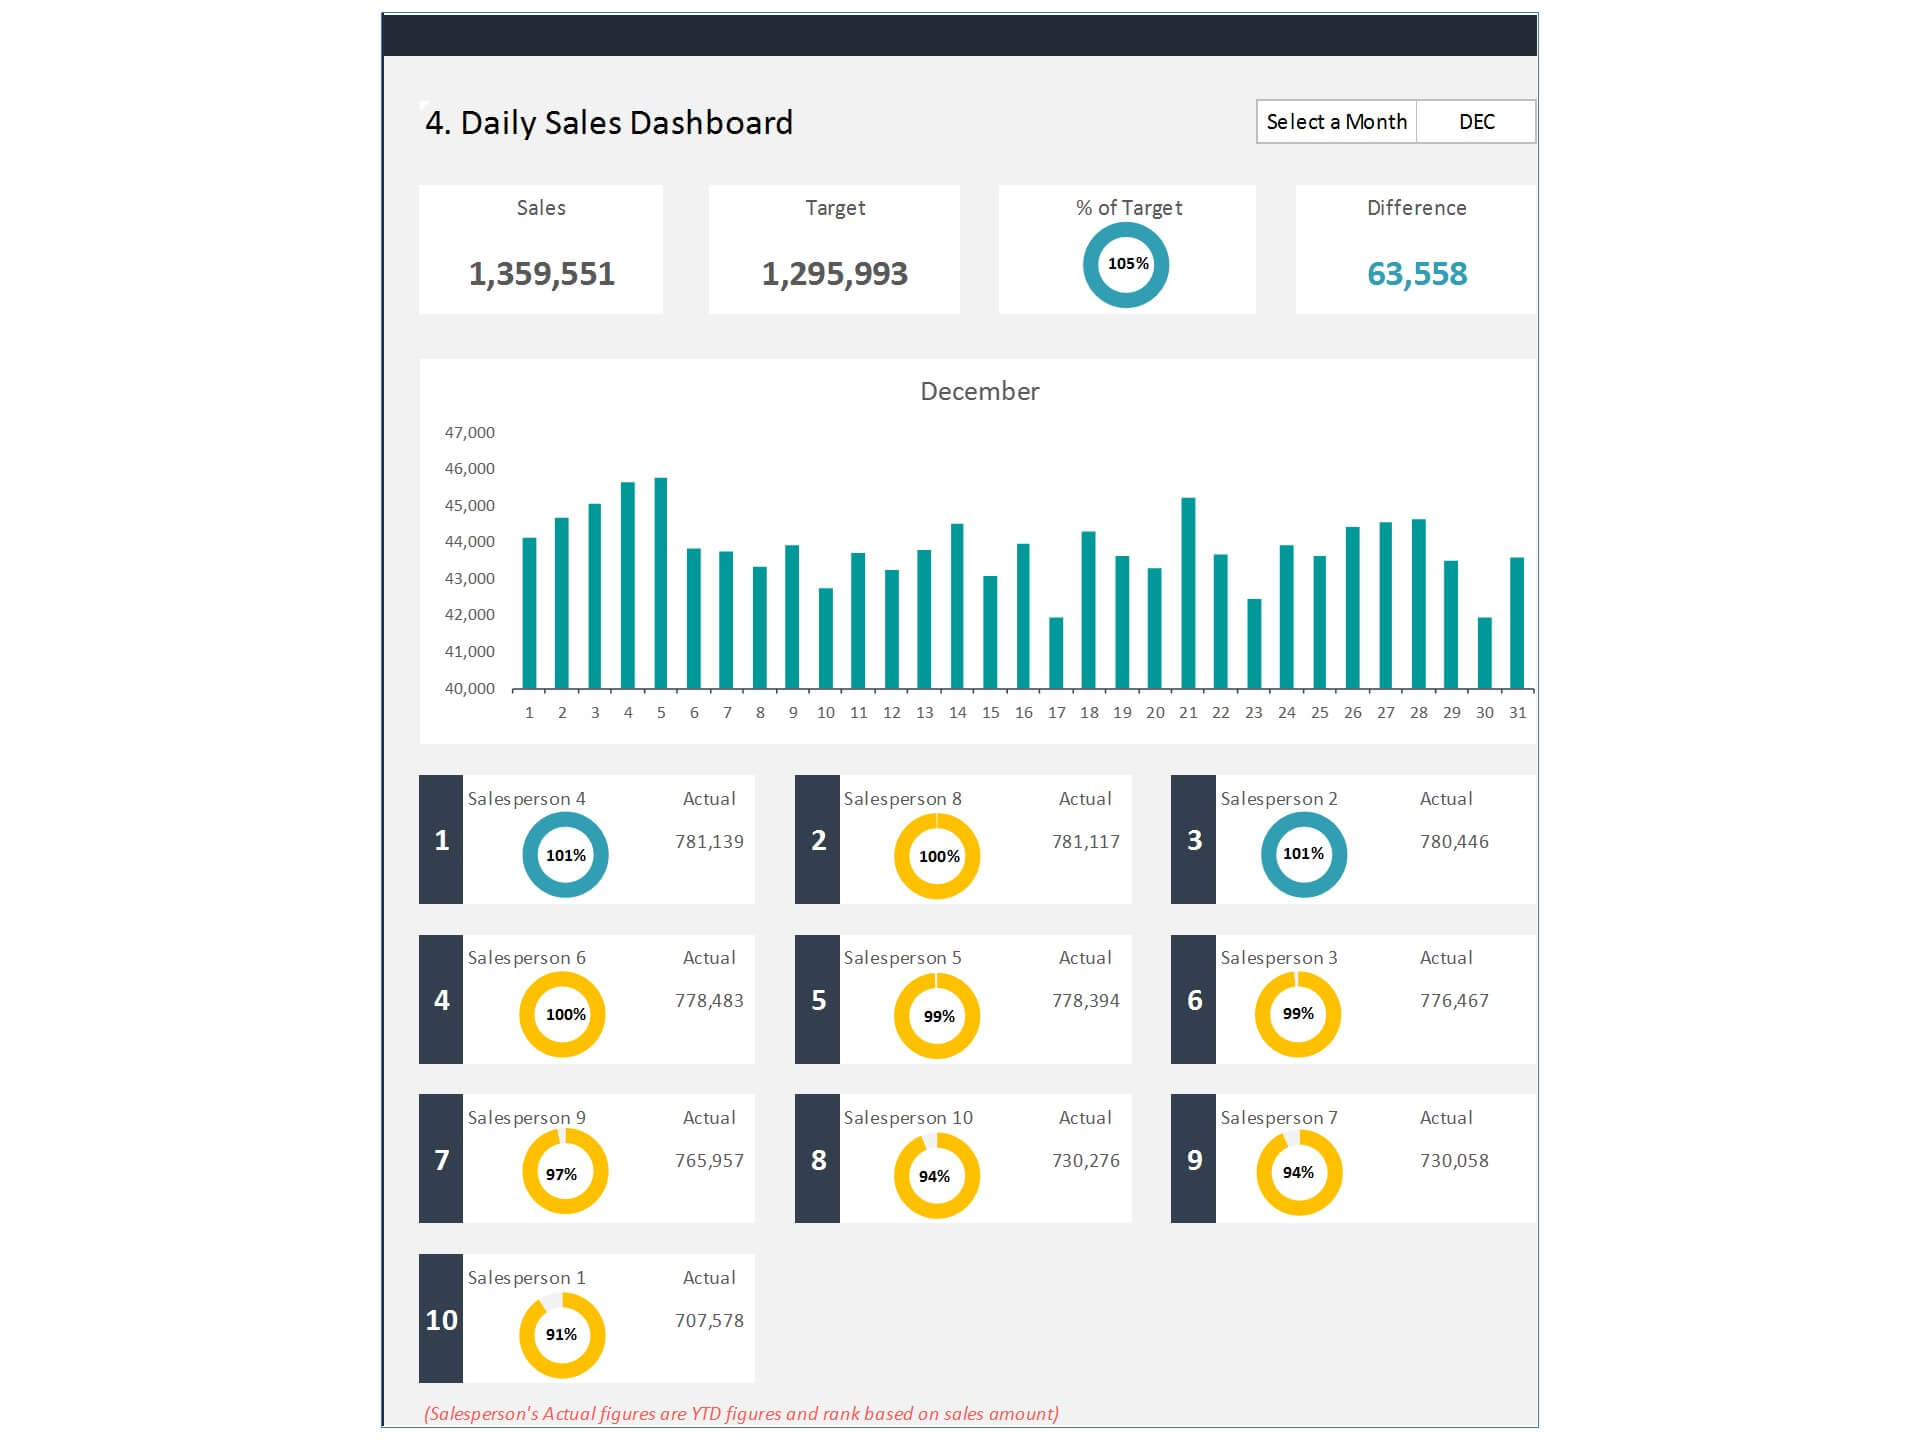
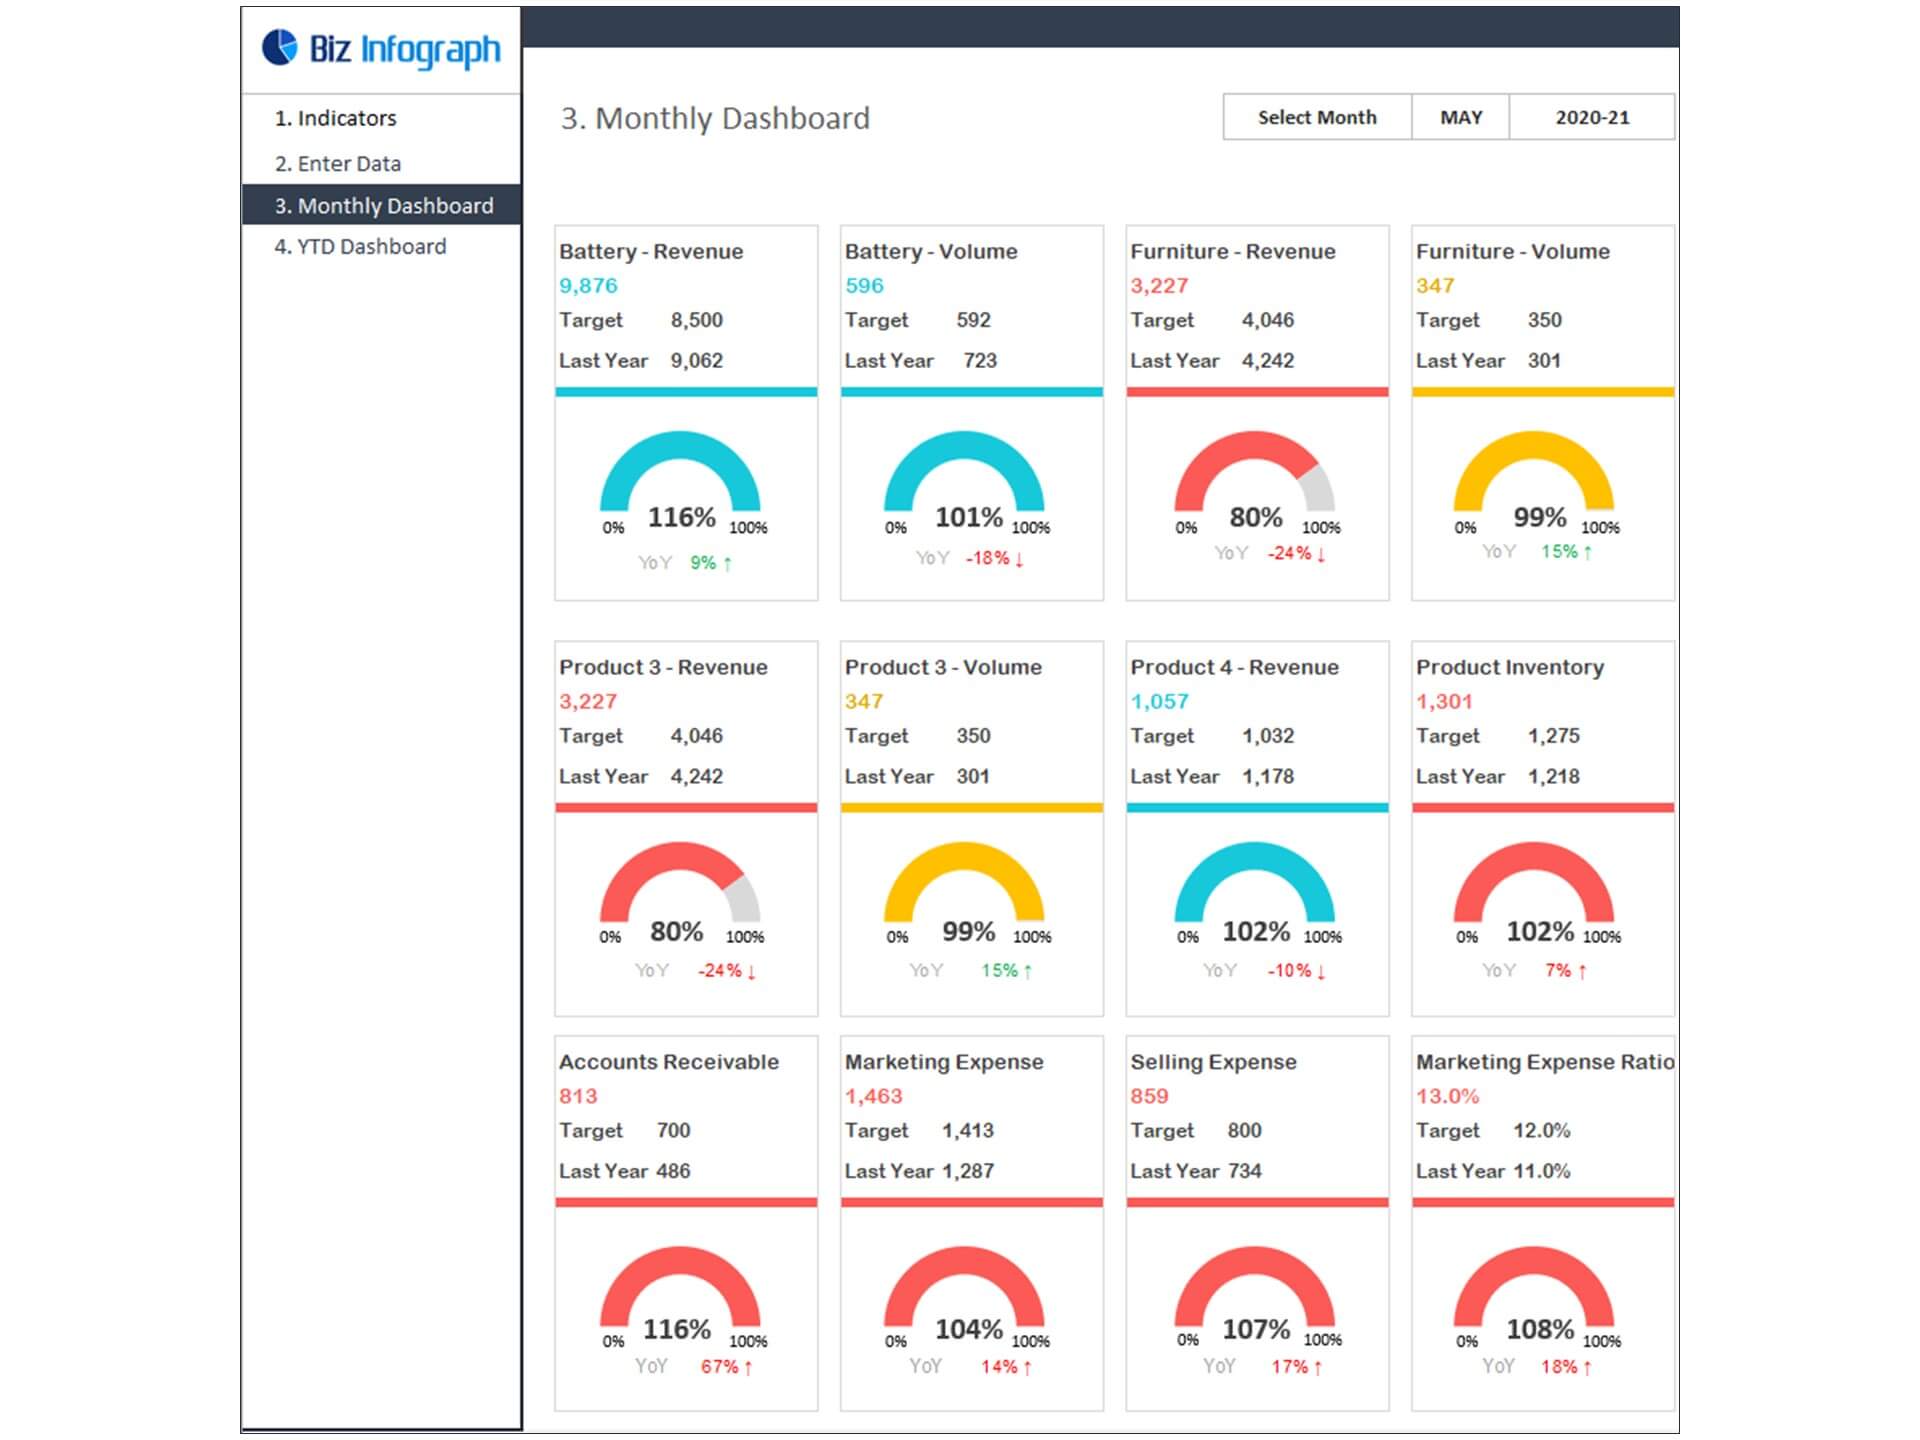
- Go to the ‘Monthly Dashboard’ menu – select the month name from the drop-down to see the monthly picture of performance indicators
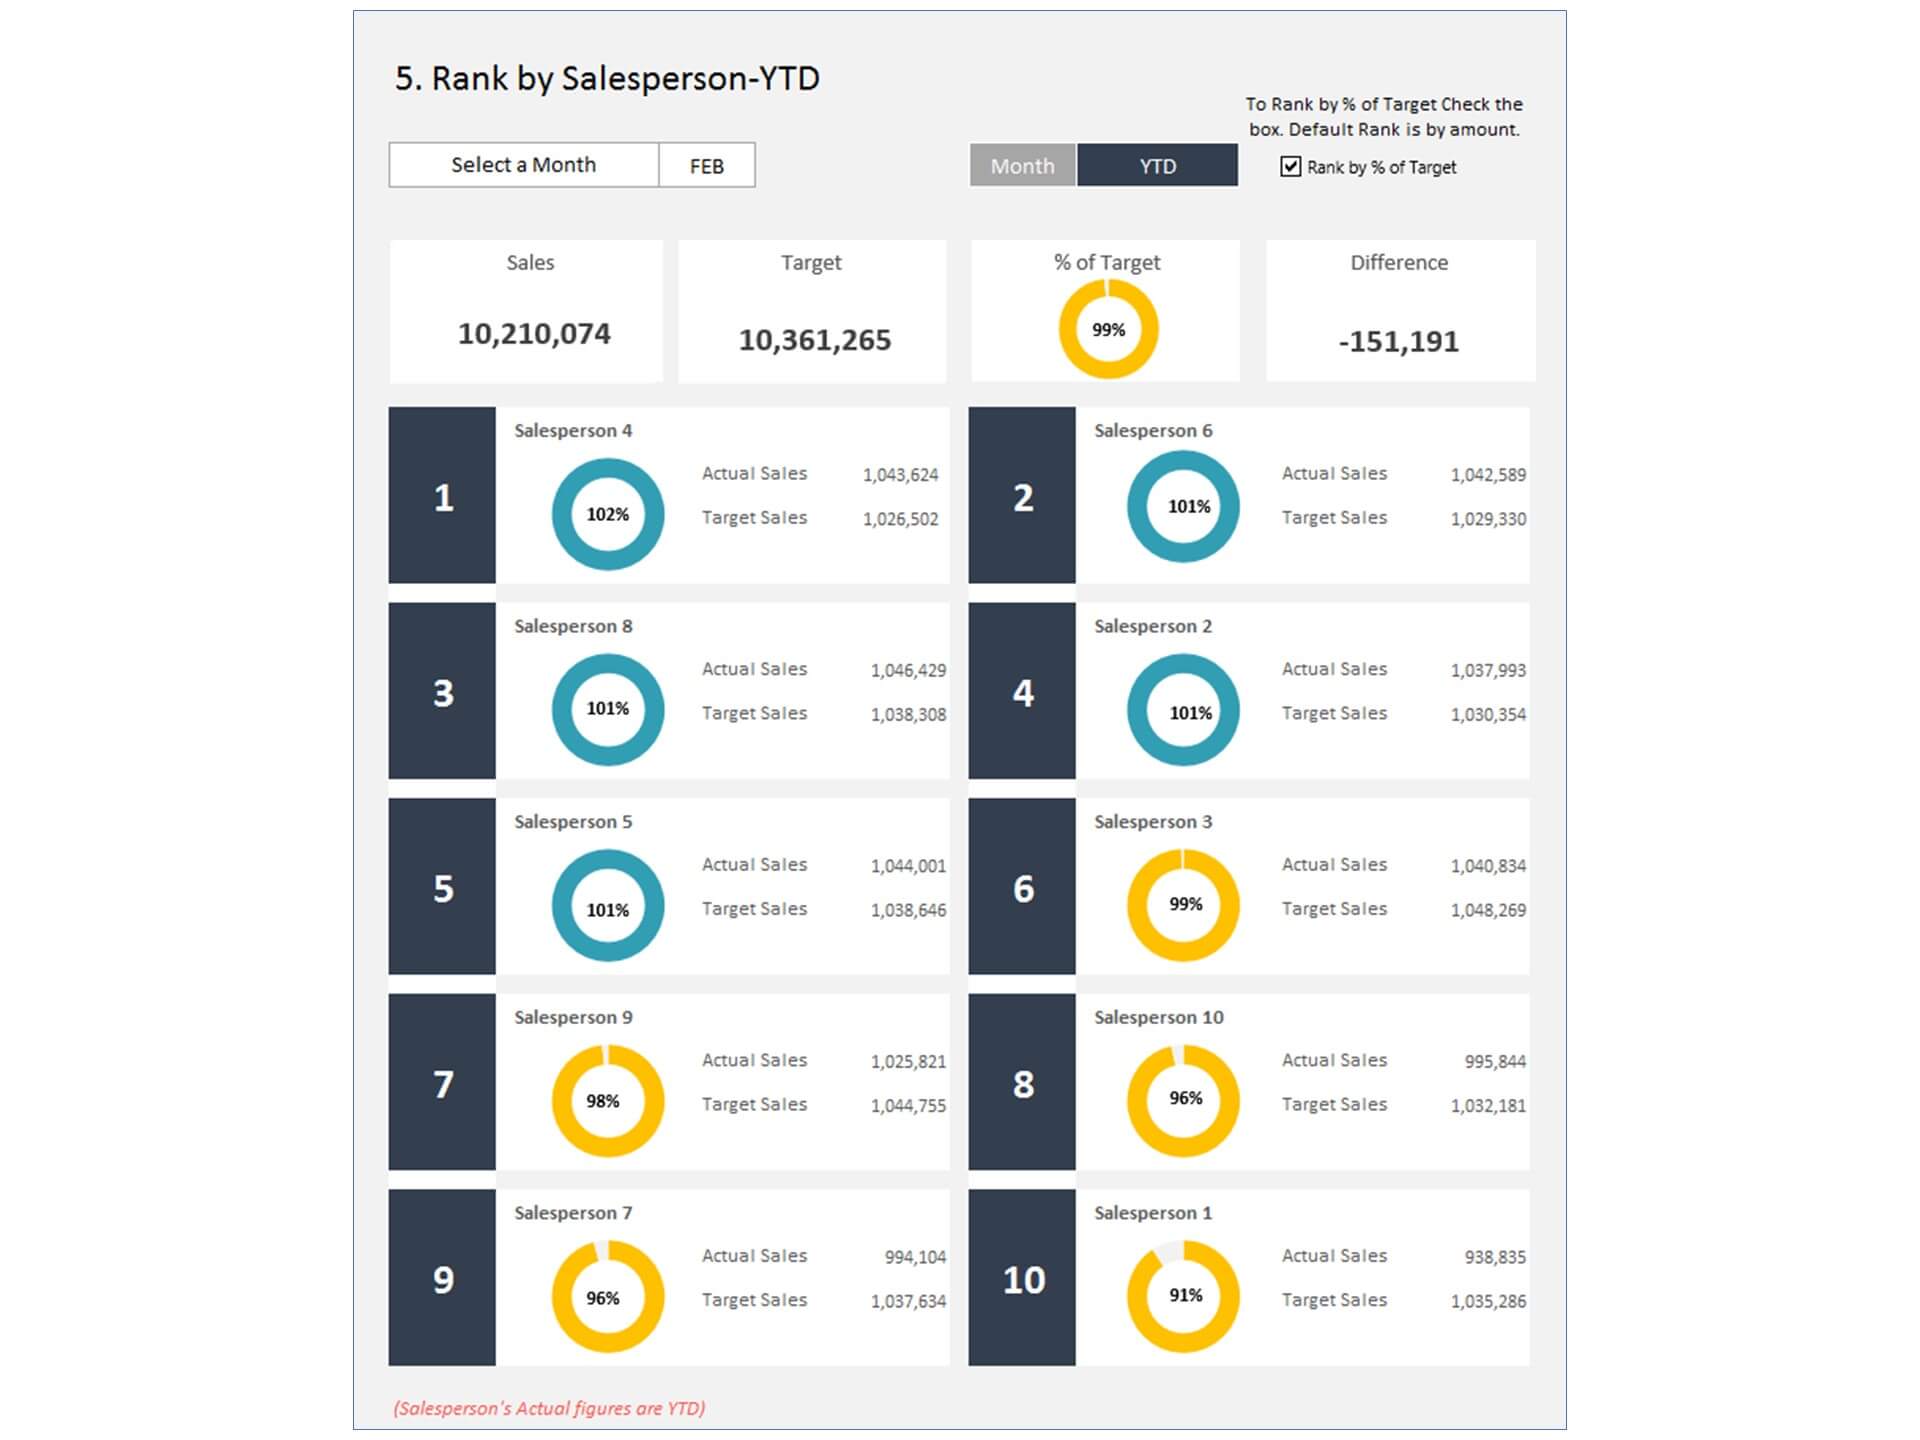
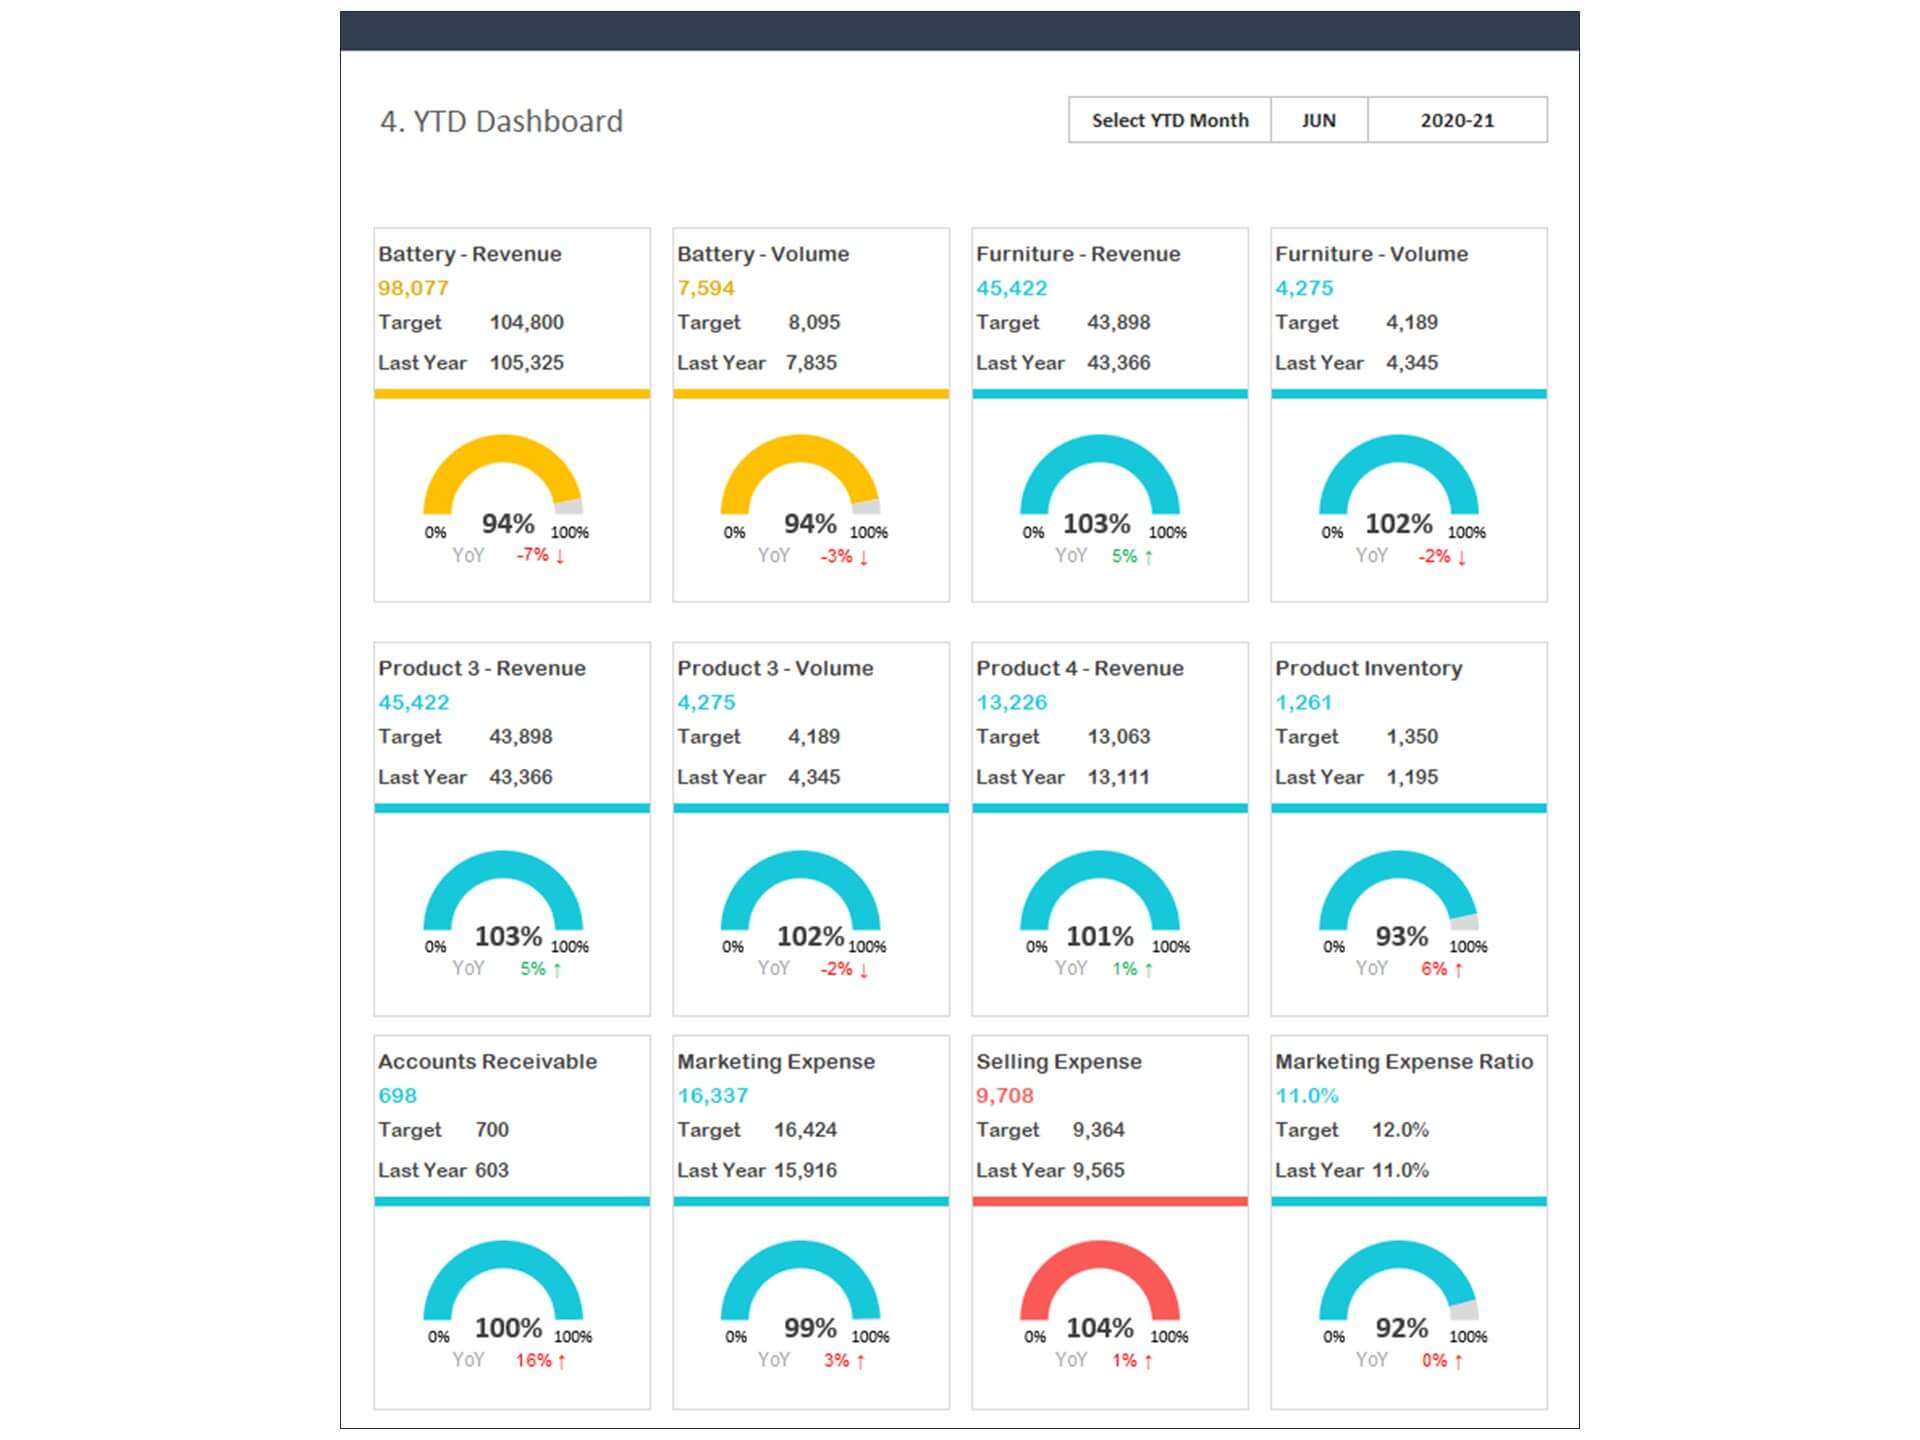
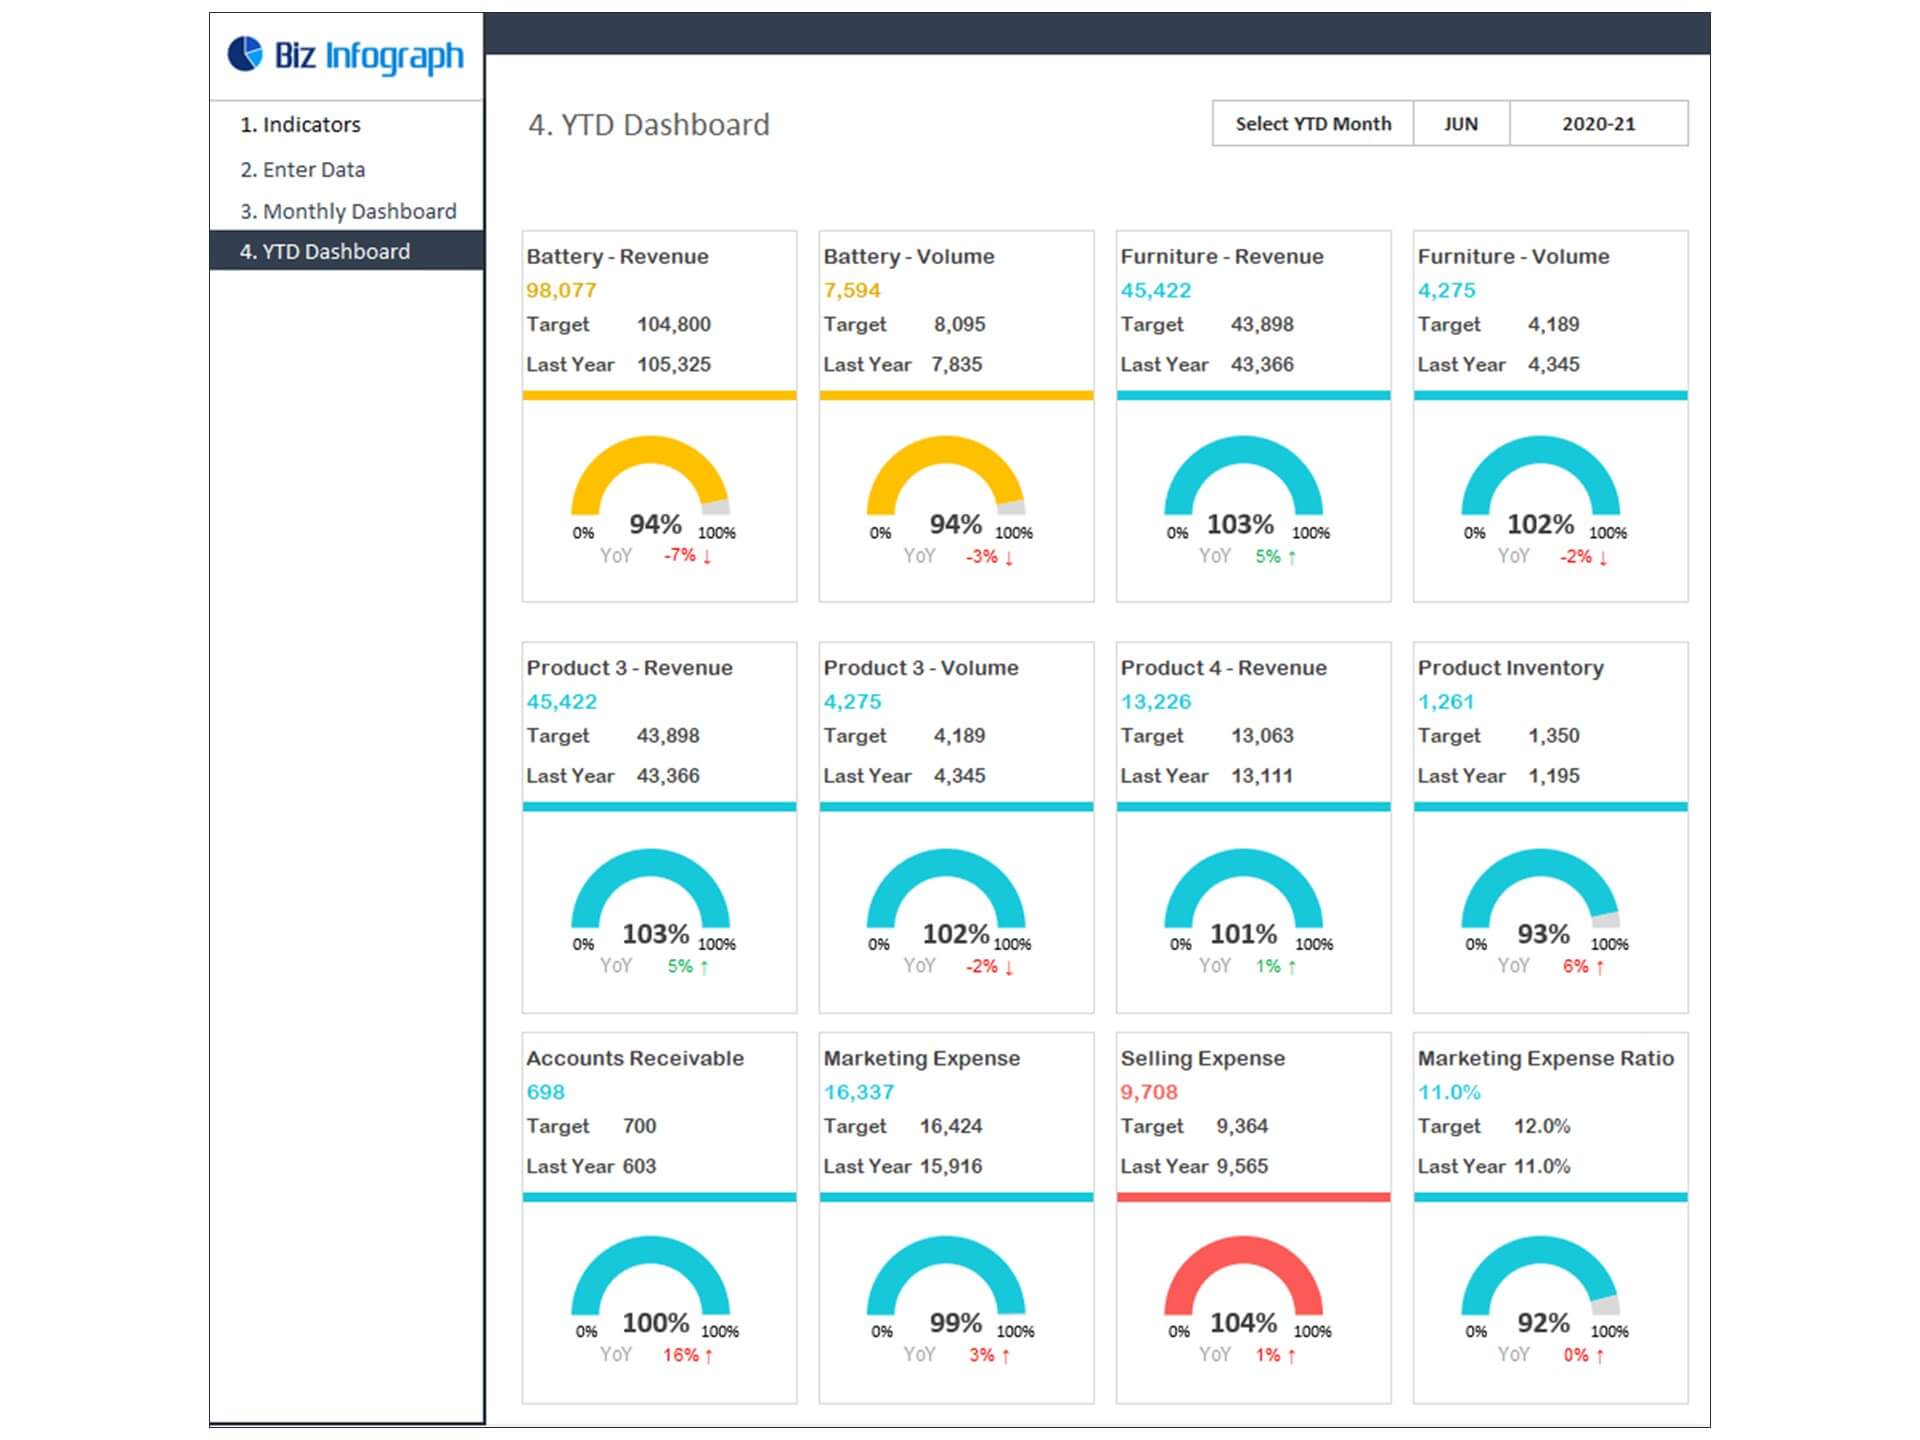
- Go to ‘YTD Dashboard’ menu - select month name from the drop-down to see the year-to-date picture of performance indicators
- Each page is ready for printing – just press CTRL+P
This Excel dashboard template is password-protected to avoid mistakes, such as accidentally deleting formulas. When you completed the purchase, the password will be available.
For ready-to-use Dashboard Templates: