Introduction to CFO Dashboard Quarterly Performance Review Power BI What Is a CFO Dashboard Quarterly Performance Review Power BI and Why It Matters A CFO Dashboard Quarterly Performance Review Power BI solution is a reporting tool that helps finance leaders review company results in a clear and structured way at the end of each quarter. […]
Blog
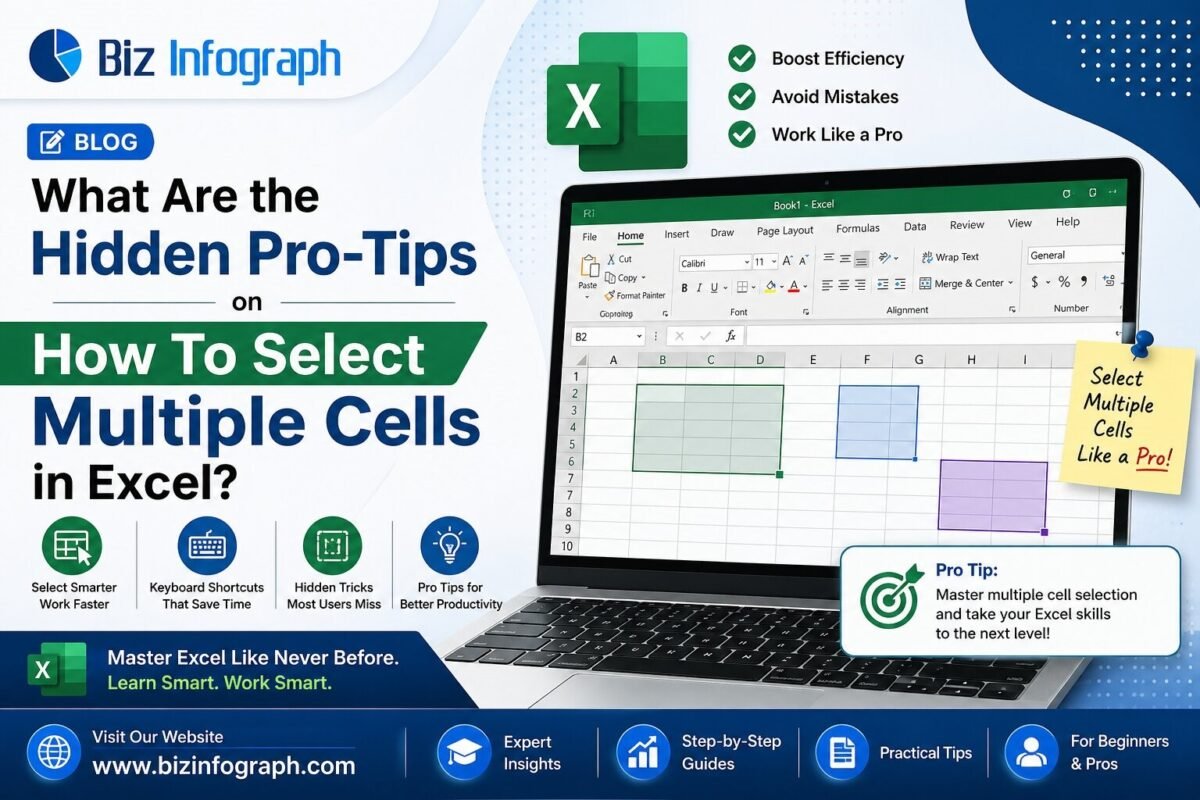
Excel can look like a giant puzzle at first. So many tiny boxes. So many numbers. So much going on. But here’s the good news. Learning how to select multiple cells in excel can make everything faster and way less annoying. It’s one of those small skills that feels basic but saves a ton of […]
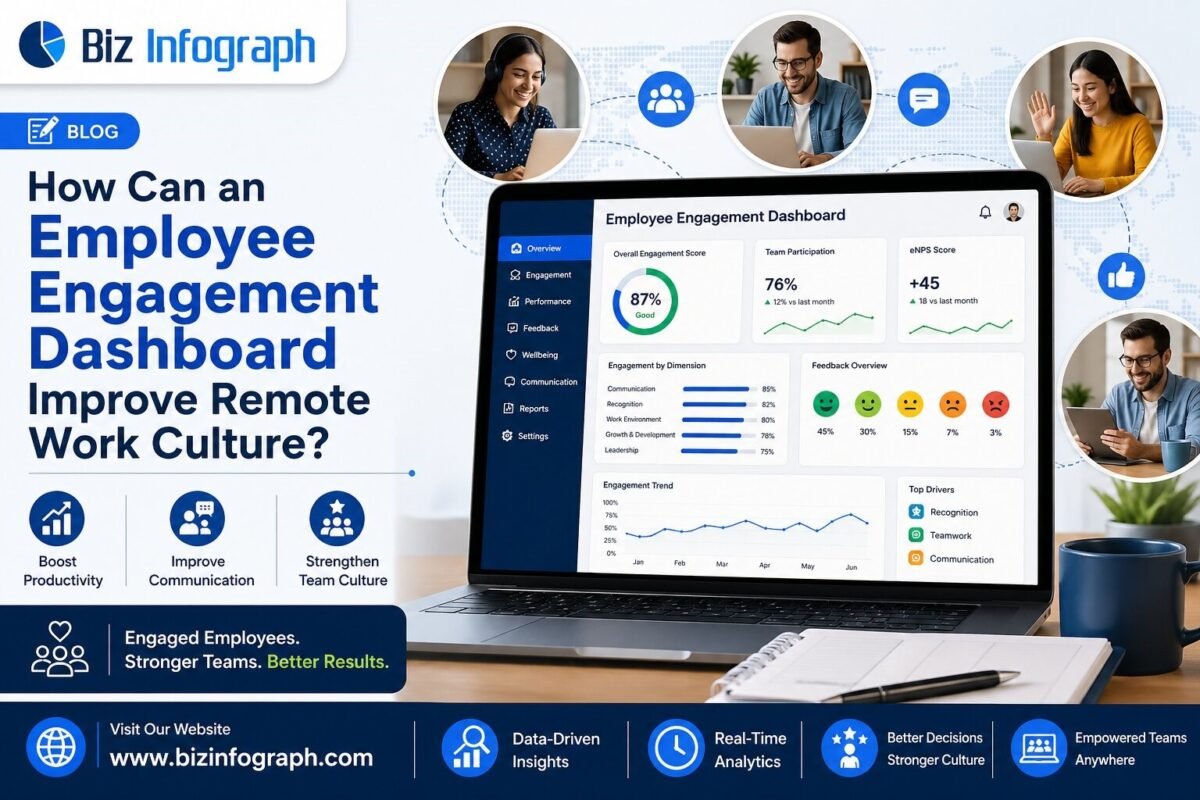
Remote work has changed the game for many businesses. People can work from home, coffee shops, or even while traveling. Sounds pretty awesome, right? But here’s the catch. Remote work can sometimes make employees feel lonely, left out, or confused. Without office chats or quick team huddles, company culture can take a hit. That is […]
Introduction to CEO Dashboard Power BI What Is a CEO Dashboard Power BI and Why It Matters A CEO Dashboard Power BI solution is a high-level reporting system designed to help senior leaders understand business performance quickly and clearly. It brings key financial, sales, people, and operational information into one place so decision-makers can focus […]
Introduction to HR Budget vs Actual Dashboard Power BI What Is an HR Budget vs Actual Dashboard Power BI and Why It Matters An HR Budget vs Actual Dashboard Power BI report is a visual tool that compares planned HR spending with real workforce costs in one place. It helps the human resources department understand […]
Introduction to HR Termination Dashboard Power BI What Is an HR Termination Dashboard Power BI and Why It Matters An HR termination dashboard Power BI solution is a reporting tool designed to help organizations monitor employee exits, turnover patterns, and workforce changes in one visual view. Instead of reviewing separate spreadsheets and manual summaries, HR […]
Introduction to Payroll Dashboard Power BI What Is a Payroll Dashboard Power BI and Why It Matters A Payroll Dashboard Power BI solution is a visual reporting tool that helps organizations review payroll activity, employee compensation, and workforce costs in one place. Instead of checking multiple spreadsheets and payroll files, users can rely on one […]
Introduction to HR Headcount Dashboard Power BI What Is an HR Headcount Dashboard Power BI and Why It Matters An HR Headcount Dashboard Power BI solution is a reporting system that helps organizations monitor workforce size, employee movement, and staffing structure in one visual environment. A strong hr headcount dashboard turns people data into meaningful […]
Introduction to HR Analytics Dashboard Power BI What Is an HR Analytics Dashboard Power BI and Why It Matters An HR Analytics Dashboard Power BI is a reporting solution that helps organizations monitor workforce trends, employee changes, and operational performance in one place. A strong power bi HR dashboard turns raw data into clear visuals […]
Introduction to Sales Team Dashboard Power BI What Is a Sales Team Dashboard Power BI and Why It Matters A Sales Team Dashboard Power BI is a visual reporting solution that helps businesses monitor team results, pipeline progress, and customer trends in one place. Instead of reviewing scattered spreadsheets and static files, teams can use […]