In today’s fast-paced digital age, managing data efficiently is essential for productivity and organization. If you frequently work with large datasets in Microsoft Excel, you may find yourself overwhelmed by the sheer volume of information. That’s where the ability to collapse rows in Excel proves invaluable.
In this section, we will explore various Excel hacks and techniques to collapse rows in Excel. We will guide you step-by-step on how to use this feature effectively for better data management and a cleaner workspace. By learning these Excel hacks, you will be able to streamline your spreadsheets and improve your Excel skills.
Key Takeaways:
- Collapsing rows in Excel improves data visibility and provides easier navigation.
- Collapsing rows enhances the organization of spreadsheet data.
- Knowing how to collapse rows in Excel streamlines your spreadsheet workflow.
- There are multiple methods to collapse rows in Excel, such as grouping rows, using Excel’s outline feature, and data grouping.
- Tips and tricks like nesting row groups and customizing grouping levels can help you achieve the desired level of detail in collapsed rows.
Why Row Collapse Matters in Excel
In Excel, the ability to collapse rows is a powerful feature that shouldn’t be overlooked. It offers several important benefits that can greatly enhance your data management experience. By collapsing rows, you can improve data visibility, simplify navigation, and achieve better organization of your spreadsheet data.
One of the key benefits of collapsing rows is improved data visibility. By collapsing rows that contain detailed information or secondary data, you can focus on the main points or key metrics. This helps to declutter your spreadsheet and allows you to quickly access the information that matters most.
Another advantage of collapsing rows is the enhanced organization it brings to your spreadsheet. By grouping related rows and collapsing them, you can create a more structured layout that is easier to digest and analyze. This can be especially helpful when presenting data to others or when conducting data-driven analyses.
Understanding the importance of collapsing rows in Excel will help you make the most out of this feature and optimize your spreadsheet workflow. Now that we’ve explored the significance of collapsing rows, let’s move on to the different methods and techniques to collapse rows in Excel.
What Are Collapsible Rows?
In Excel, collapsible rows refer to a feature that allows users to hide and show specific groups of rows. This functionality is particularly useful when working with large datasets, as it enables users to reduce clutter and focus on the relevant information. Collapsing rows helps create a cleaner workspace and improves data management in Excel.
Supported Excel Versions
The row collapse feature in Excel is supported in various versions of the software. Users can take advantage of this functionality in Excel versions including:
- Excel 2013
- Excel 2016slide
- Excel 2019
- Excel for Microsoft 365 (formerly Office 365)
By ensuring compatibility with Excel versions that support the row collapse feature, users can confidently utilize this functionality to enhance their data organization and analysis.
Quick Navigation
In Excel, the ability to quickly navigate through rows and collapse them is essential for efficient data management. In this section, we will explore two quick navigation options: keyboard shortcuts and ribbon menu options.
3.1 Keyboard Shortcuts
Keyboard shortcuts provide a convenient and time-saving way to collapse rows without using the mouse. Here are a few keyboard shortcuts you can use:
Ctrl + 8: Collapse or expand the current selection’s outline.
Alt + Shift + Left Arrow: Collapse the group or outline level above the current selection.
Alt + Shift + Right Arrow: Expand the group or outline level above the current selection.
These shortcuts allow you to quickly collapse and expand rows, making it easier to navigate through large datasets and focus on specific sections of your spreadsheet.
3.2 Ribbon Menu Options
Excel also provides ribbon menu options for easy access to the row collapse feature. To find these options do follow these steps:
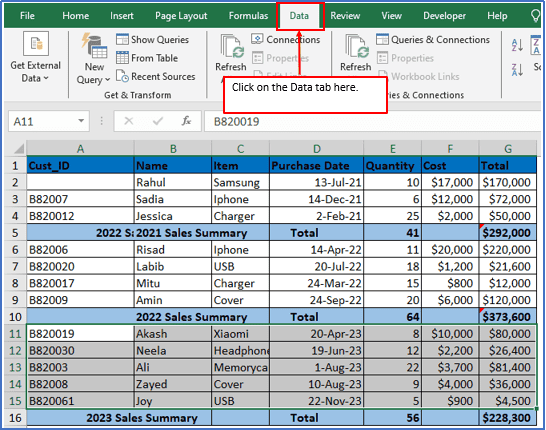
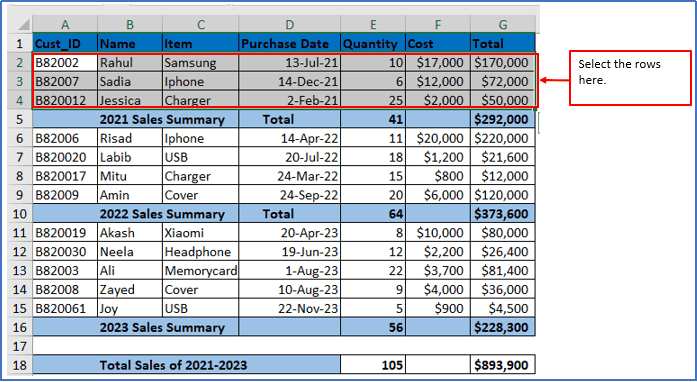
Step 1: First, select the rows which you want to collapse then navigate to the “Data” tab in the Excel ribbon menu.
Step 2: Look for the “Outline” or “Group” section. Click on the “Group” drop-down option from the context menu. After that, you will get a Group option again and select that.
Selected the group option here.

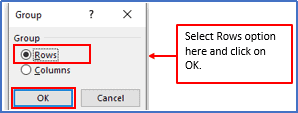
Step 3: After selecting the group option, you will get a dialogue box that you want grouping the rows or columns. As you are working with grouping rows, you need to select the Rows and click OK.
Here select the Rows option.
Step 4: After clicking on OK, you will find buttons or icons to collapse and expand rows.
Here is the Collapse buttons outlined below.
Step 5: The selected rows has collapsed in the below image. You can see also the expand button shows. Click on the plus “+” sign to expand the rows.
By utilizing the ribbon menu options, you can quickly collapse and expand rows with just a few clicks, enhancing your overall Excel experience.
The Step-by-Step Guide to Collapse Rows in Excel
In this section, we will provide a comprehensive step-by-step guide on how to collapse rows in Excel using different methods. By following these instructions, you will be able to effectively organize and manage your spreadsheet data.
4.1 Method 1: Grouping Rows
The first method we will explain is grouping rows. This feature allows you to collapse and expand specific groups of rows, providing a more streamlined view of your data.
To group rows in Excel, follow these steps:
Step 1: Select the rows that you want to collapse.
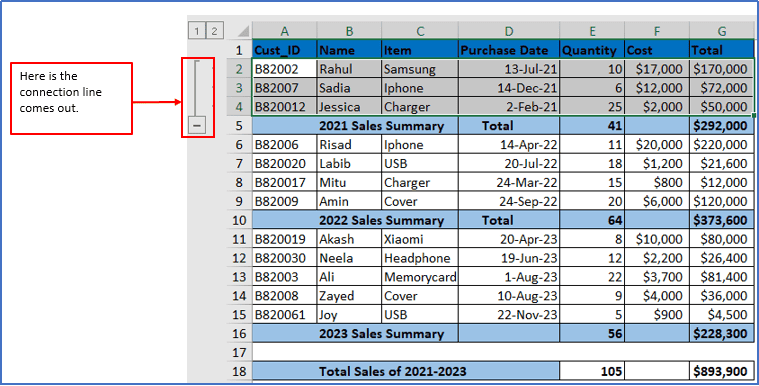
You can see below 2021 sales summary rows are selected here, excluding sub-total.
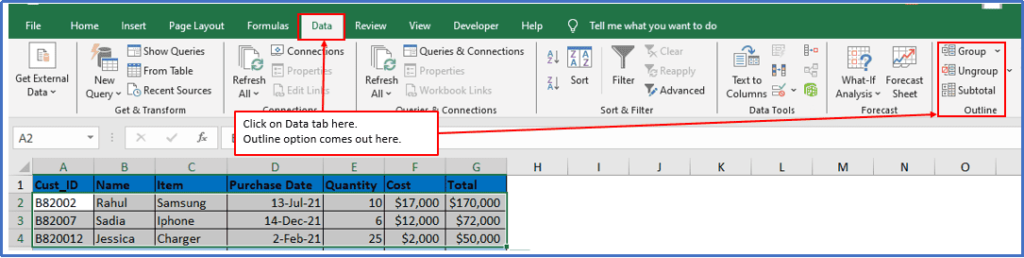
Step 2: Now, Click on the Data tab and you will get an Outline option there.
Here is the Outline option that appeared.
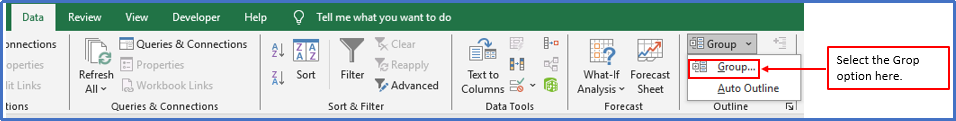
Step 3: Click on the “Group” drop-down option from the context menu. After that, you will get a Group option again and select that.
Selected the group option here.
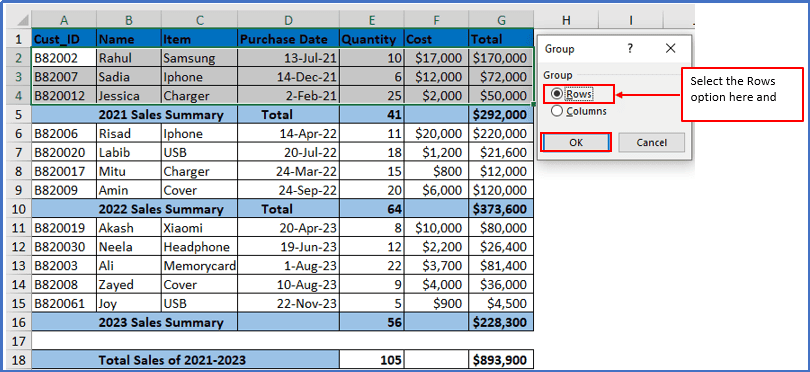
Step 4: The question may arise when you inquire about grouping the rows or columns.
As you are working with grouping rows, you need to select the Rows and click OK.
Here selected the Rows option.
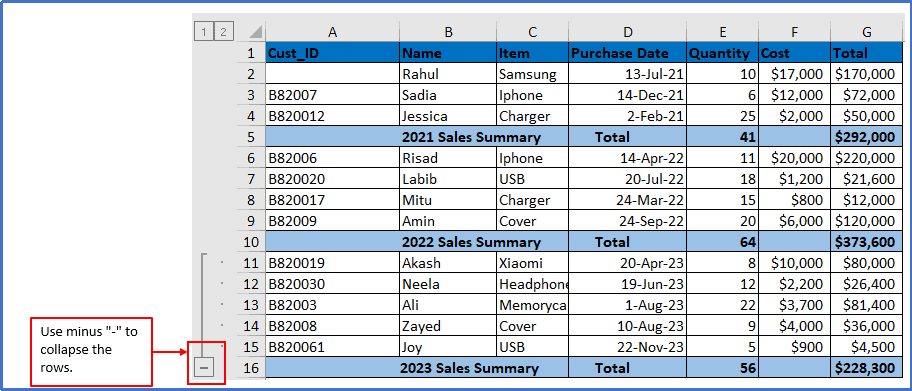
Step 5: As soon as you click OK, a connection line will appear on the left.
Here is the Joint line.
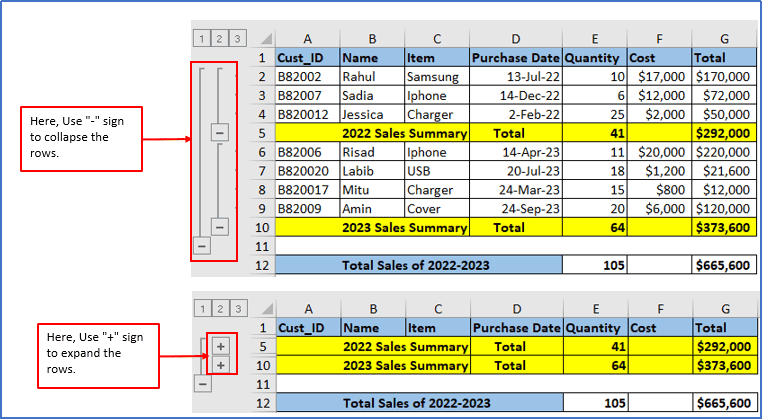
Step 6: Next, you need to click on the minus”-“ sign to confirm the collapse rows.
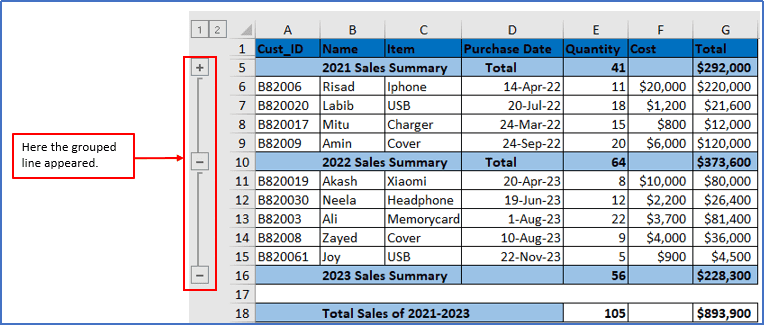
After clicking on the minus “-“ sign your selected rows will be collapsed like this.
The grouped rows will collapse, and you can click the expand button to reveal the hidden rows again.
Step 7: In the same way from Step 1-Step 4, select the 2022 sales summary rows first again and follow the above option to get the result, after that follow the same steps for the 2023 sales summary.
Here used the above shown formula and the results are grouped into it.
Step 8: Now, use minus sign for Collapsing rows.
Minus “-“ sign has been used here.
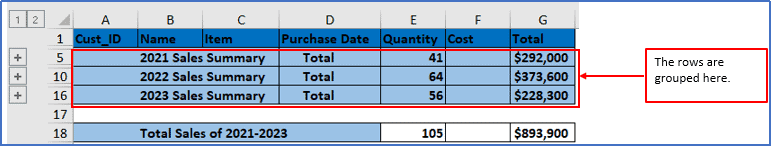
Step 9: Use the plus “+” sign for expanding rows.
Plus “+“sign has been used here.
Using this method, you can easily collapse and expand rows based on your needs, making it simpler to navigate through large datasets.
Method 2: Using Excel’s Outline Feature
Excel’s Outline feature is another powerful tool for collapsing and expanding rows. It allows you to create an outline structure in your worksheet, making it easier to manage and analyze data.
To use Excel’s Outline feature, follow these steps:
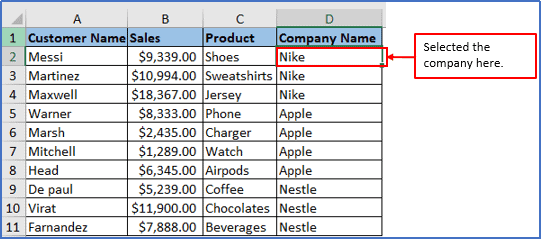
Step 1: First, sort the information in the “Company” column.
Selected the company below.
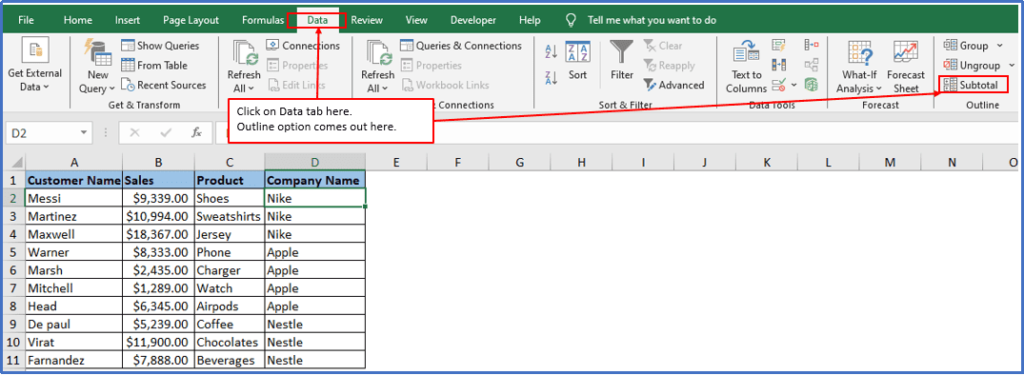
Step 2: Go to the Data tab and in the Outline group, click on Subtotals drop-down option.
Here is the Outline option that appeared.
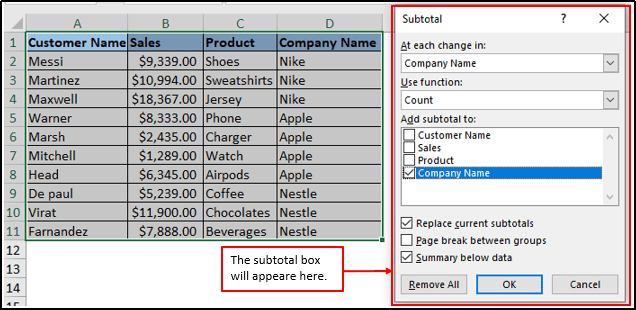
Step 3: After clicking on the subtotal option, a box will appear like the box.
Here is the subtotal box.
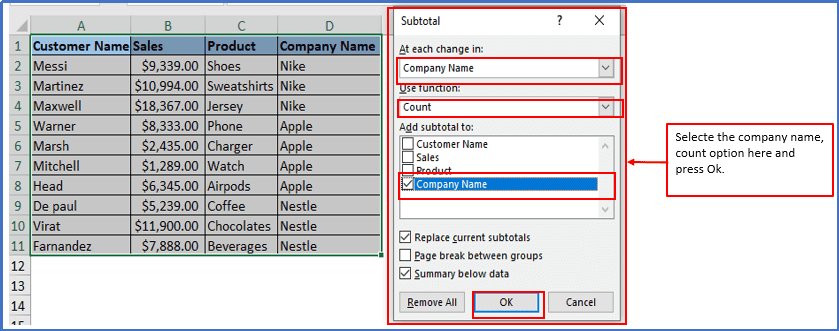
Step 4: Select the Company column, which is the column you will use to structure the worksheet.
Use the count function in the subtotal box. Select the Company checkbox. Click OK.
Step 5: After clicking OK you will get the output.
Here is the result below.
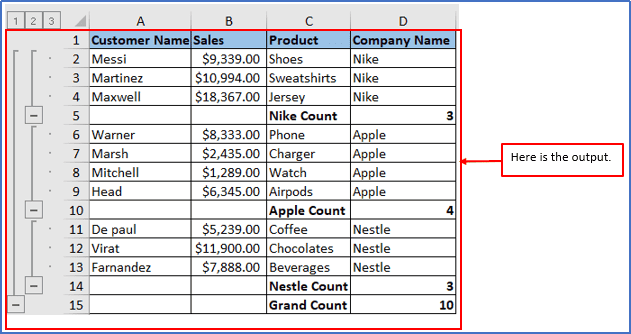
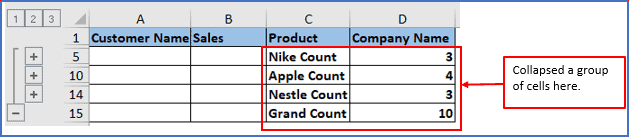
Step 6: Click the minus sign to collapse a group of cells.
Collapsed a group of cells here.
You can use numbers to collapse or expand groups by level. This method provides a more structured approach to collapsing rows and offers additional flexibility in organizing your spreadsheet data.
Method 3: Data Grouping
Data Grouping is a versatile feature in Excel that allows you to collapse and expand rows based on specific criteria or data values. It provides a dynamic way to manage and analyze your dataset.
To use Data Grouping for collapsing rows, follow these steps:
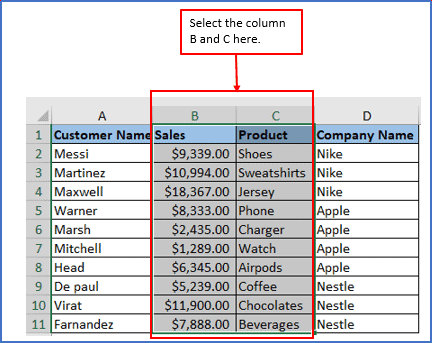
Step 1: Select the range of cells that you want to apply Data Grouping to.
Here Sorted the columns by their respective names, select columns B, and C.
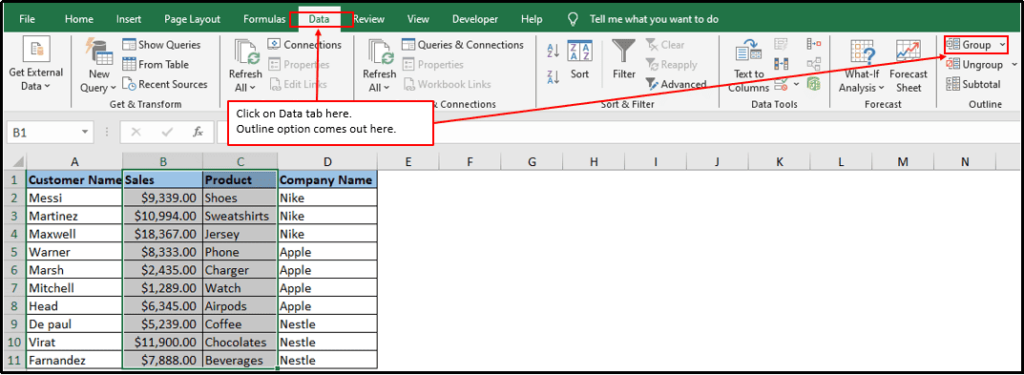
Step 2: Go to the “Data” tab in the Excel ribbon menu. Click on the “Group” drop-down button in the “Outline” group.
Selected the Group button here.
Step 3: After clicking on the group drop-down box, you will get another group option click on that.
Here is another Group option.

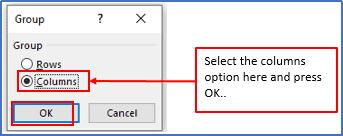
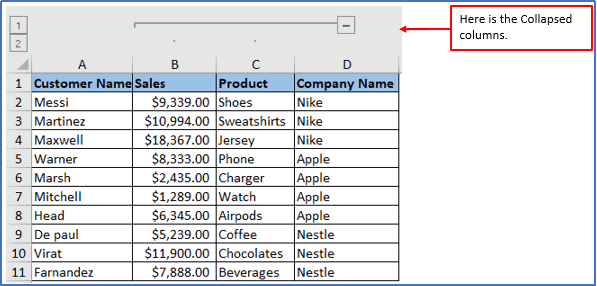
Step 4: After Choosing the appropriate grouping options in the dialog box. Then selecte columns option there.
Step 5: The columns will be collapsed based on the chosen grouping criteria.
Here is the result.
Step 6: If you use the minus sign the the collapse columns will be hidden.
Here is the result after using the minus sign.
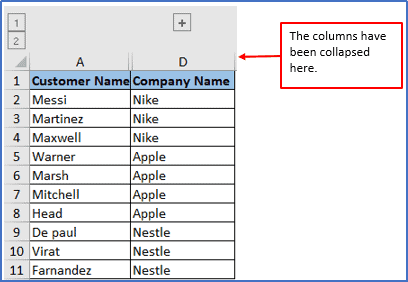
If you use the plus “+” sign the collapse columns will be expand. Data Grouping offers a more advanced way to collapse rows in Excel, allowing you to organize and analyze your data based on specific parameters.
Tips and Tricks to Collapse Rows in Excel
In this section, we will share practical tips and tricks for effectively collapsing rows in Excel. Whether you’re working with large datasets or simply looking to organize your spreadsheet more efficiently, these tips will help you make the most out of the row collapse feature in Excel.
5.1 Nesting Row Groups
One powerful technique for collapsing rows in Excel is nesting row groups. This allows you to create hierarchies of collapsed rows, making it easier to view and analyze data at different levels of detail. To nest row groups, simply select the rows you want to group, right-click, and choose “Group” from the context menu. Repeat this process to create nested groups, refining the level of detail in your collapsed rows.
By nesting row groups, you can create a structured view of your data, collapsing and expanding rows as needed for a clearer and more organized spreadsheet.
5.2 Customizing Grouping Levels
Customizing grouping levels in Excel allows you to control the level of detail in your collapsed rows. By adjusting these levels, you can choose the granularity of information that is displayed or hidden when rows are collapsed. To customize grouping levels, select the grouped rows, right-click, and select “Group” from the context menu. From there, you can choose “Ungroup” to expand the rows or modify the grouping levels to achieve the desired level of detail.
Common Use Cases
In addition to improving data management and organization, collapsing rows, in Excel has numerous practical applications across different industries and functions. Let’s explore three common use cases where row collapse can greatly enhance efficiency and analysis:
6.1 Financial Reports
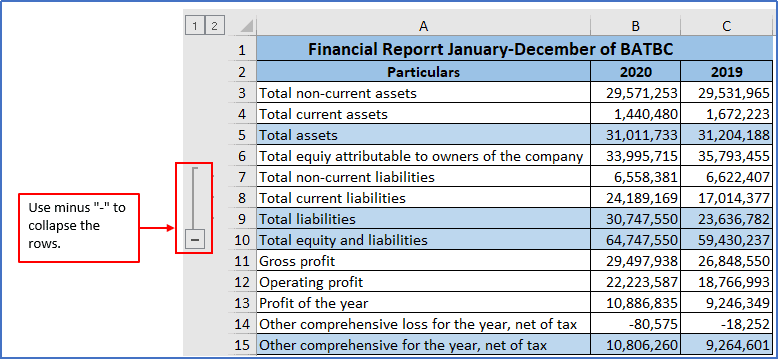
Financial reports often involve extensive data sets with multiple categories and subcategories. By collapsing rows in financial reports, you can present complex financial information in a concise and visually appealing manner. This allows decision-makers to focus on specific areas of interest without being overwhelmed by unnecessary details. Collapsed rows also enable easy comparison of financial data and facilitate the identification of trends or discrepancies.
Here use minus”- “ sign in Financial Report for those rows you want to collapse.
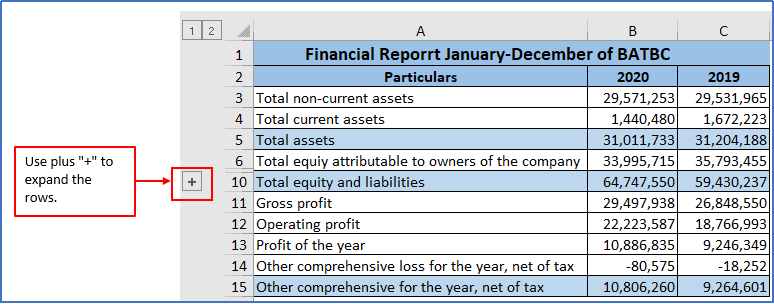
Here you can see that, Total non-current liabilities, Total liabilities and Total equity and liabilities columns are collapsed. The Plus”+”sign will help you to expand the collapsed rows.
6.2 Project Management
Row collapse is particularly beneficial in project management where tasks, subtasks, and milestones need to be tracked and monitored. By collapsing rows, you can create a hierarchical structure that allows team members to view and analyze project progress at various levels of detail. This improves visibility into timelines, dependencies, and resource allocation. Collapsed rows also provide a clear overview of project milestones, key deliverables, and critical paths.
Here use minus”- “ sign in Project Management for those rows you want to collapse.
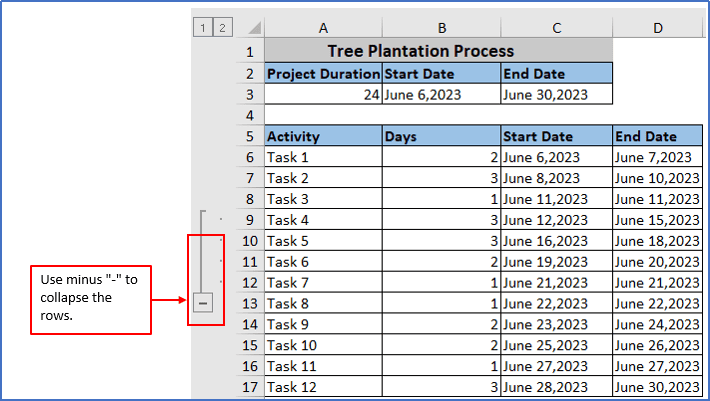
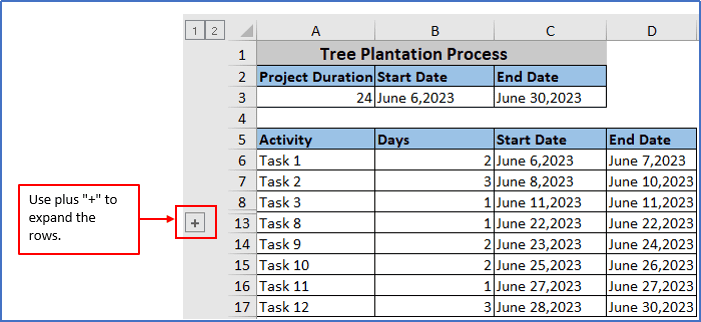
Here you can see that, Task 4-Tak 7 has collapsed. The Plus”+”sign will help you to expand the collapsed rows.
6.3 Inventory Tracking
In industries that manage inventory, such as retail or manufacturing, row collapse can significantly improve inventory tracking processes. By collapsing rows that represent specific product categories or SKUs, you can categorize inventory items and easily assess stock levels, analyze sales performance, and identify potential stockouts or overstock situations. Collapsed rows simplify inventory reports and make it easier to generate accurate forecasting and demand planning insights.
Conclusion
Row collapse is a powerful feature in Excel that offers numerous benefits for data management and spreadsheet organization. By summarizing the importance of row collapse, we can highlight the efficiency and ease it brings to your Excel workflow. Incorporating this feature enables you to streamline your spreadsheets, improve data visibility, and navigate large datasets with ease.
FAQs
As we delve deeper into the topic of row collapse in Excel, let’s address some frequently asked questions that commonly arise. Here, we aim to provide clarity and address any doubts you may have regarding the function of expanding and collapsing rows, the process of expanding or collapsing multiple rows at once, expanding or collapsing columns, and keyboard shortcuts for row collapse.
What is the function of expanding and collapsing rows in Excel?
The function of expanding and collapsing rows in Excel allows you to hide or display specific groups of rows within your spreadsheet. By collapsing rows, you can create a more concise and organized view of your data, focusing only on the relevant information. Conversely, expanding rows allows you to reveal hidden data as needed, providing a flexible and seamless way to navigate through your Excel worksheet.
Is it possible to expand or collapse multiple rows at once?
Yes, in Excel, you can expand or collapse multiple rows simultaneously. To achieve this, you can use the grouping feature to create a hierarchy of row groups. By collapsing or expanding the parent group, all the child rows within that group will follow suit. This allows for efficient management of large datasets, saving you time and effort when working with extensive Excel spreadsheets.
Can I expand or collapse columns in Excel?
No, the row collapse feature in Excel is specifically designed to collapse and expand rows, not columns. However, you can achieve a similar effect by hiding or unhiding columns. Simply select the columns you wish to hide, right-click, and choose the “Hide” option. To reveal the hidden columns, select the adjacent columns and choose the “Unhide” option from the right-click menu
Are there any keyboard shortcuts available for row collapse in Excel?
Yes, Excel provides convenient keyboard shortcuts to streamline your workflow when collapsing rows. To expand or collapse a row, simply select the row or the grouped rows and press the “+” or “-” key on your keyboard. This allows for quick and efficient navigation through your Excel spreadsheet, making it easier than ever to manage and organize your data
Source Links
https://softkeys.uk/blogs/blog/how-to-expand-and-collapse-rows-in-excel
https://keys.direct/blogs/blog/how-to-collapse-cells-in-excel