Google Sheets dashboards are transformative tools that leverage the extensive capabilities of Google Sheets to offer a dynamic and interactive view of data. These dashboards are not just about displaying numbers but about telling a story, making complex data accessible and understandable at a glance. They combine data from various sources, allowing for a multifaceted analysis and enabling users to gain insights to drive strategic decisions. Ideal for businesses, educators, and personal use, Google Sheets dashboards are a testament to the power of visual data representation in the digital age.

The Power of Google Sheets Dashboard Template
Dashboards in Google Sheets harness the power of visual data to simplify the understanding of complex datasets. They serve as centralized platforms where key performance indicators (KPIs), analytics, and other critical data points are visualized through charts, graphs, and tables. This visualization aids in quick decision-making and strategy formulation by presenting data in an easily digestible format. Furthermore, Google Sheets’ collaborative nature facilitates real-time sharing and updating of dashboards, making them invaluable for team projects and remote collaborations. The integration capabilities with tools like Google Analytics and Looker Studio enhance their functionality, allowing for deeper data analysis and broader insights.
Overview of Google Sheets Dashboards
A Google Sheets dashboard is a customizable tool that aggregates significant data points into a single, coherent interface. Users can craft dashboards that range from straightforward layouts showcasing essential metrics to intricate designs featuring interactive elements for detailed analyses. The adaptability of Google Sheets ensures dashboards can be tailored to specific requirements, making them applicable across various domains. Whether tracking sales metrics, monitoring project timelines, or analyzing website traffic, Google Sheets dashboards provide a scalable solution to meet diverse data visualization needs.
Benefits of Using Dashboards for Data Visualization
The benefits of using Google Sheets for dashboard creation are manifold. They offer a cost-effective solution for data analysis, eliminating the need for expensive software or specialized training. Dashboards improve data literacy among teams by presenting data in an accessible format, fostering a data-driven culture within organizations. They also enable quick identification of trends, anomalies, and opportunities, facilitating proactive business strategies and decisions. Moreover, the ability to customize and automate dashboards ensures that they remain relevant and valuable over time, adapting to evolving business needs and objectives.
Creating Your First Dashboard in Google Sheets
Selecting the Right Google Sheets Templates
This step-by-step guide helps you create your dashboard in Google Sheets. To create a dashboard in Google Sheets choosing the correct dashboard template is crucial for effective data visualization. Google Sheets offers a variety of templates designed to cater to different analytical needs, from financial reporting and project management to sales tracking and marketing analytics. Selecting the Google Sheets template involves understanding the specific metrics you wish to track and the goals of your dashboard. The right template not only simplifies the dashboard creation process but also ensures that the final product is aligned with your data visualization objectives. You can download free Google Sheets dashboard templates from various platforms.
How to Choose a Dashboard Template
Selecting a dashboard template requires a clear understanding of your data analysis goals and the key metrics that are most relevant to your objectives. Rather than create a dashboard from scratch, you may consider templates that offer the flexibility to customize and scale as your data grows. Look for features like built-in formulas, conditional formatting, and the ability to import data from multiple sources. Choosing the right template balances functionality and simplicity, ensuring that the dashboard remains user-friendly while providing comprehensive insights.
Overview of Available and Free Google Sheets Dashboard Templates
Google Sheets provides a wide array of dashboard templates catering to diverse needs, from KPI dashboards and sales performance trackers to project management and marketing analytics dashboards. These templates come equipped with predefined structures and formulas, making it easier to start visualizing your data immediately. Whether you’re looking to track real-time sales data, monitor project progress, or analyze marketing campaign effectiveness, there’s a template available to jumpstart your dashboard creation process. Ready Google Sheets dashboard templates available at Biz Infograph.
Step-by-Step to Create a Dashboard in Google Sheets
Importing Data to Create a Google Sheets Dashboard
The first step is to create a Google Sheets dashboard is to import your data into Google Sheets. This can be accomplished through various methods, including manual entry, importing spreadsheets from other formats, or connecting to live data sources via Google Sheets’ IMPORT functions. Ensuring data accuracy at this stage is crucial, as it forms the foundation of your dashboard.
Organizing Data for Dashboard with Google Sheets Spreadsheet
Once your data is imported, the next step is to organize it effectively. This involves structuring your data in a way that simplifies analysis and visualization. Utilize Sheets’ features like pivot tables and named ranges to aggregate and segment your data efficiently. A well-organized dataset not only makes it easier to create meaningful visualizations but also enhances the dashboard’s performance.
Create a Sales Dashboard, Management Dashboard, and Project Management Dashboard in Google Sheets
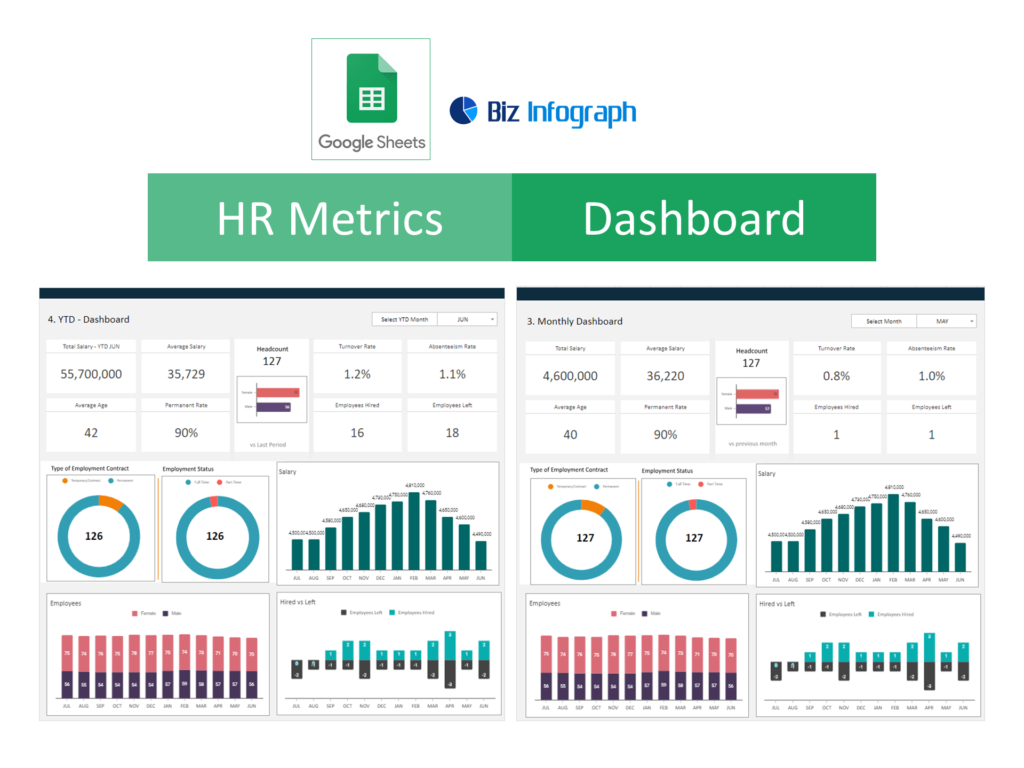
Creating Sales, Management, and Project Management Dashboards in Google Sheets empowers teams to visualize key metrics and insights efficiently. A Sales Dashboard can track and analyze sales activities, highlighting trends and opportunities for growth. It allows for monitoring sales KPIs, lead conversion rates, and customer engagement metrics. A Management Dashboard provides executives and managers a holistic view of the company’s operational, financial, and strategic performance, facilitating informed decision-making. Meanwhile, a Project Management Dashboard focuses on delivering real-time updates on project progress, resource allocation, and budget tracking, ensuring projects stay on course. Leveraging Google Sheets for these dashboards enables seamless collaboration, easy access, and customization, making it an ideal platform for managing various aspects of business operations and strategies effectively.
Selecting and Customizing Charts and Graphs
With your data organized, the final step is to select and customize charts and graphs that best represent your data. Google Sheets offers a variety of chart types, from bar and line charts to pie charts and scatter plots. Customize your visualizations to match your branding or highlight key data points using Google Sheets’ extensive chart editing options. The goal is to create custom dashboard that not only provides valuable insights but is also engaging and easy to understand.
Enhancing Your Dashboard
Integrating Advanced Analytics and Key Metrics (KPI) to Use Google Sheets Dashboard
To transform your Google Sheets dashboard into a strategic tool, integrate advanced analytics and KPIs. This involves linking your dashboard to Google Analytics for real-time website or app data and defining clear KPIs that align with your business goals. Integrating these elements enables you to measure performance against objectives effectively, providing insights that can guide decision-making processes.
Automation Techniques for Up-to-Date Dashboards
Keep your dashboard current with automation techniques that minimize manual updates. To create a dynamic dashboard use Google Sheets’ built-in functions like QUERY and IMPORTXML to fetch live data from external sources. Additionally, explore Google Apps Script for custom automation solutions that can refresh your data at specified intervals, ensuring your dashboard always reflects the most recent information.
Advanced Dashboard Design and Functionality
Visualizing Data with Dynamic Charts and Graphs
Elevate your dashboard by incorporating dynamic charts and graphs that Google Sheets automatically update as your data changes. Google Sheets allows for the creation of interactive visualizations that can adjust based on user inputs or new data, making your dashboard not just a static report but an interactive tool for exploration and analysis.
Customizing Your Dashboard for Maximum Impact
Customize your dashboard to make it visually appealing and easy to understand. This involves thoughtful selection of color schemes, font sizes, and layout designs that enhance readability and user experience. Tailor your dashboard to present your key business performance indicators through the sales dashboard, executive KPI dashboard, management dashboard, HR dashboard, etc.
Expanding Dashboard Capabilities
Linking to External Data Sources and Tools
Maximize the potential of your Google Sheets dashboard by linking it to external data sources or Google drive and analytical tools. Integrate with platforms like Google Data Studio and Looker Studio for advanced data visualization capabilities. This allows for a seamless flow of data between Google Sheets and these tools, enabling more sophisticated analyses and richer visual storytelling.
Sharing and Collaboration
Leverage Google Sheets’ sharing and collaboration features to enhance the impact of your dashboard. Share your dashboard with team members, stakeholders, or clients to provide them with up-to-date insights. Utilize commenting and version history features to collaborate effectively, gather feedback, and make informed decisions together.
Conclusion and Next Steps
Concluding the guide, revisit the key concepts covered in creating and enhancing a Google Sheets dashboard. Emphasize best practices such as regular data validation, dashboard maintenance, and the importance of a user-centered design approach to ensure that your dashboard remains an effective tool for data visualization and decision-making.
Exploring Further Possibilities
Look ahead to the future possibilities of dashboarding in Google Sheets. Discuss anticipated advancements in AI, machine learning, and data integration that could further enhance dashboard functionality. Encourage readers to stay informed about new features and updates in Google Sheets that could offer new ways to visualize and analyze data.
This comprehensive guide aims to equip you with the knowledge and skills to create effective, dynamic dashboards in Google Sheets, transforming raw data into actionable insights and driving informed decisions across various contexts.
You may be interested: