

What if the only thing standing between you and a promotion-worthy dashboard is a handful of hidden, repeated rows? It’s a common professional hurdle that can transform a high-stakes presentation into a source of unnecessary stress. You’ve likely felt that sinking feeling when a stakeholder questions a figure that doesn’t quite add up, leading to hours of wasted time on manual data auditing. We agree that your expertise deserves a better foundation than a cluttered, unreliable spreadsheet.
This 2026 guide empowers you to master the most effective techniques to find duplicates in excel, ensuring your professional reports remain accurate and impactful. Whether you’re using the latest Microsoft 365 Version 2608 or Office 2024, you’ll gain the confidence to manage your data with sophisticated precision. You’ll learn to identify redundant records without the fear of accidentally deleting unique entries, paving the way for faster reporting workflows and total data integrity.
We’ll preview a range of solution-oriented strategies, from simple visual highlighting using Conditional Formatting to advanced Power Query methods for complex datasets. By the end of this article, you’ll have the tools to transform your raw data into a clean, professional asset that makes you shine in front of any audience.
Key Takeaways
- Protect your professional reputation by eliminating identical records that skew insights and erode stakeholder trust.
- Use Conditional Formatting to quickly highlight redundant values, giving you a clear visual map of your dataset’s health.
- Master the “Remove Duplicates” tool to permanently clean your data while maintaining the integrity of unique records.
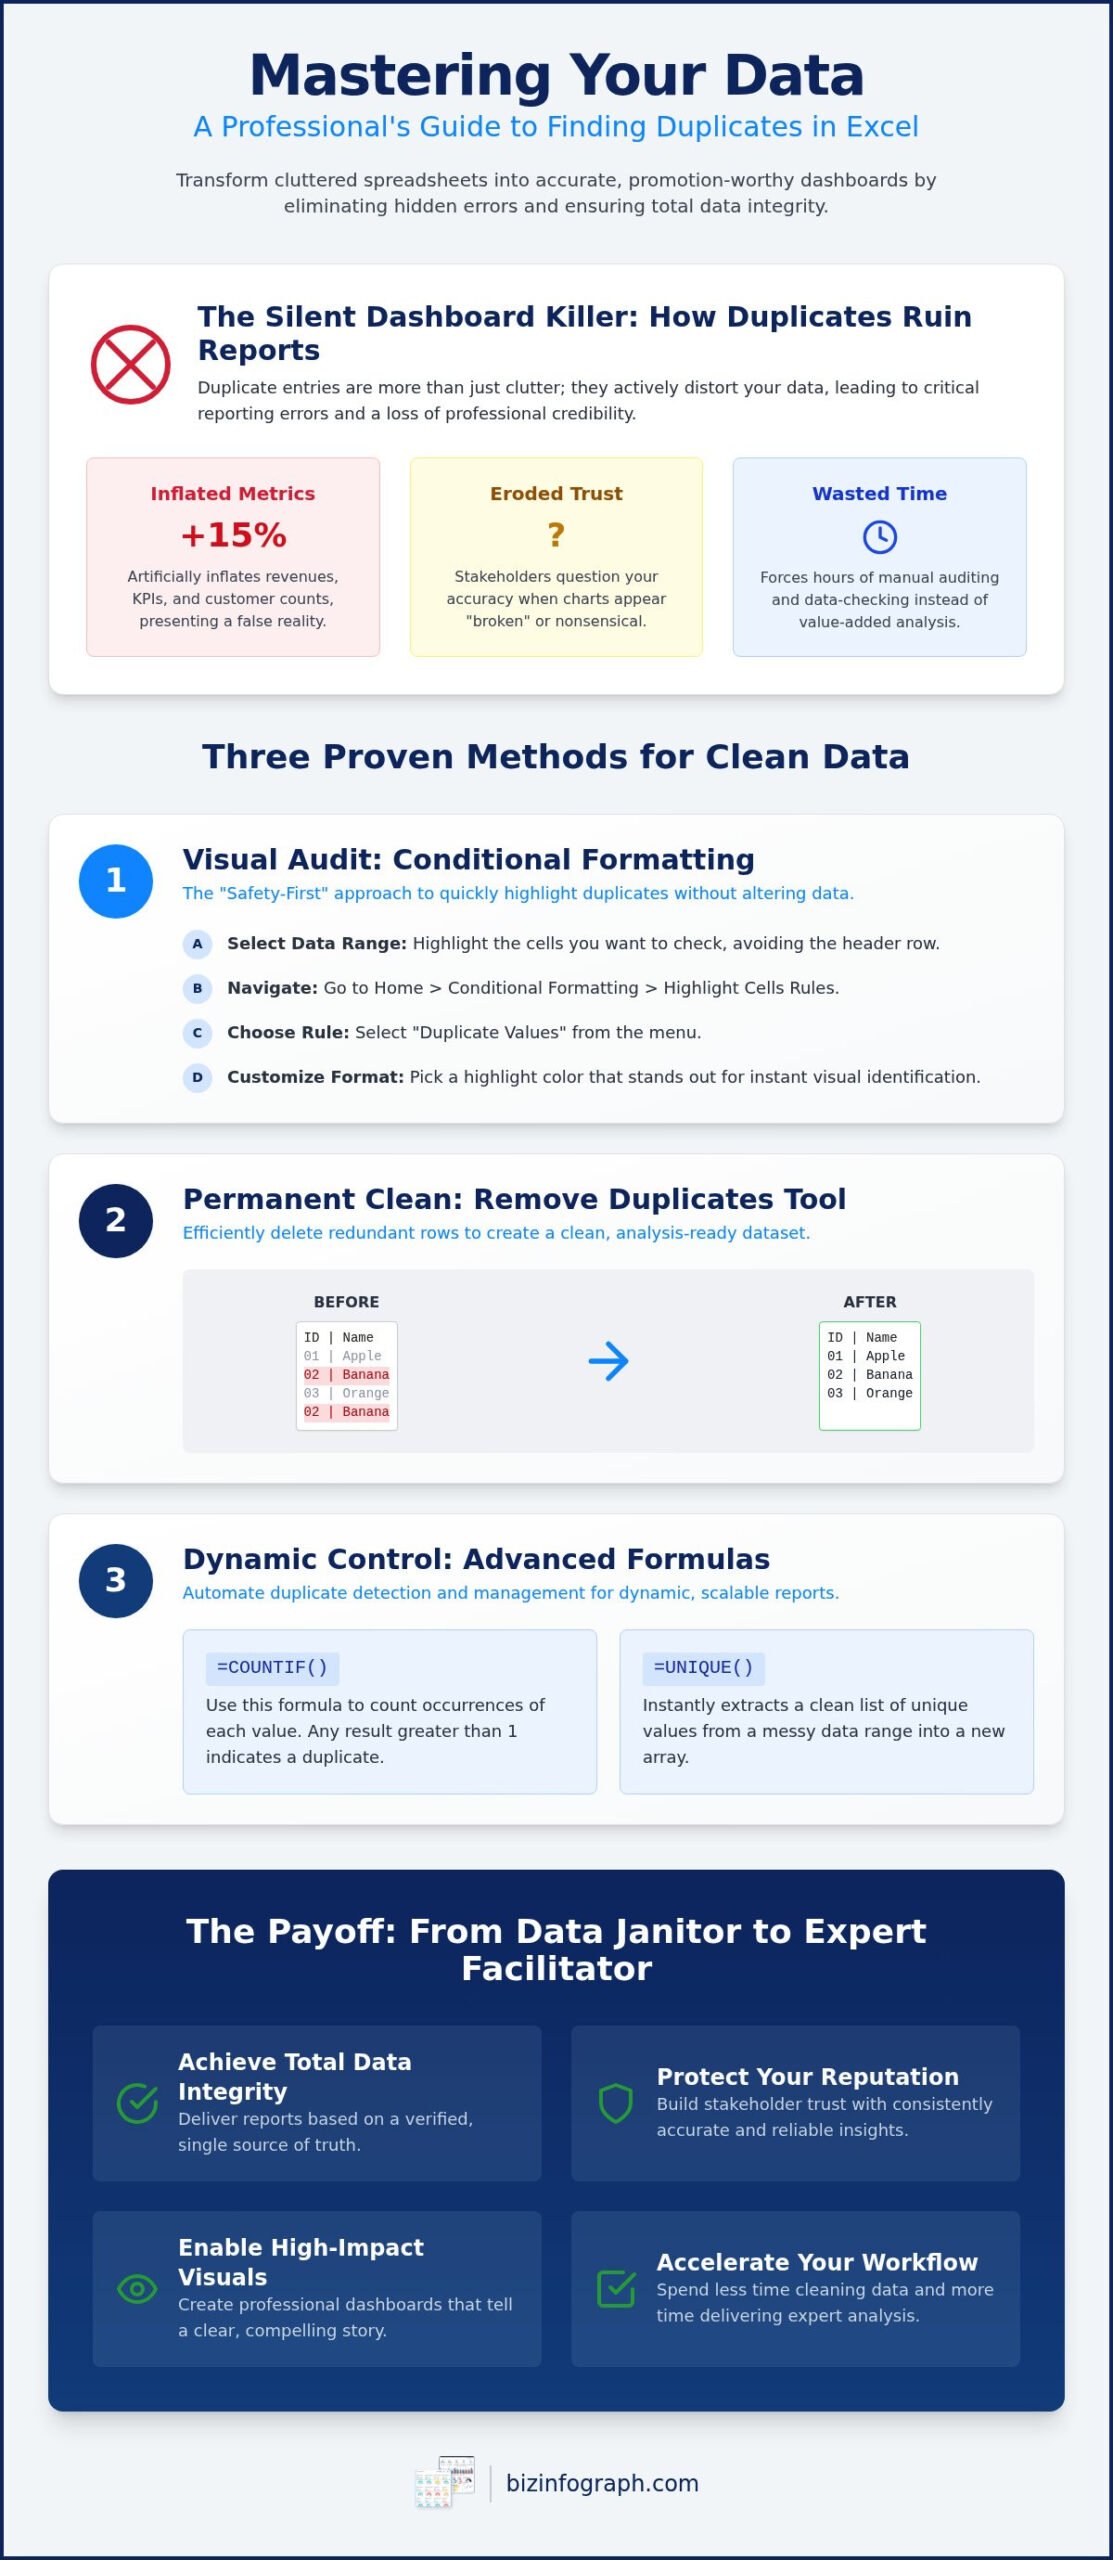
- Discover how to use dynamic formulas like COUNTIF and UNIQUE to find duplicates in excel and automate your data management.
- Transform your clean data into high-impact visuals by leveraging professional Excel dashboard templates that save hours of design work.
Why Finding Duplicates is Crucial for High-Impact Data Visualization
Does your data tell the truth, or is it hiding something? Imagine presenting a quarterly revenue report only to realize your total is 15% higher than reality because of repeated entries. It’s a professional nightmare that can be avoided. Duplicates are identical records that skew your totals and distort visual insights, turning a high-potential presentation into a liability. When you find duplicates in excel early, you protect your reputation and ensure your decision-making is based on facts, not glitches. Accuracy isn’t just a goal. It’s your professional signature.
A robust strategy for Data cleansing isn’t just about deleting rows. It’s about building a foundation for excellence. Your ability to deliver precision is what allows you to effectively use interactive excel dashboard templates. Without clean data, even the most sophisticated visual tool becomes a “garbage in, garbage out” scenario. High-quality templates require high-quality inputs to truly empower your business decisions.
The Silent Dashboard Killer: How Duplicates Ruin Reports
Duplicates act as a silent poison in your reporting. They lead to double-counting, which can artificially inflate revenue, customer counts, or performance KPIs. When your charts are built on inconsistent data, they appear “broken” or nonsensical to stakeholders who know the business well. This isn’t just a technical error; it’s a direct hit to your professional credibility. Relying on manual auditing to catch these errors is a recipe for burnout. Modern professionals need automated, scalable ways to find duplicates in excel to maintain the high-performance standards expected in global business. You don’t have time for manual checks when your stakeholders are waiting for insights.
Visualizing Success Starts with Clean Data
There’s a profound sense of relief that comes from working with a verified, unique dataset. When you know your numbers are solid, you stop acting like a “data janitor” and start performing as an expert facilitator. This mindset shift is crucial. By setting a best-in-class standard for data integrity, you empower yourself to shine during presentations. You aren’t just showing numbers; you’re telling a story that people can trust. Clean data allows your professional aesthetics to take center stage, ensuring your audience focuses on your insights rather than questioning your accuracy. It’s the first step toward transforming your workflow from a struggle into a source of personal pride.
Using Conditional Formatting to Highlight Duplicates Visually
Visual clarity is the hallmark of a professional analyst. Conditional Formatting serves as your “safety-first” visual audit tool, allowing you to spot errors before taking any permanent action. It’s the most intuitive way to find duplicates in excel while keeping your original dataset intact. By using color to flag redundant entries, you turn a tedious manual search into a fast, high-energy review process that ensures your data remains best-in-class.
- Step 1: Select your data range. Highlight the specific cells you want to analyze. Be careful to avoid the header row; including it might lead Excel to flag your labels as duplicates if they appear in the data below.
- Step 2: Navigate to the Home tab. Locate the Conditional Formatting button within the Styles group. This is your gateway to dynamic data visualization.
- Step 3: Choose Highlight Cells Rules. From the subsequent dropdown menu, select Duplicate Values. A dialog box will appear immediately to guide your choices.
- Step 4: Customize your formatting. Don’t settle for the default settings if they don’t match your professional aesthetic. Use the dialog box to highlight duplicate values with a custom format that makes them pop instantly against your standard cells.
The “Safety First” Approach to Data Auditing
Why rush to delete when you can review? Highlighting is significantly better than deleting when you’re still in the review phase. It gives you the chance to investigate why a duplicate exists in the first place. Once your data is colored, use the “Filter by Color” feature to isolate those specific rows. This allows you to manage multiple columns and verify unique combinations of data before making any final changes. It’s about being thorough and maintaining the high-end quality your stakeholders expect. By taking this approach, you build a foundation of trust in your reporting.
Pro Tip: Finding Duplicates Across Rows
Massive spreadsheets often generate significant visual noise, making it hard to focus on what matters. If you need to check if entire rows are identical, use a helper column to concatenate the data from multiple cells. By applying your formatting to this single helper column, you can find duplicates in excel that repeat across your entire sheet. This streamlined approach ensures your Excel dashboard templates remain accurate and visually clean. It’s a simple step that transforms a cluttered mess into a best-in-class professional asset, allowing you to spend less time auditing and more time driving impact.
Removing Duplicate Values for a Clean Accurate Dataset
Ready to move beyond just seeing the problem? It’s time to take decisive action. While visual highlighting is a great first step, permanent removal is what truly prepares your data for high-stakes analysis. You’ve already used visual cues to find duplicates in excel; now, let’s clean the slate to ensure your professional dashboards remain lean and accurate. This process transforms your raw spreadsheet into a high-performance asset that you can present with absolute pride.
- Access the Tool: Navigate to the Data tab on your ribbon and locate the Remove Duplicates icon in the Data Tools group. It’s a direct, punchy way to scrub your dataset in seconds.
- Define the Scope: A dialog box will appear asking you to select columns. If you select all columns, Excel only removes rows that are 100% identical. If you select only a “Customer ID” column, Excel will delete every subsequent row with that ID, regardless of other data.
- Respect the Headers: Always ensure the “My data has headers” box is checked. This prevents Excel from treating your titles as data points and accidentally deleting your top row.
- Review the Results: Once you click OK, Excel provides a brief summary report. It tells you exactly how many duplicate values were found and removed, and how many unique values remain.
The Permanent Deletion Checklist
Precision requires a safety net. Before you click that final button, always copy your original sheet to a new tab. This simple habit is the mark of a seasoned specialist. If your data contains subtotals or outlines, remove them first, as these can confuse the removal logic. You should also check for hidden characters or trailing spaces. A cell containing “Apple ” (with a space) won’t match “Apple” (without a space), which can trick the system when you try to find duplicates in excel. Use the TRIM function beforehand to ensure your data is as polished as possible.
When to Use “Remove” vs. “Filter Unique”
Do you need to delete data, or just hide the noise? The “Remove Duplicates” tool is permanent, making it ideal for creating a master “Golden Record” list. However, if you want to keep your original data intact while viewing only unique entries, use the Advanced Filter tool to “Filter for unique records only.” This is incredibly useful when you need to create a drop down list in excel based on a specific column. By filtering for unique values first, your drop-down menus will look professional and remain free of redundant options, allowing your users to navigate your dashboard with ease and speed.
Advanced Formula Techniques for Dynamic Data Management
Why settle for static data cleaning when you can build a self-healing spreadsheet? Formulas empower you with automated, hands-off data cleaning to find duplicates in excel before they ever reach your final report. By moving beyond one-time removals, you ensure your datasets remain best-in-class as new information flows in. This approach transforms you from a manual auditor into a true productivity partner. It’s about working smarter and letting the software handle the heavy lifting while you focus on high-impact insights.
The COUNTIF function is your first line of defense for creating a “Duplicate Flag” column. By entering a formula like =COUNTIF($A$2:$A$500, A2) > 1, you generate a dynamic TRUE or FALSE result that updates the moment data changes. You can even combine this logic with Data Validation to block duplicates at the source. Simply set a custom validation rule using the same COUNTIF logic to prevent users from entering redundant records. This proactive stance ensures your data remains clean from the very first keystroke. Once your dataset is free of duplicates, pairing it with advanced statistical analysis — such as learning how to calculate standard deviation in excel — allows you to measure data consistency and present volatility insights with executive-level confidence.
The Power of the UNIQUE Function
The =UNIQUE(range) function is a total game-changer for professionals in 2026. This dynamic array formula automatically extracts a list of distinct values, effectively creating a real-time, self-cleaning list. It’s the perfect tool for feeding dynamic charts and dashboard elements that need to stay current without manual intervention. While this function is a staple in modern versions like Microsoft 365 Version 2608, those on older legacy versions may still need to rely on Advanced Filters. For the modern analyst, it’s the gold standard for maintaining a unique dataset with zero extra effort.
Pro-Level Auditing with Power Query
When you’re dealing with millions of rows, Power Query stands as the ultimate “Expert Facilitator” tool. It allows you to use the “Group By” method to count occurrences across massive datasets in seconds, providing a level of depth that standard formulas can’t match. The real magic happens when you save these steps as a query. Every time you refresh your data, Power Query automatically re-runs your cleaning logic, ensuring you never have to repeat the same manual steps again. Elevate your reporting speed and accuracy by pairing these clean, automated lists with our Excel Dashboard Templates. It’s a bold, innovative way to ensure your professional aesthetics are always backed by perfectly scrubbed data.
Scaling Productivity with Professional Excel Dashboard Templates
You’ve mastered the technical side. You now know exactly how to find duplicates in excel to ensure your data is flawless. But a clean spreadsheet is just the beginning of your journey toward professional excellence. The real magic happens when you transform that unique dataset into a visual story that drives business results. Manual data cleaning is the essential first step toward high-end visualization. It ensures that when you plug your numbers into a professional dashboard, every chart and KPI reflects the absolute truth. This is where your role as an expert facilitator truly begins, moving you beyond the rows and columns into the world of impact.
Why spend dozens of hours building a dashboard from scratch when the heavy lifting has already been done for you? Professional templates save you from the exhausting frustration of design and formatting effort. Instead of wrestling with complex cell borders or inconsistent color schemes, you can focus your energy on strategic storytelling and decision-making. For finance professionals specifically, a well-designed financial dashboard excel template can reclaim hours of manual reporting time while delivering instant visibility into cash flow and profitability. By choosing best-in-class tools, you’re adopting a more modern and effective way of working that mirrors the standards of global leaders. This is the Biz Infographs advantage: providing high-quality digital products that make you shine in front of your audience.
From Clean Data to Stunning Visuals
Our Excel dashboard templates demand clean data because excellence shouldn’t be built on a shaky foundation. When you remove the friction of manual design, you empower your entire team with standardized, professional reporting tools. This level of consistency builds a bridge of trust across your department or business. It allows stakeholders to look at the same verified figures without questioning the underlying integrity of the records. You effectively move from being a data janitor to a strategic partner who delivers high-energy impact with every presentation. It’s about creating a polished aesthetic that commands respect.
Your Productivity Partnership Starts Here
Imagine the relief of walking into a high-stakes meeting knowing your data is accurate and your design is elite. You no longer have to worry about presenting flawed figures to stakeholders or losing face over a double-counted revenue line. With our professional assets, you gain access to lifetime updates and expert support, ensuring your reporting remains at the cutting edge through 2026 and beyond. It’s time to stop wasting precious hours on manual auditing and start focusing on the insights that move the needle. Elevate your data game today. Transform your professional frustration into a source of personal pride by choosing tools specifically designed for your success.
Master Your Data Excellence Today
Transforming messy spreadsheets into polished, professional reports is a journey that begins with a single, crucial step: accuracy. You now possess the specialized skills to find duplicates in excel using visual auditing, permanent removal tools, and dynamic formulas. By mastering these techniques, you’ve moved past the frustration of manual data cleaning and established a foundation of total data integrity. You aren’t just managing rows anymore; you’re facilitating better business decisions for your entire organization.
With your data perfectly scrubbed, you’re ready to shine in front of any audience. Why waste hours on design when you can leverage the same tools used by global business leaders? Our premium assets require minimal design effort for maximum impact, allowing you to focus on strategic storytelling instead of formatting. Every purchase includes lifetime updates to ensure your reporting remains best-in-class as software evolves.
Explore Professional Excel Dashboard Templates and take the final step toward elite productivity. You’ve done the hard work of cleaning your data; now it’s time to let your insights take center stage. We’re here to help you turn every presentation into a source of personal pride.
Frequently Asked Questions
How do I find duplicates in Excel without deleting them?
Use Conditional Formatting to visually identify repeated records without altering your underlying dataset. This safety-first method allows you to find duplicates in excel while keeping every record intact for a manual audit. Navigate to the Home tab and select Highlight Cells Rules to apply a custom color. It’s a best-in-class way to ensure your dashboard foundation remains solid before you commit to any permanent deletions.
Can I find duplicates across two different columns in Excel?
You can identify multi-column duplicates by using a helper column or the COUNTIFS function. Simply concatenate your target cells using the ampersand symbol, such as =A2&B2, and apply your duplicate check to that new string. This ensures you’re flagging unique combinations of data rather than single-cell repeats. It’s a sophisticated technique that empowers you to manage complex datasets with the precision of a seasoned data specialist.
What is the fastest shortcut to remove duplicates?
The fastest way to access the removal tool is by using the keyboard shortcut Alt, A, M in sequence. This instantly triggers the Remove Duplicates dialog box, saving you precious seconds of navigation time. Efficiency is the hallmark of a high-performance professional; mastering these shortcuts allows you to focus on high-impact visualization. Always remember to select your range first to ensure the tool targets the correct data for your report.
Why is Excel not finding all my duplicate values?
Inconsistent data is often caused by trailing spaces, hidden characters, or mismatched formatting types. If one cell is formatted as text and the other as a number, Excel won’t recognize them as identical. Use the TRIM function to scrub your data of extra spaces before you attempt to find duplicates in excel. This small step eliminates the frustration of missing duplicates and ensures your final professional dashboard reflects the absolute truth.
How do I highlight only the second occurrence of a duplicate?
You can isolate subsequent repeats by applying a custom Conditional Formatting formula. Use =COUNTIF($A$2:A2, A2)>1 to tell Excel to only flag values that have already appeared earlier in the list. This leaves the first original record clean while highlighting every following instance. It’s an innovative way to audit your data without losing sight of your primary records, providing the clarity needed for elite-level reporting and analysis.
Is there a way to prevent duplicates from being entered in the first place?
Proactive data management starts with Data Validation to block redundant entries at the source. Select your input range, navigate to the Data tab, and choose Custom validation with the formula =COUNTIF($A$2:$A$500, A2)=1. This prevents users from entering a value that already exists in your list. It’s a bold, solution-oriented strategy that keeps your spreadsheet clean from the start, reducing the need for time-consuming manual audits later.
How do I find duplicates in a PivotTable?
To spot duplicates within a PivotTable, simply drag your primary field into both the Rows and Values areas. Set the value field to Count instead of Sum to see how many times each entry appears. Any number greater than one indicates a duplicate in your source data. This method provides a high-level summary that allows you to identify and resolve data integrity issues before they distort your final visual insights.
Does the Remove Duplicates tool work on hidden rows?
The Remove Duplicates tool is comprehensive and will process every row within your selected range, including those that are hidden. It’s a powerful feature, but it requires caution since you won’t see the hidden rows being deleted in real-time. Always create a backup of your worksheet before running the tool on a dataset with hidden information. This ensures you maintain control over your professional assets while achieving a clean, accurate result.
One reply on “Find Duplicates in Excel: 2026 Data Cleaning Guide”
[…] a larger group based on a smaller one. Before you run this, ensure your data is accurate. Learning finding duplicates in excel is a critical first step to ensure your sample isn’t skewed by repeated entries. Once your […]