
Introduction to Executive Dashboards in Google Sheets
Understanding Executive Dashboards
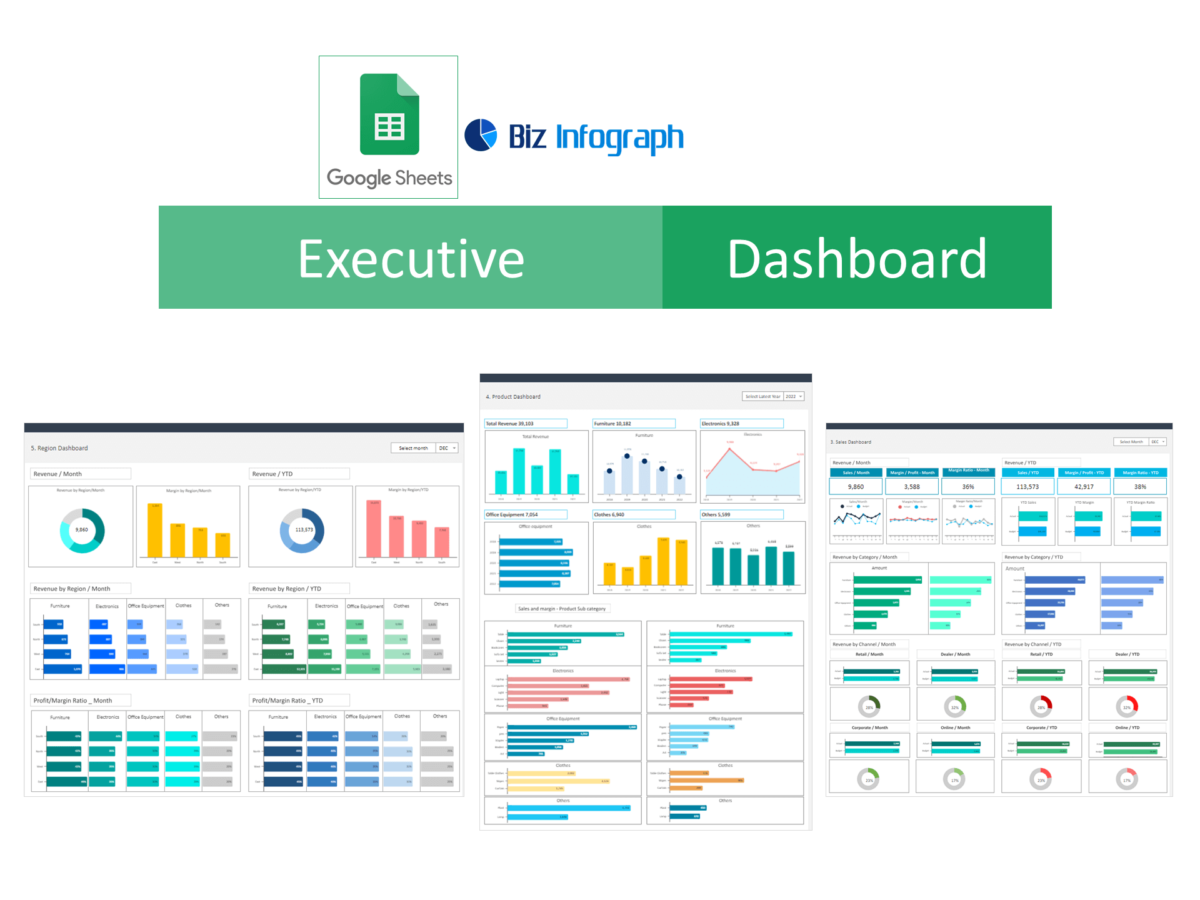
Executive dashboards are vital tools for high-level management, providing a visual snapshot of a company’s performance and key metrics. Dashboard template in Google Sheets consolidates data from various sheets, offering a centralized view of critical information. This facilitates informed decision-making by displaying trends, comparisons, and real-time insights across different areas such as sales, marketing, and operations. Understanding how to effectively design and implement these dashboards in Google Sheets can significantly impact strategic planning and business outcomes.
Benefits of Using Google Sheets for Dashboards
Google Sheets offers a flexible and accessible platform for creating executive dashboards. Its real-time collaboration features allow teams to update and view data simultaneously, ensuring all stakeholders have the latest information. Google Sheets dashboard templates available on the web make it easy to start without extensive technical knowledge. Additionally, Google Sheets integrates seamlessly with other data sources and tools, such as Google Analytics and CRM systems, allowing for a comprehensive view of business performance.
Key Components of an Effective Analytics Dashboard Template
An effective dashboard in Google Sheets should include clear, concise, and relevant information tailored to the needs of its users. Key components include KPIs (Key Performance Indicators), real-time data updates, and visual elements like charts and graphs to aid in data interpretation. The dashboard should be organized logically, with the ability to drill down for more detailed analysis. Customization and scalability are crucial, as the dashboard should evolve with the business.
Getting Started with Google Sheets Dashboard Templates
Create a Google Sheets Spreadsheet for Dashboard Development
To build an executive KPI dashboard in Google Sheets, start by familiarizing yourself with its features and functions. Learn how to import data, use formulas to calculate metrics, and create dynamic charts and graphs. Understanding the basics of spreadsheet navigation and data organization is crucial for building an effective custom dashboard. Explore the different visualization options Google Sheets offers to best represent your data.
How to Access Free Google Sheets Dashboard Templates
You can access free Google Sheets dashboard templates through various online resources, including the Google Sheets template gallery, business intelligence websites, and community forums. These templates serve as a starting point, which you can customize to fit your specific business needs. Simply download the free dashboard template and import it into your Google Sheets account to get started.
Tips for Customizing Your Dashboard Template for Google Sheets
When customizing your Google Sheets dashboard templates, focus on aligning the dashboard with your business objectives. Select KPIs that reflect your company’s goals and update the template to include your data sources. Customize the layout and design to make the dashboard user-friendly and visually appealing. Test different visualization tools within Google Sheets to find the most effective ways to present your data.
Core Types of Executive Dashboards
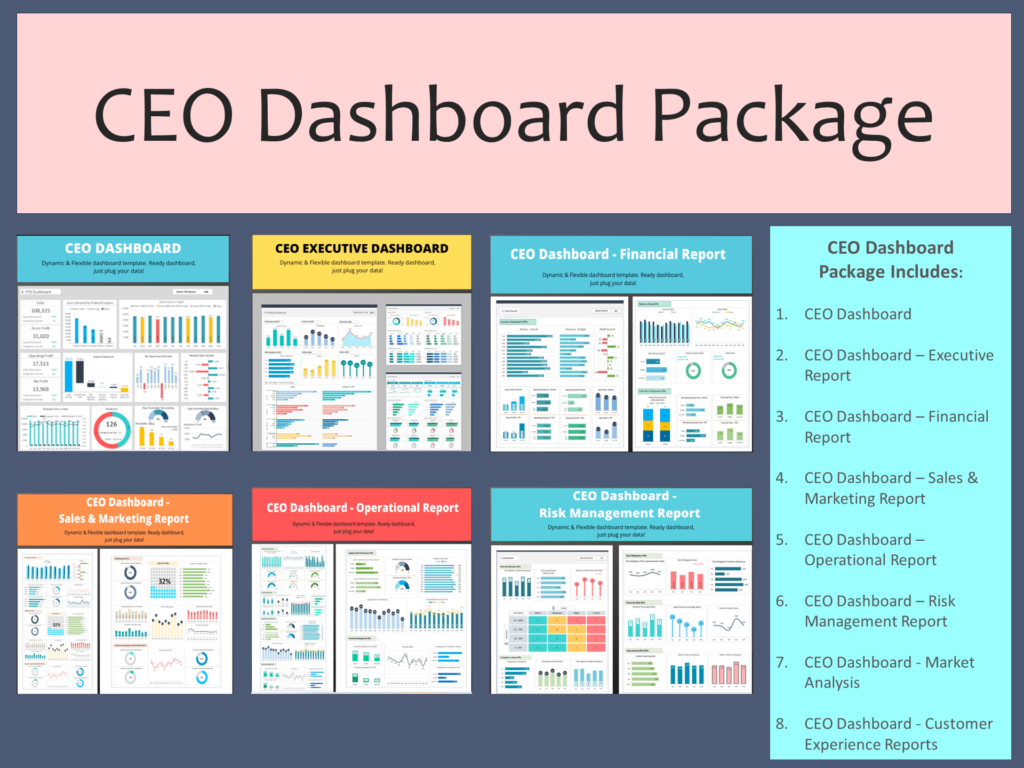
CEO Dashboard – Executive Summary
The CEO Dashboard in Google Sheets should provide a high-level overview of the company’s overall performance. It typically includes financial metrics, overall business health, and progress towards strategic goals. This dashboard template focuses on summarizing key data points and trends that are crucial for executive decision-making, such as revenue, profit margins, and key business opportunities and risks.
Financial Dashboard – Monitoring Financial KPI
A Financial Dashboard in Google Sheets tracks and displays vital financial data and metrics, such as cash flow, expenses, and revenue streams. This dashboard helps executives monitor the company’s fiscal health, identify financial trends, and make informed decisions about budgeting, investment, and financial planning. It should include dynamic charts and tables to visualize financial performance over time.
Sales & Marketing Dashboard – Executive Sales Dashboard
The Sales & Marketing Dashboard combines data from sales and marketing campaigns to provide insights into overall performance, customer engagement, and revenue generation. The sales and marketing dashboard template should track metrics such as monthly sales, conversion rates, marketing ROI, and customer acquisition costs. This template helps align sales and marketing efforts with business objectives, highlighting areas for improvement and opportunities for growth.
Operational Dashboard – Operational KPI Dashboard Template
An Operational Dashboard focuses on the day-to-day processes and efficiency of the business. It should include metrics related to production, customer service, inventory levels, and supply chain management. This Google Sheets dashboard helps identify bottlenecks, improve operational efficiency, and reduce costs by providing real-time data on business operations.
Risk Management Dashboard – Identifying and Mitigating Risks of Project Management
The Risk Management Dashboard in Google Sheets helps project managers identify, assess, and mitigate potential risks to the business. It should include data on operational, financial, and strategic risks, along with mitigation strategies and risk prioritization. This dashboard is essential for proactive risk management and ensuring business continuity.
Market Analysis Dashboard – Understanding Market Dynamics
This dashboard template focuses on analyzing market trends, customer behavior, and competition. It should include metrics such as market share, competitor analysis, and customer demographics. The Market Analysis Dashboard in Google Sheets aids in strategic planning and helps businesses adapt to changing market conditions.
Customer Experience Dashboard – Enhancing Customer Satisfaction
The Customer Experience Dashboard tracks metrics related to customer satisfaction, loyalty, and feedback. It should include data on customer service interactions, NPS scores, and customer retention rates. This Google Sheets dashboard helps businesses understand and improve the customer journey, leading to increased customer satisfaction and loyalty.
Other specific dashboards may be included like the Sales executive dashboard, marketing timeline template, project tracking template, customer relationship management dashboard, etc.
Building Your Executive Dashboard in Google Sheets
Step-by-Step Guide to Building an Executive Dashboard
Building an executive dashboard in Google Sheets starts with defining your objectives and key metrics. Collect and consolidate data from various sources, then choose appropriate chart types and visualizations to represent your data effectively. Structure your dashboard logically, ensuring it is intuitive and easy to navigate. Incorporate real-time data where possible, and set up automatic updates to ensure the dashboard remains current.
Implementing Real-Time Data and Analytics
Incorporating real-time data into your Google Sheets dashboard allows for up-to-the-minute monitoring and decision-making. Utilize Google Sheets’ integration capabilities to connect to live data sources, such as sales platforms, marketing tools, and financial systems. This ensures that your executive dashboard reflects the most current data, enabling timely and informed decisions.
Integrating KPIs and Performance Metrics
Select KPIs that align with your business goals and are indicative of your company’s performance. Use Google Sheets functions and formulas to calculate these metrics, and display them prominently on your dashboard. Regularly review and update your KPIs to ensure they remain relevant and aligned with your strategic objectives.
Advanced Google Sheets Dashboard Features
Utilizing Advanced Formulas and Functions
To maximize the potential of your Google Sheets dashboard, familiarize yourself with advanced formulas and functions. These can help you automate data analysis, perform complex calculations, and create dynamic, interactive elements within your dashboard. Explore functions like QUERY, VLOOKUP, and ARRAYFORMULA to enhance your data manipulation capabilities.
Leveraging Google Sheets for Increased Sales and Marketing Impact
Use your Google Sheets dashboard to track and analyze sales and marketing metrics in real-time. Implement tracking for sales activity, marketing KPI, and customer interactions to identify trends and opportunities for growth. Customize your dashboard to highlight areas that contribute to sales and marketing success, and use this information to refine strategies and increase ROI.
Customizing Dashboards for Different Management Levels
Different management levels require different information. Customize your Google Sheets dashboards to cater to the specific needs of each management tier. For example, operational managers may need detailed, granular data, while C-level executives might require a broader overview. Tailor the content, detail, and complexity of each dashboard to its intended audience.
Best Practices for Executive Dashboards
Essential Elements to Include in Your Executive Dashboard
An effective executive dashboard should include essential elements such as clear objectives, relevant KPIs, intuitive layout and design, and actionable insights. Ensure that your Google Sheets dashboard is user-friendly, with data presented in a clear, concise, and visually appealing manner. Include comparative metrics and historical data to provide context for your KPIs. Visual elements should include pie chart, Gantt chart, bar chart, column chart, area chart etc.
Tips for Using Free Google Sheets Dashboard Templates Effectively
When using free Google Sheets templates, customize them to fit your business needs. Ensure that the data sources are correctly linked, and the KPIs reflect your specific objectives. Take advantage of the flexibility of Google Sheets to modify and expand your dashboard as your business evolves. Regularly review and update your dashboard to maintain its relevance and effectiveness.
Strategies for Maintaining and Updating Your Dashboards
Regular maintenance and updates are crucial for keeping your executive dashboard relevant and effective. Set a schedule for regular reviews and updates, and ensure that your data sources remain accurate and up-to-date. Encourage feedback from users to continually improve the dashboard’s functionality and relevance. Consider automating data updates and incorporating new metrics as your business needs change.
Additional Resources and Tools
Recommended Google Sheets Templates for Various Business Needs
Discover recommended Google Sheets templates for a variety of business needs, from sales tracking and project management to marketing timelines and customer relationship management. These templates provide a solid foundation for building your executive dashboards, saving time and ensuring consistency across your business operations.
Free Resources for Learning More About Google Sheets and Dashboards
Utilize free resources to enhance your knowledge and skills in creating effective dashboards in Google Sheets. Explore tutorials, guides, and online courses that cover everything from basic spreadsheet functions to advanced dashboard design and data analysis techniques.
Tools and Add-ons to Enhance Your Google Sheets Dashboard
Explore tools and add-ons that can enhance the functionality and appearance of your Google Sheets dashboard. From data connectors and automation tools to visualization plugins, these resources can help streamline your dashboard creation process, improve data accuracy, and make your dashboards more interactive and engaging. You will find more Google Sheets dashboard templates available for download at Biz Infograph.
For ready-to-use Dashboard Templates: