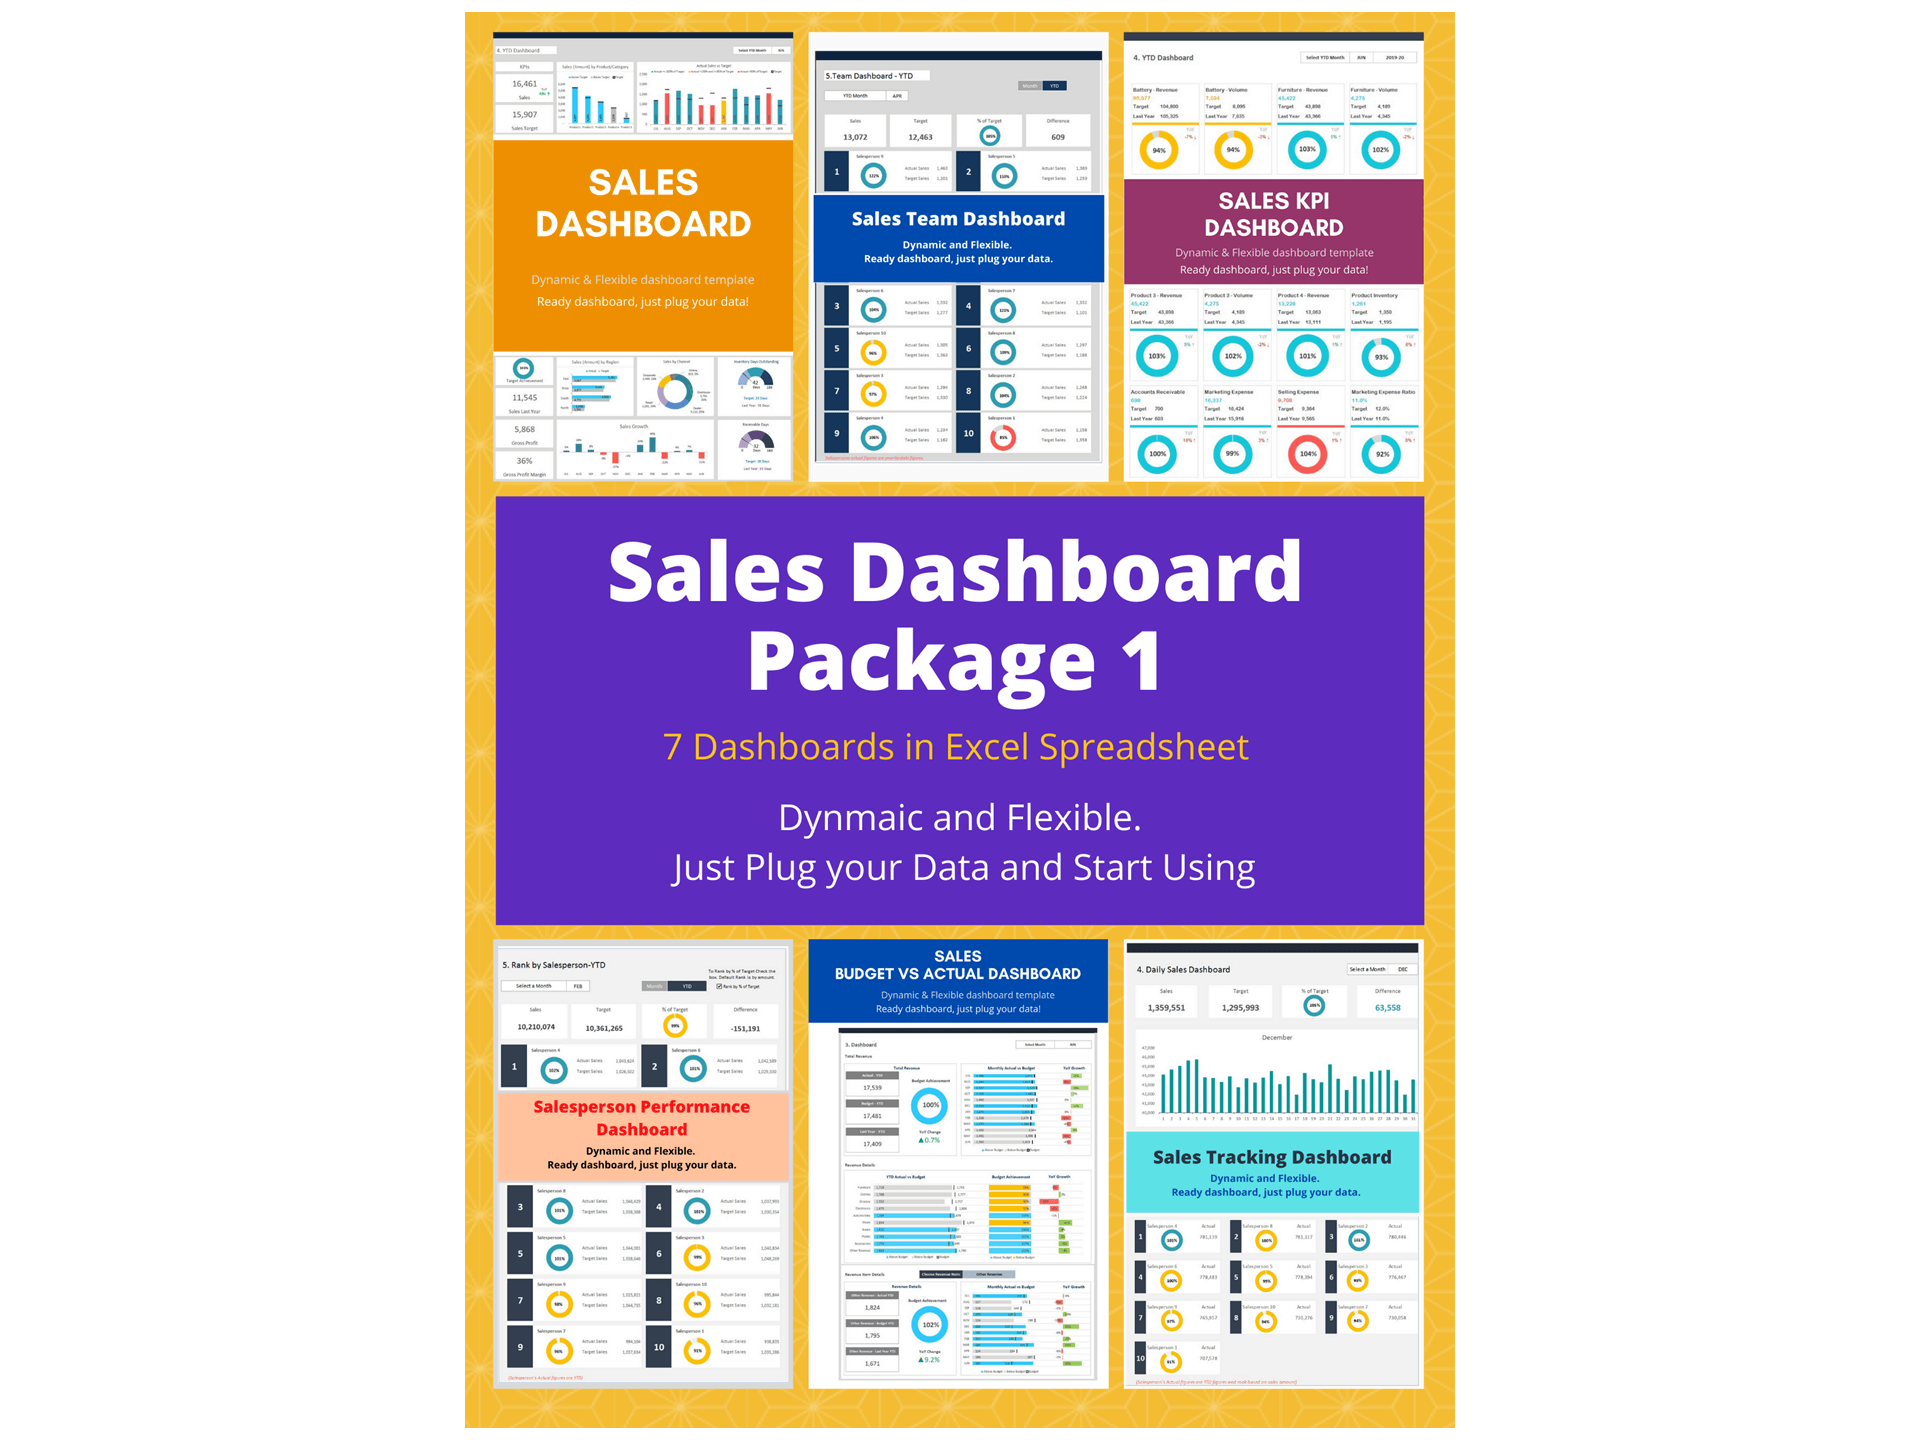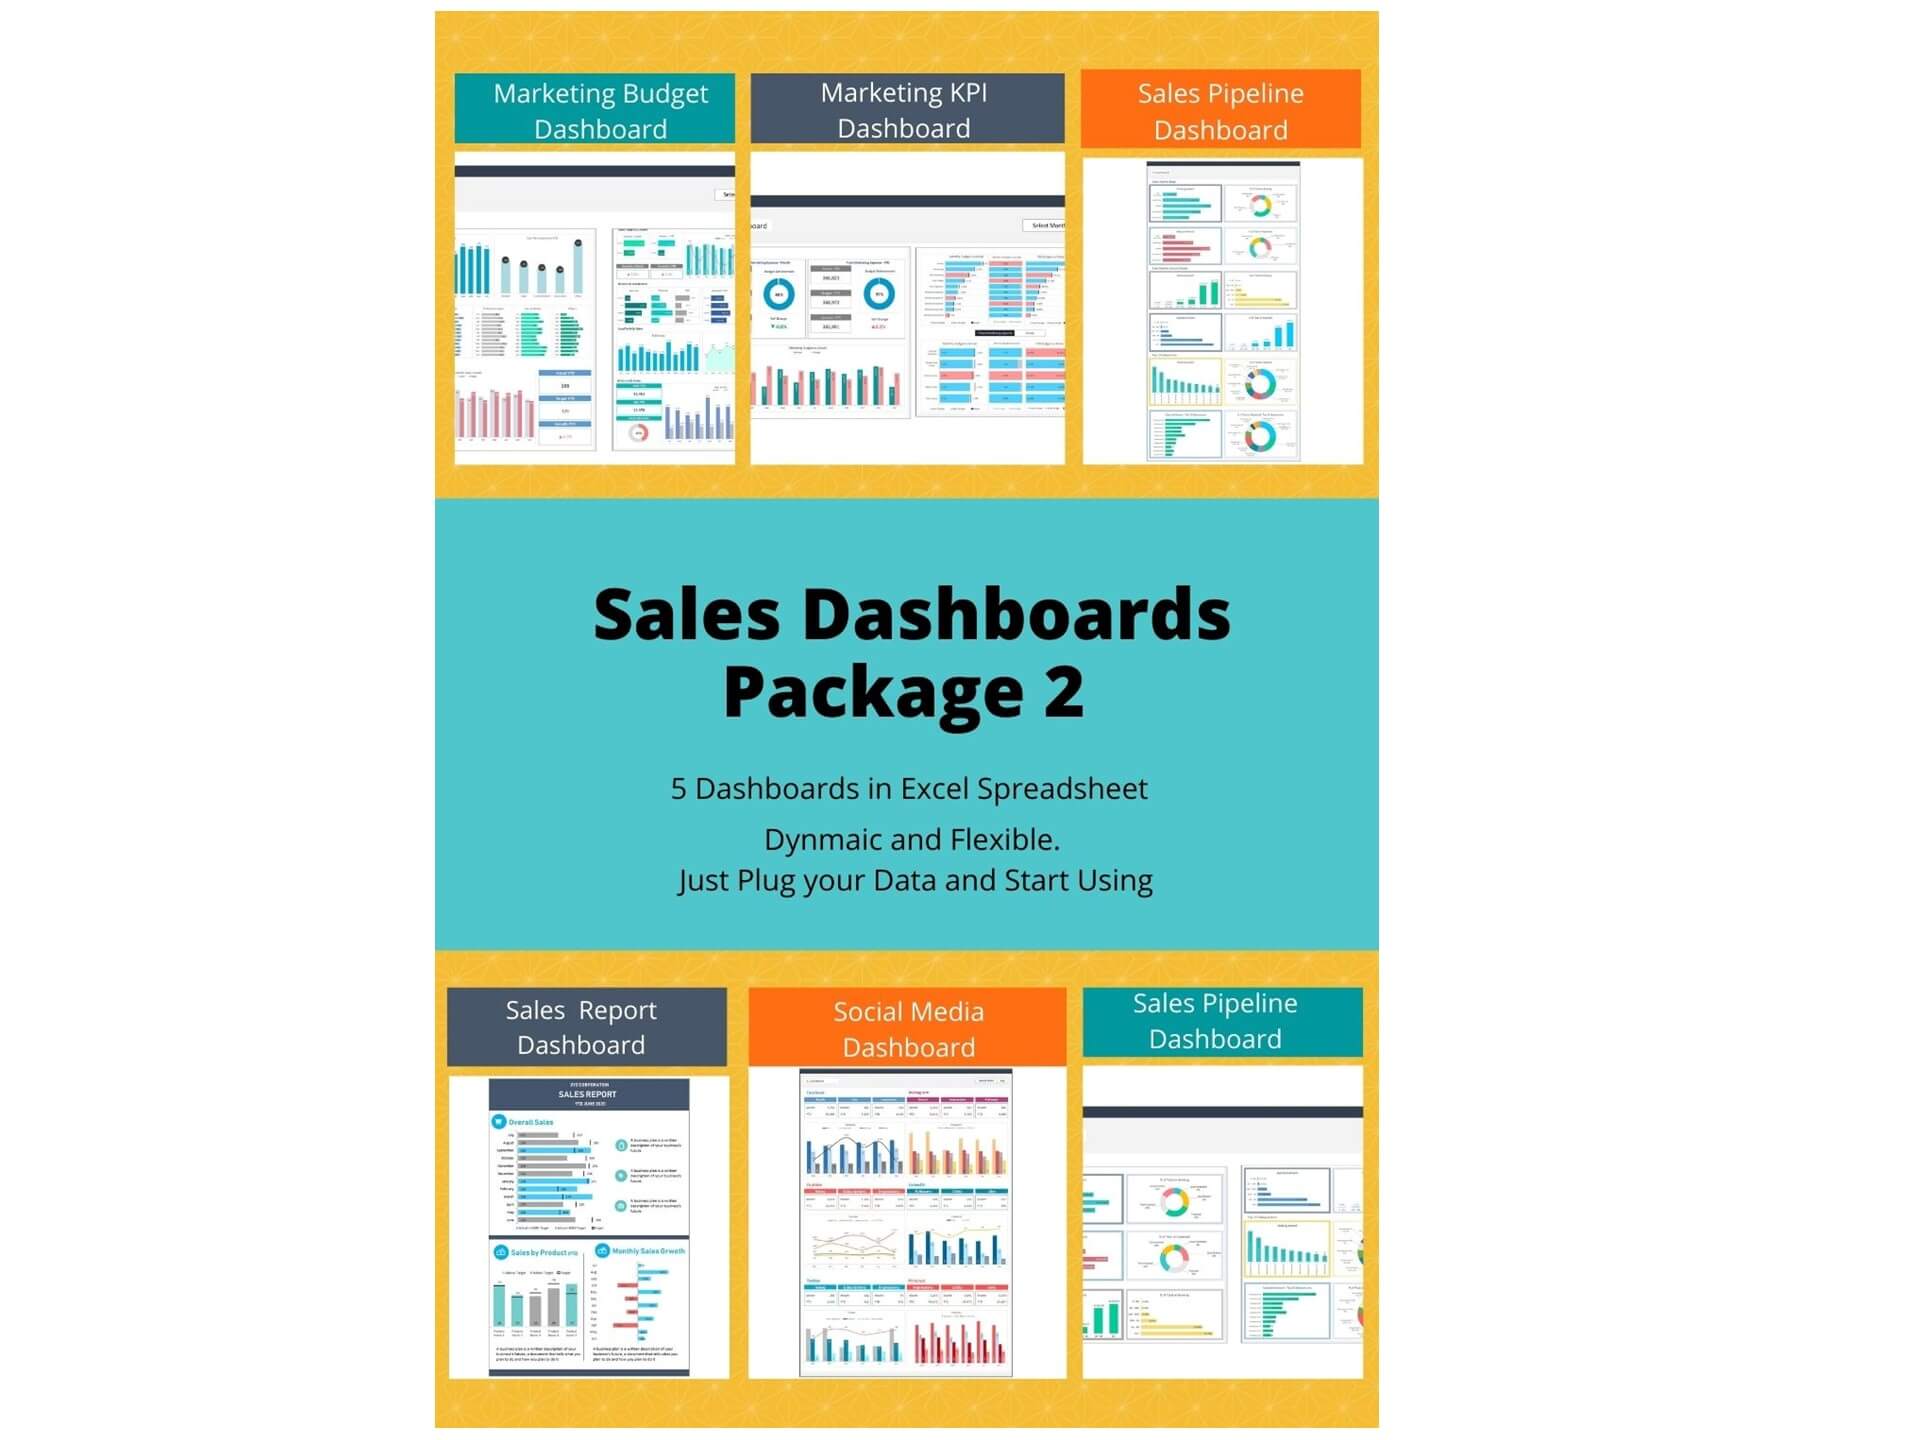
Compare Targets with Achieved Revenue with Our Sales Dashboard Templates
The Sales Budget vs Actual Dashboard Excel Template is a powerful Dashboard in Excel designed to help businesses monitor sales performance and compare planned targets with actual results. This template combines a Budget Template and Actual Template structure, allowing users to easily track sales goals, revenue performance, and budget variances.
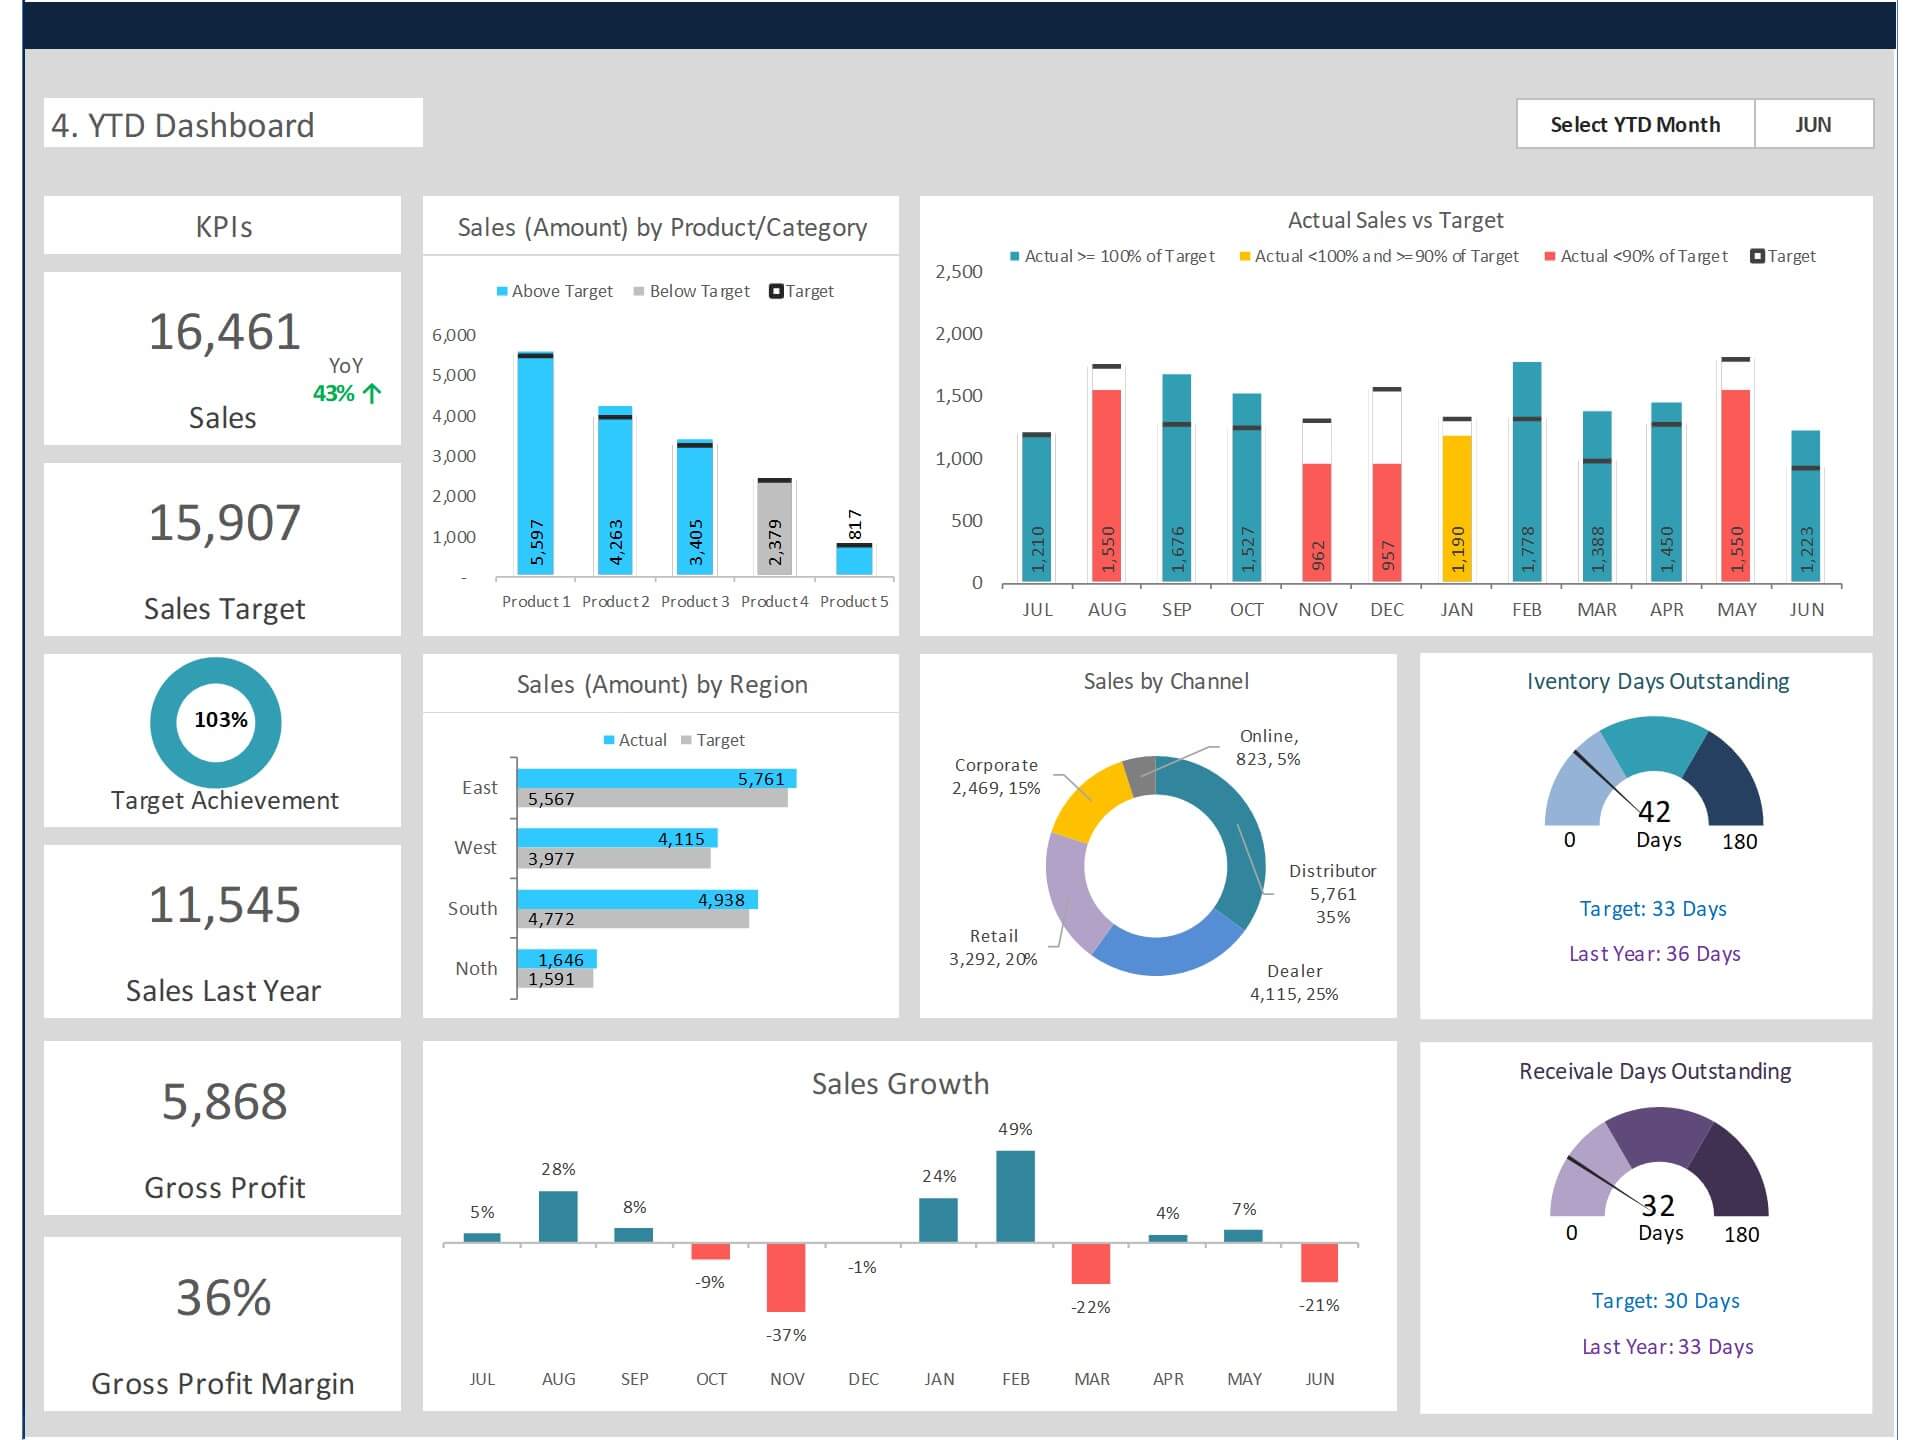
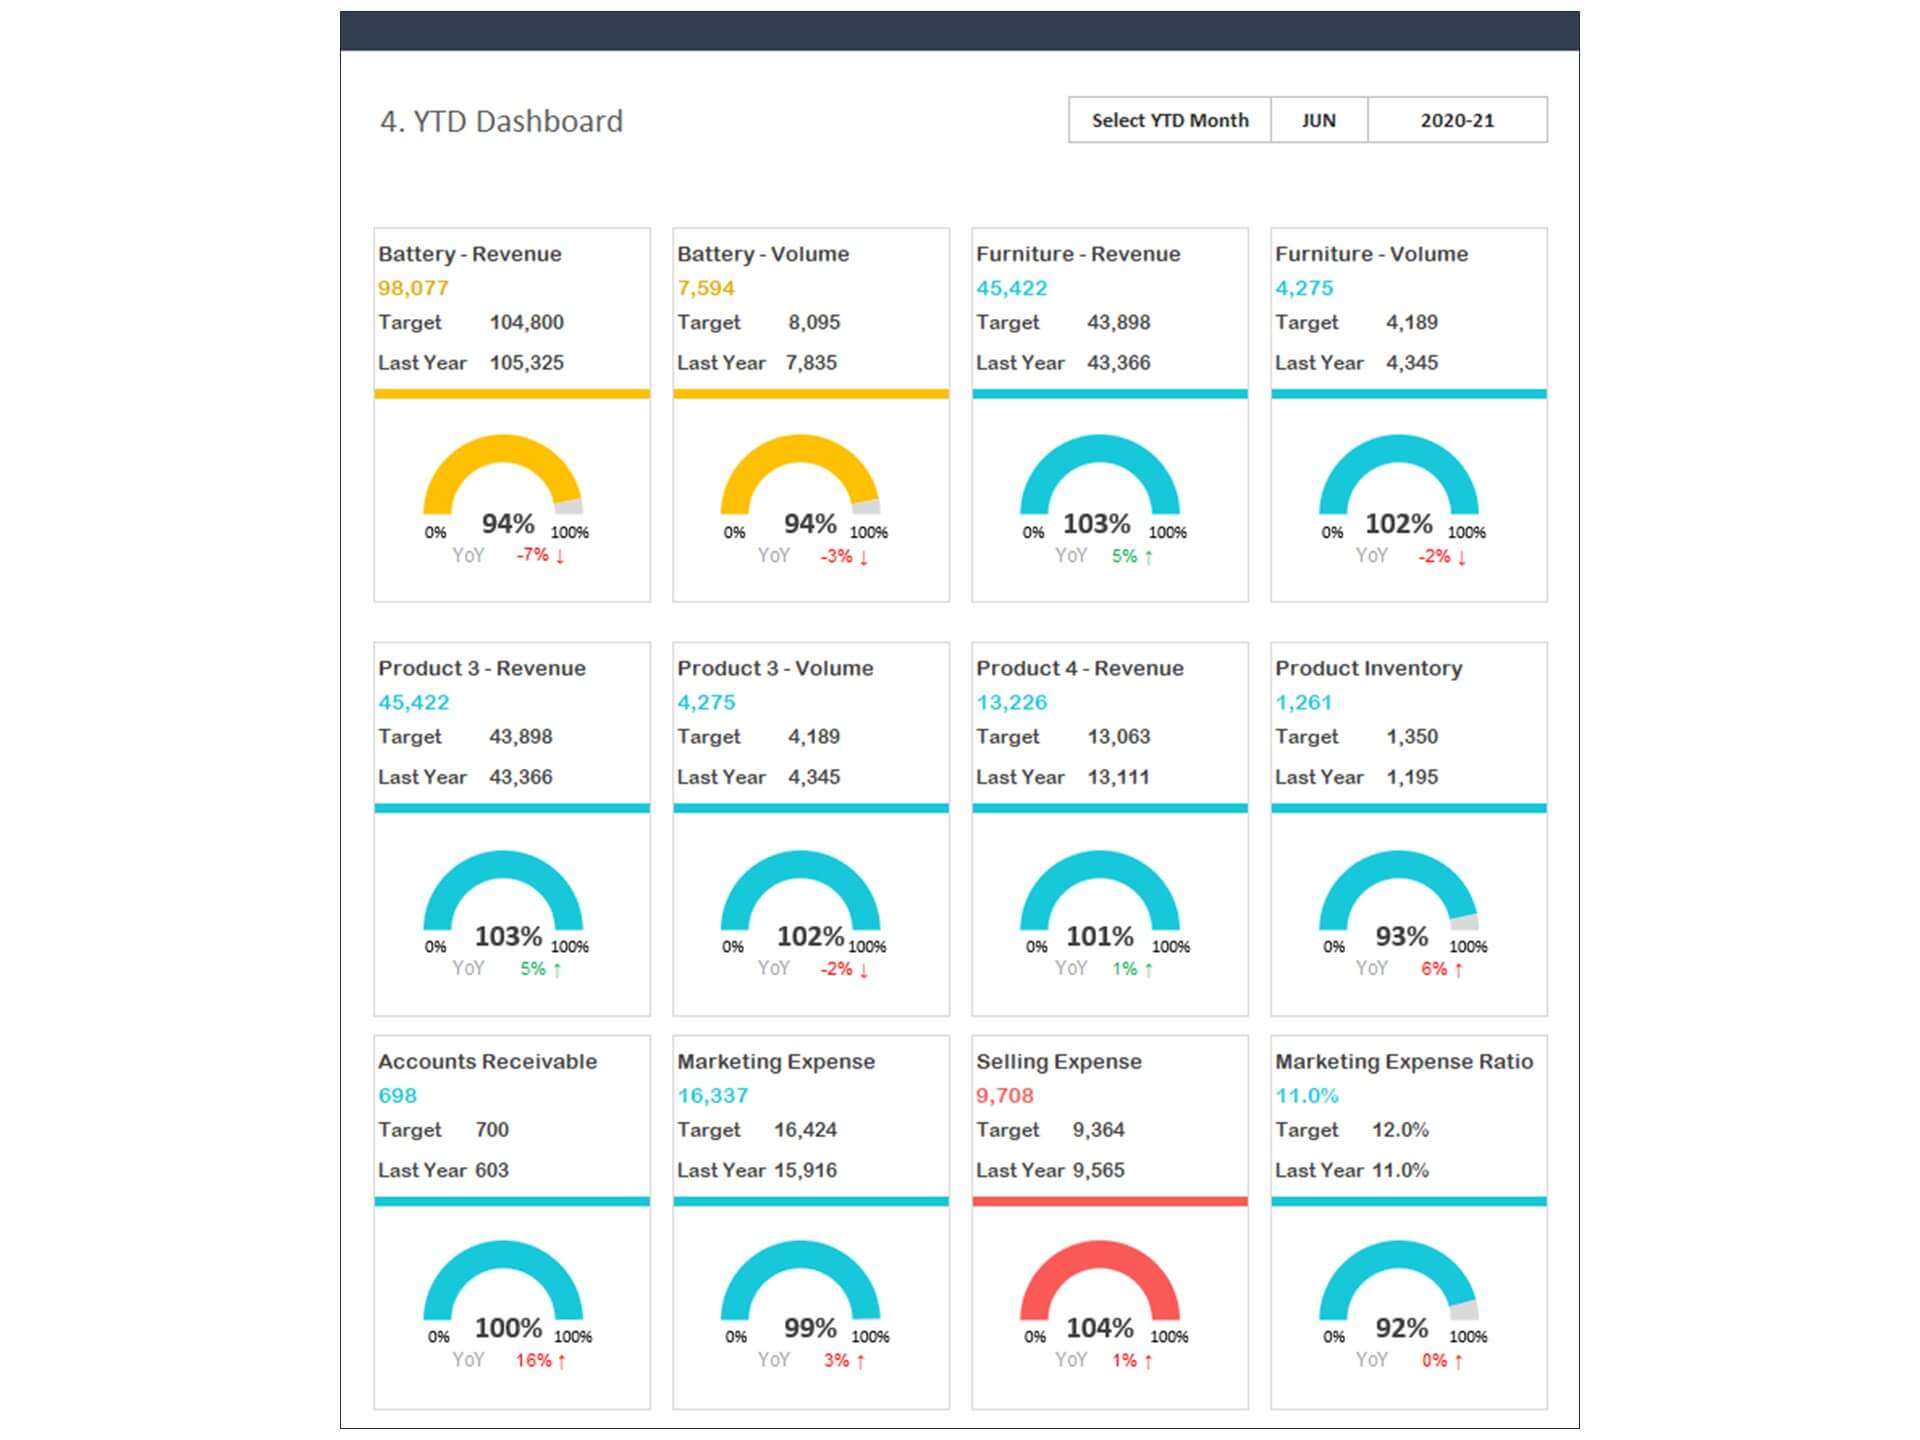
The Sales Dashboard provides a clear visual summary of sales results by product, region, or time period. Managers can quickly identify areas where performance meets or falls short of expectations. As a Sales KPI Dashboard, it highlights key performance indicators such as sales growth, target achievement percentage, and revenue trends.
This Dynamic Dashboard automatically updates charts and summaries as new data is entered, ensuring accurate and up-to-date reporting. Businesses can use the dashboard to analyze budget variances, evaluate sales strategies, and improve forecasting accuracy.
Sales Budget vs Actual Dashboard Template Excel helps to enhance the analytical efforts related to actual and budget of revenue of your organization. Major KPIs and metrics covered in sales budget vs actual dashboard are:
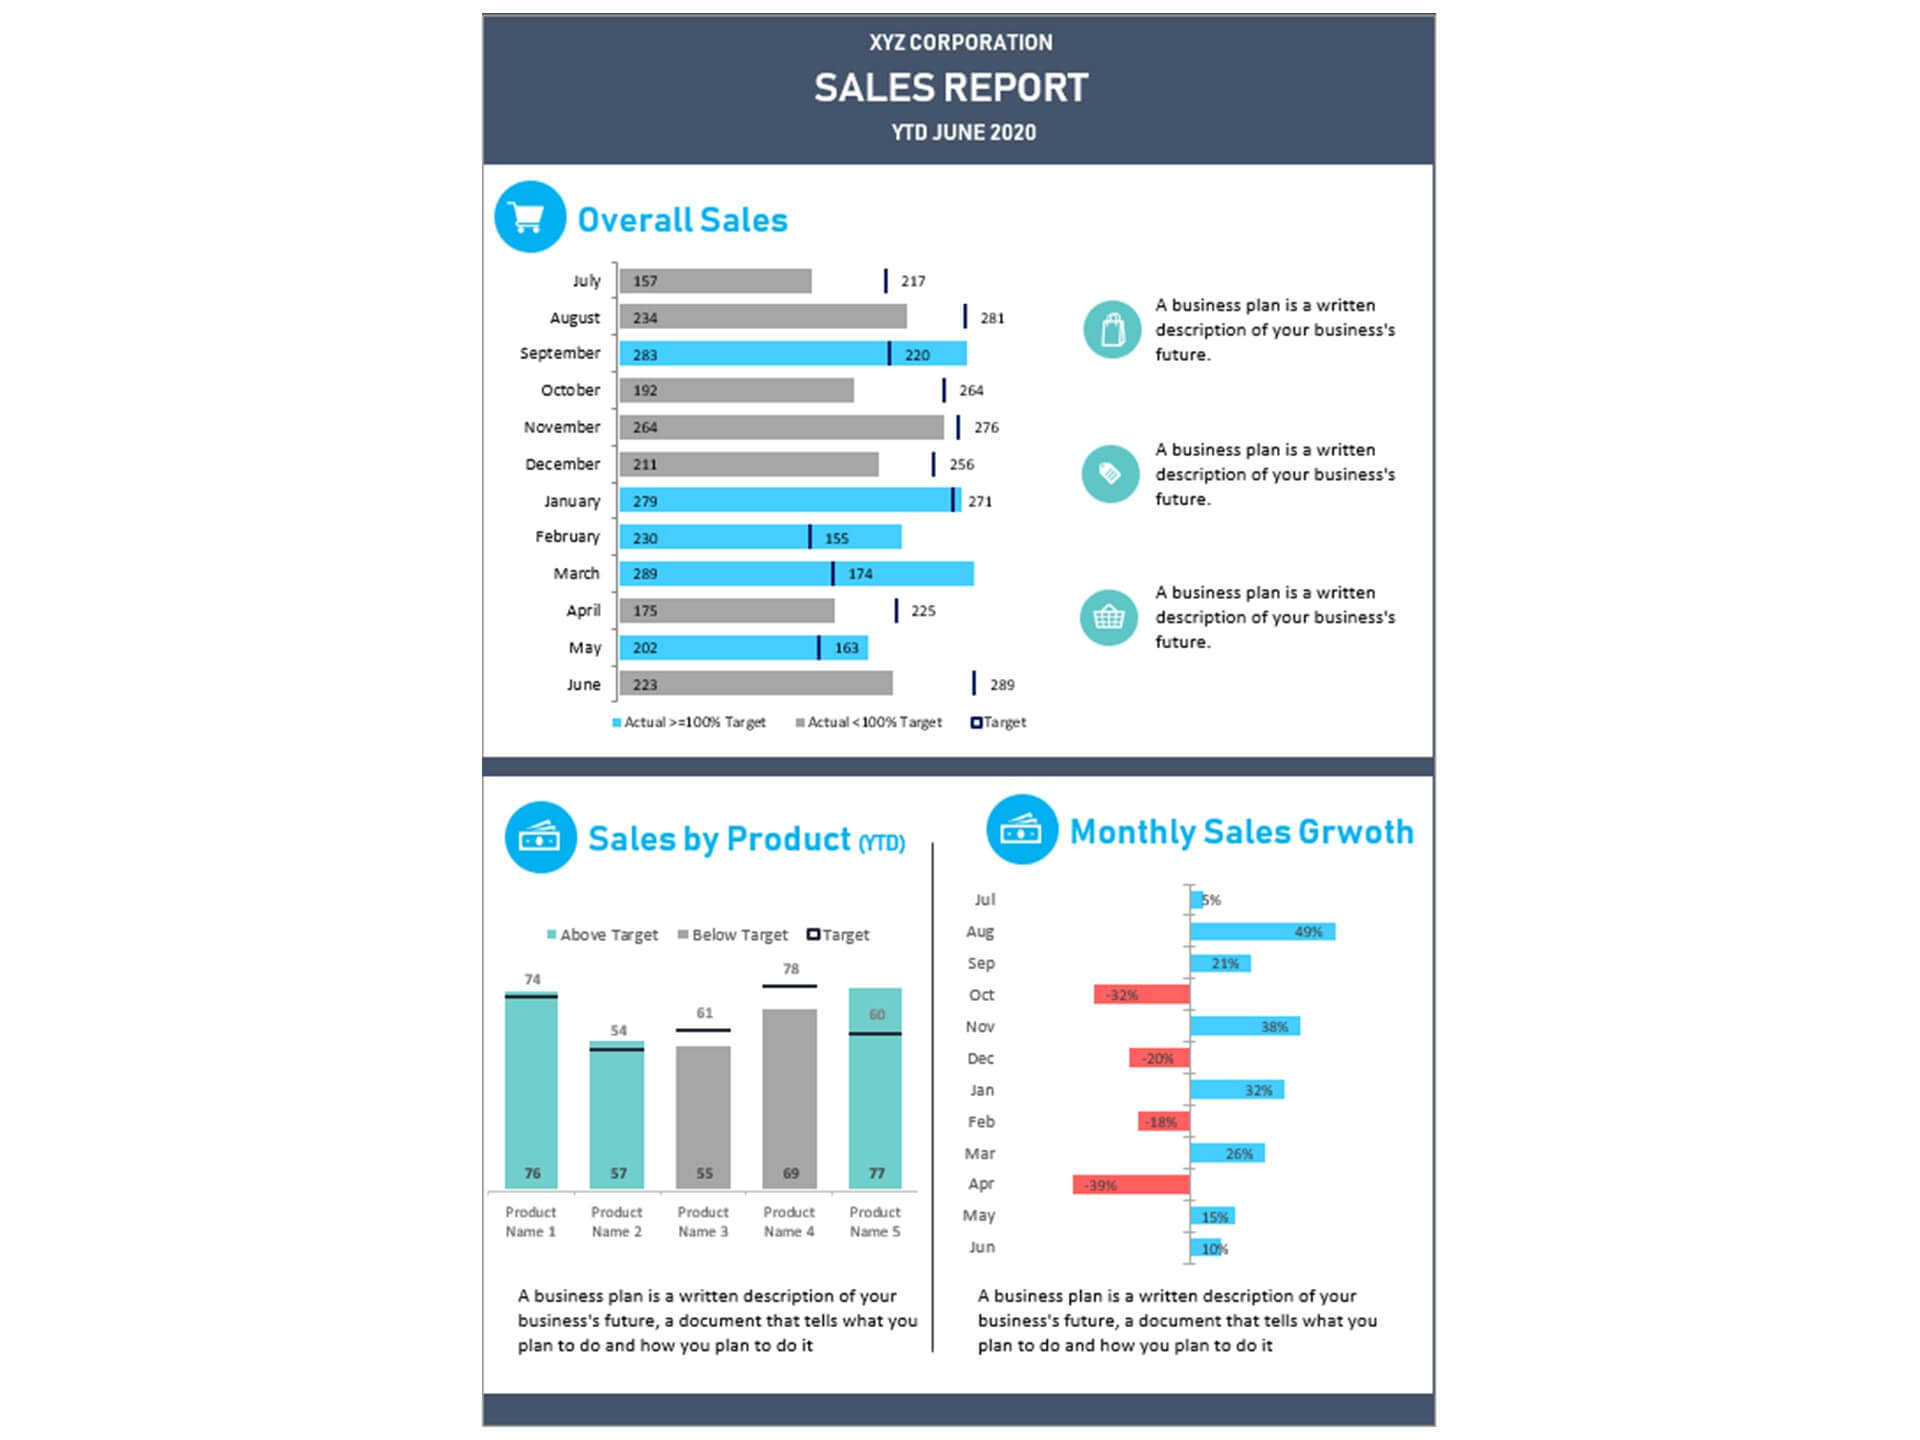
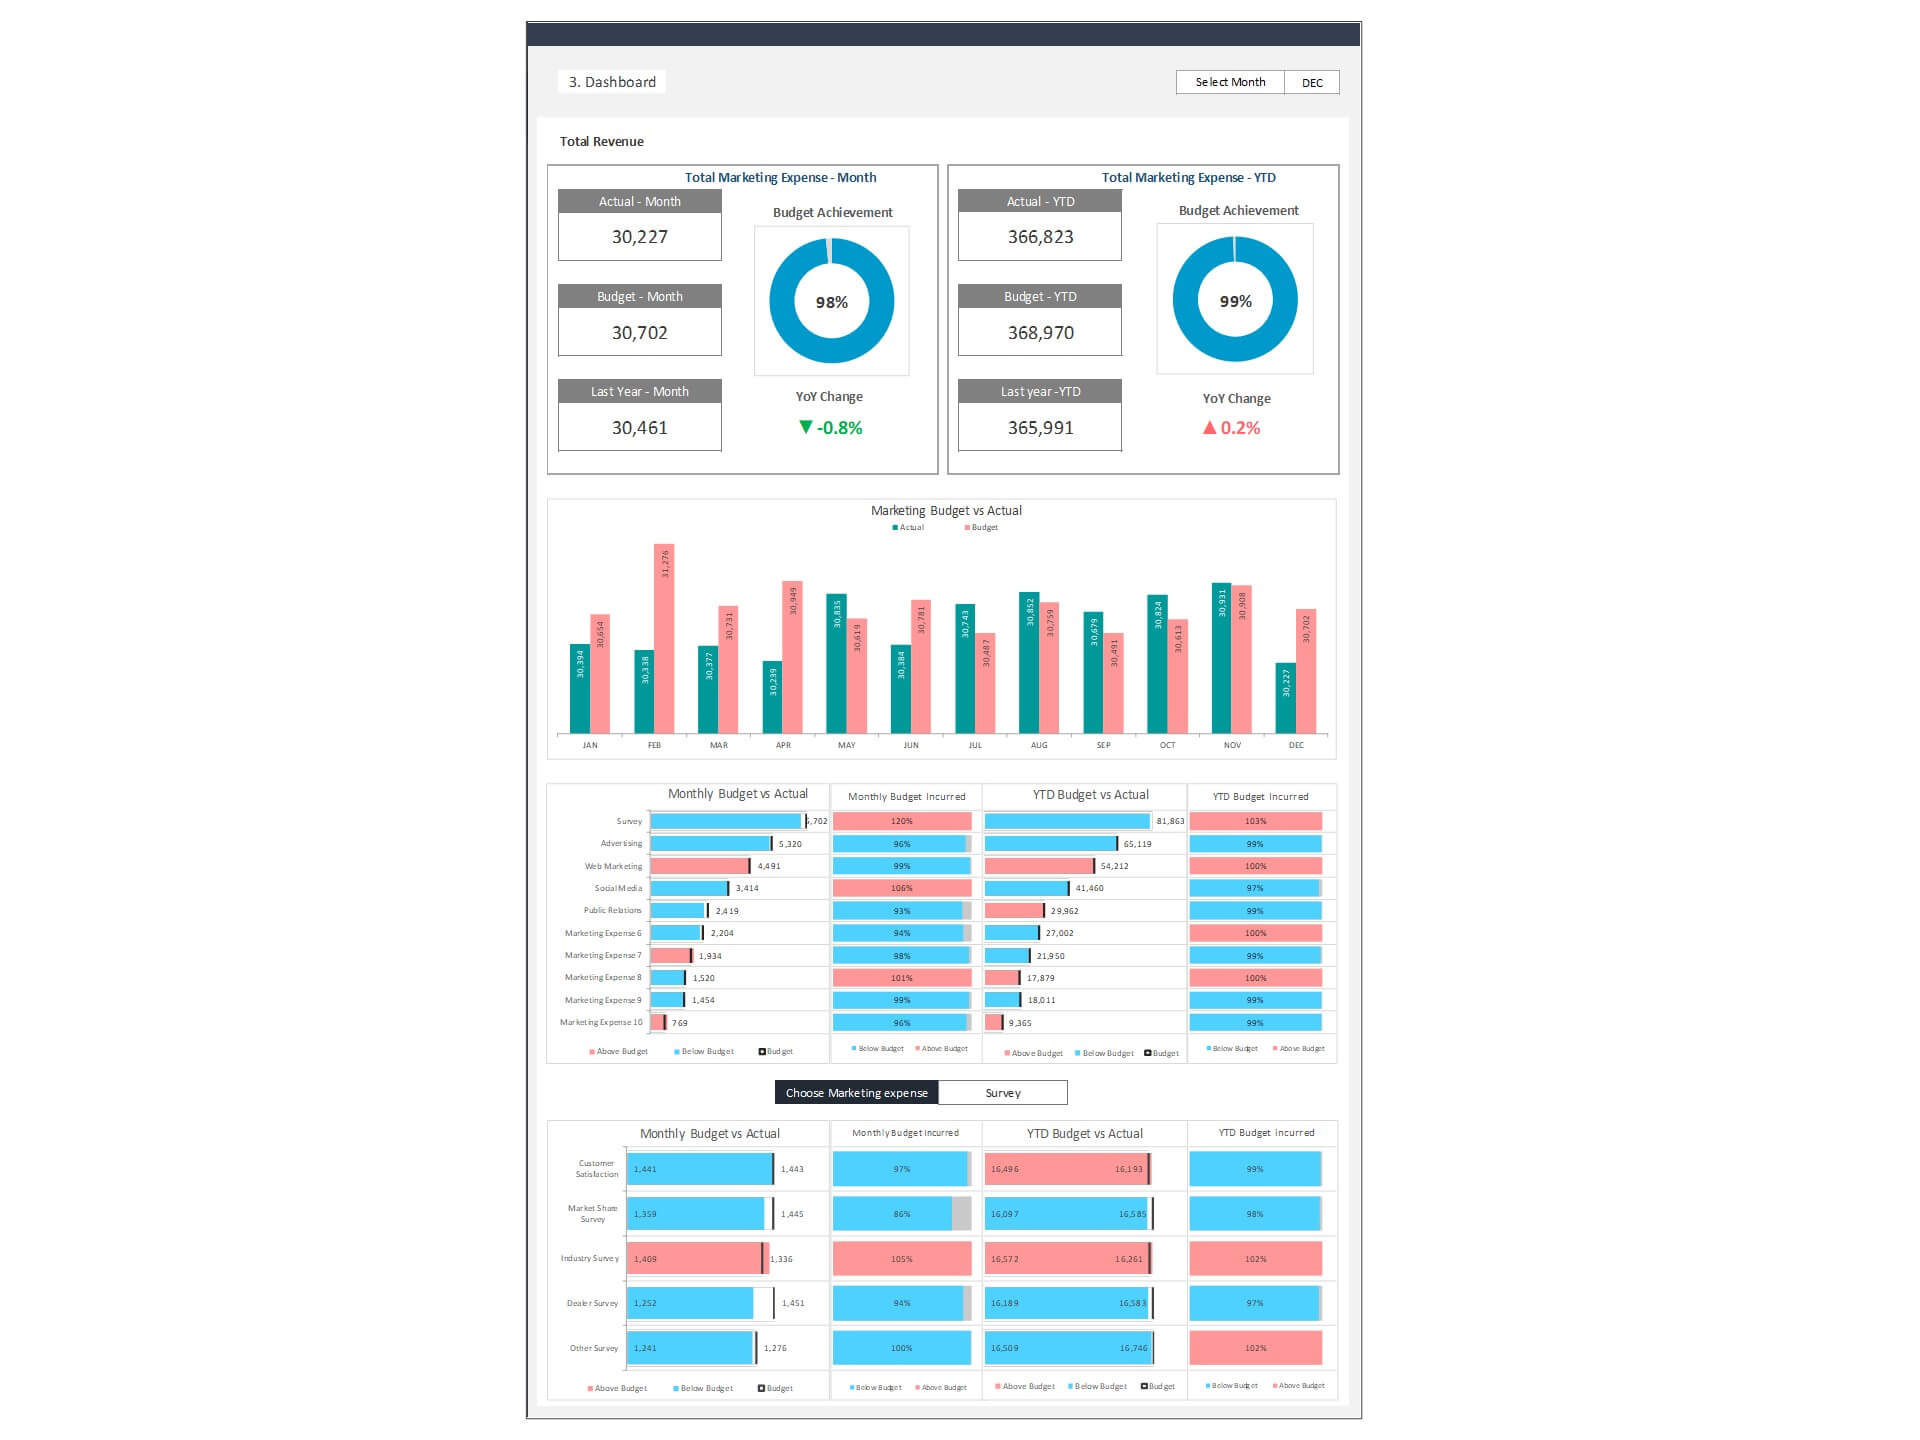
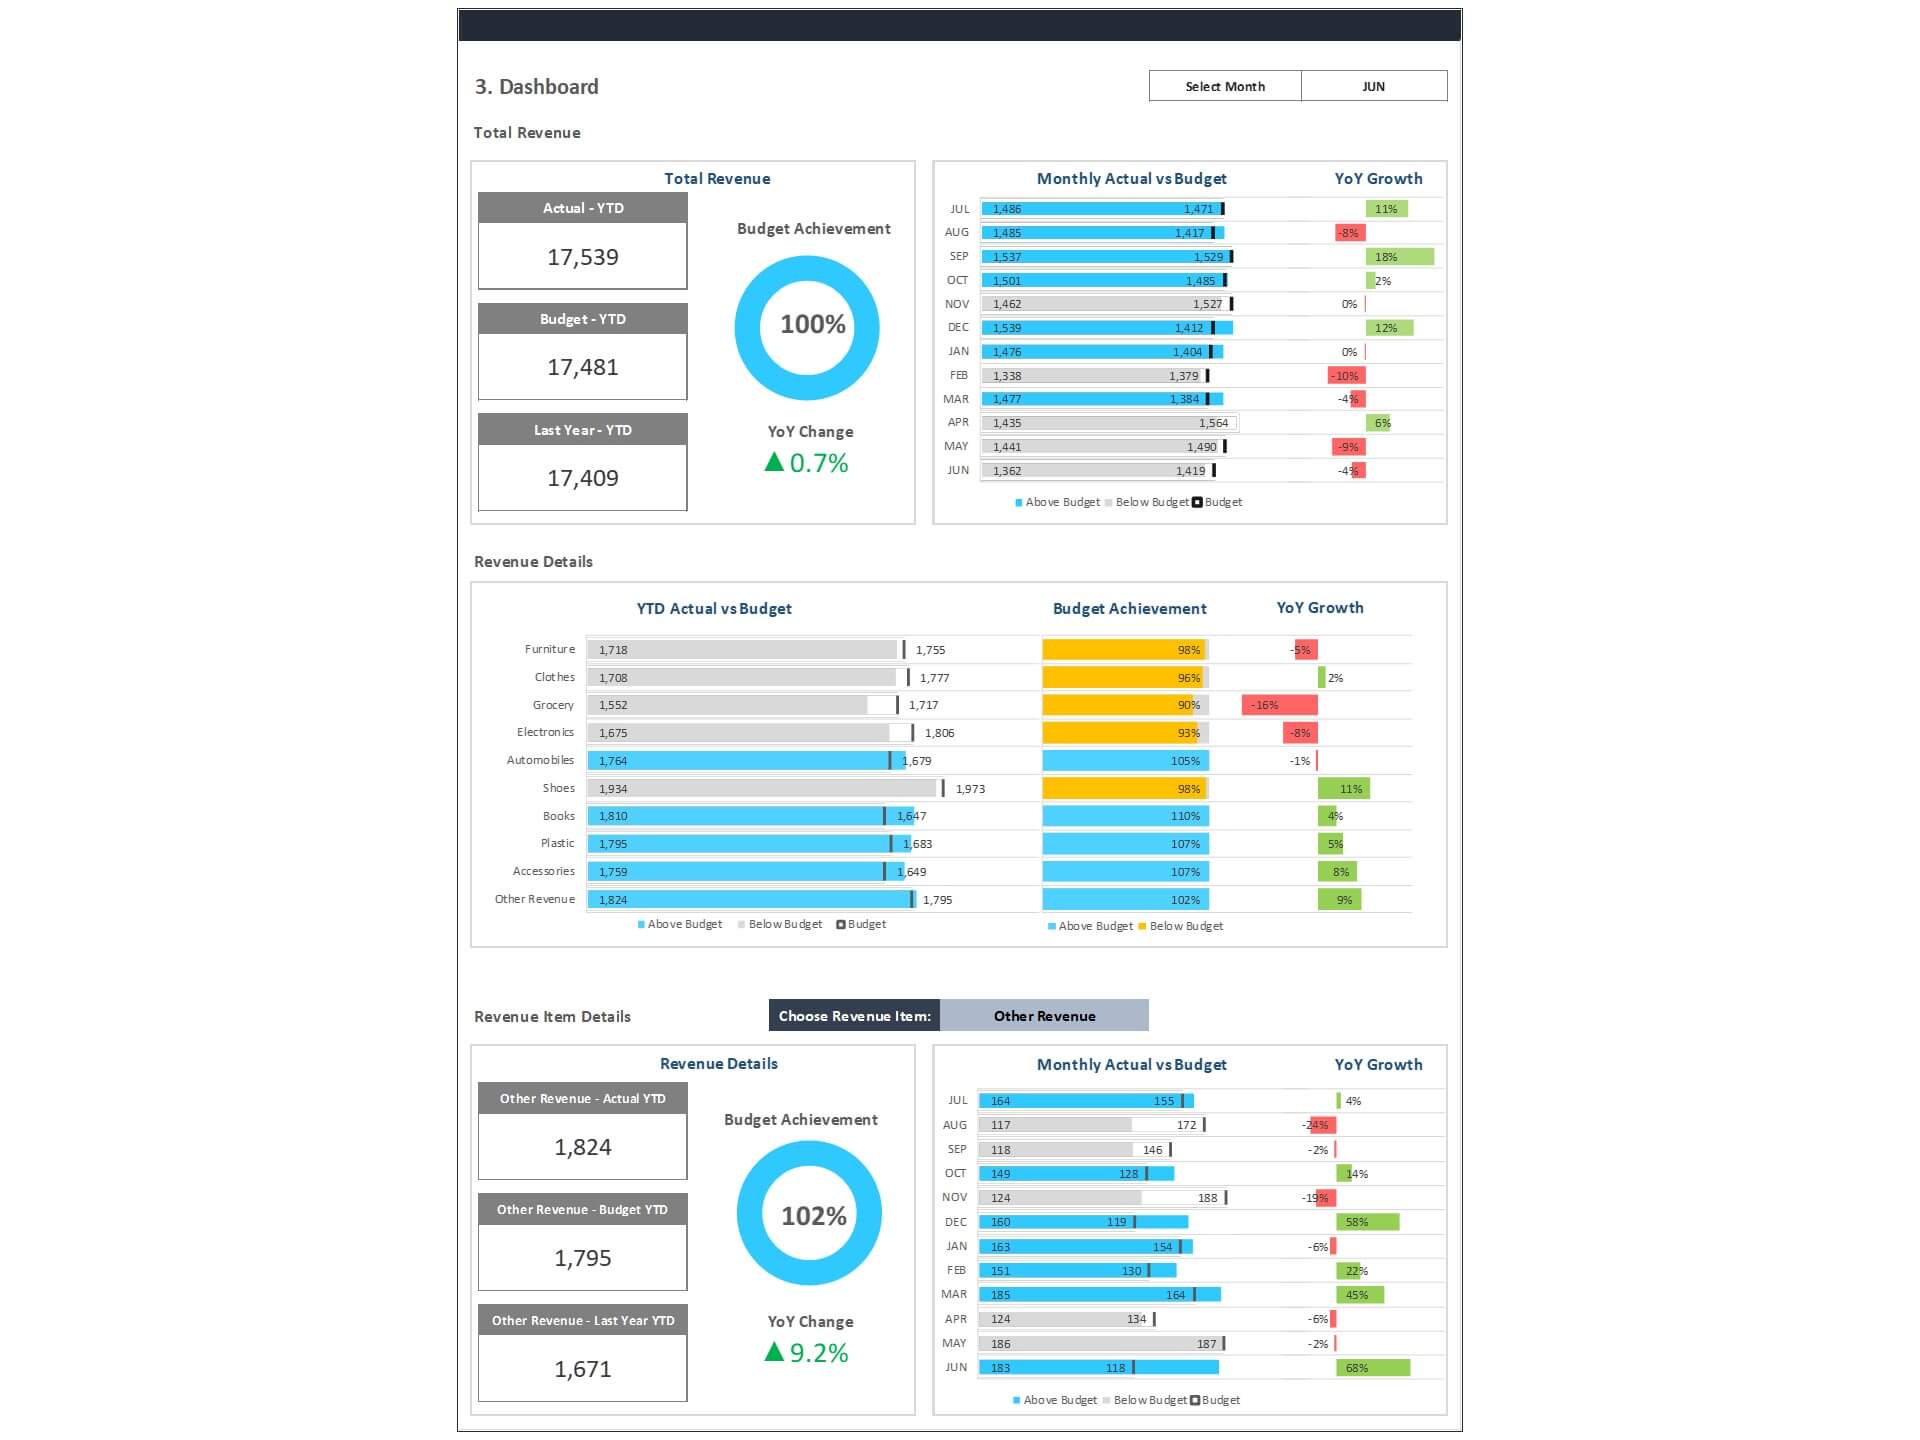
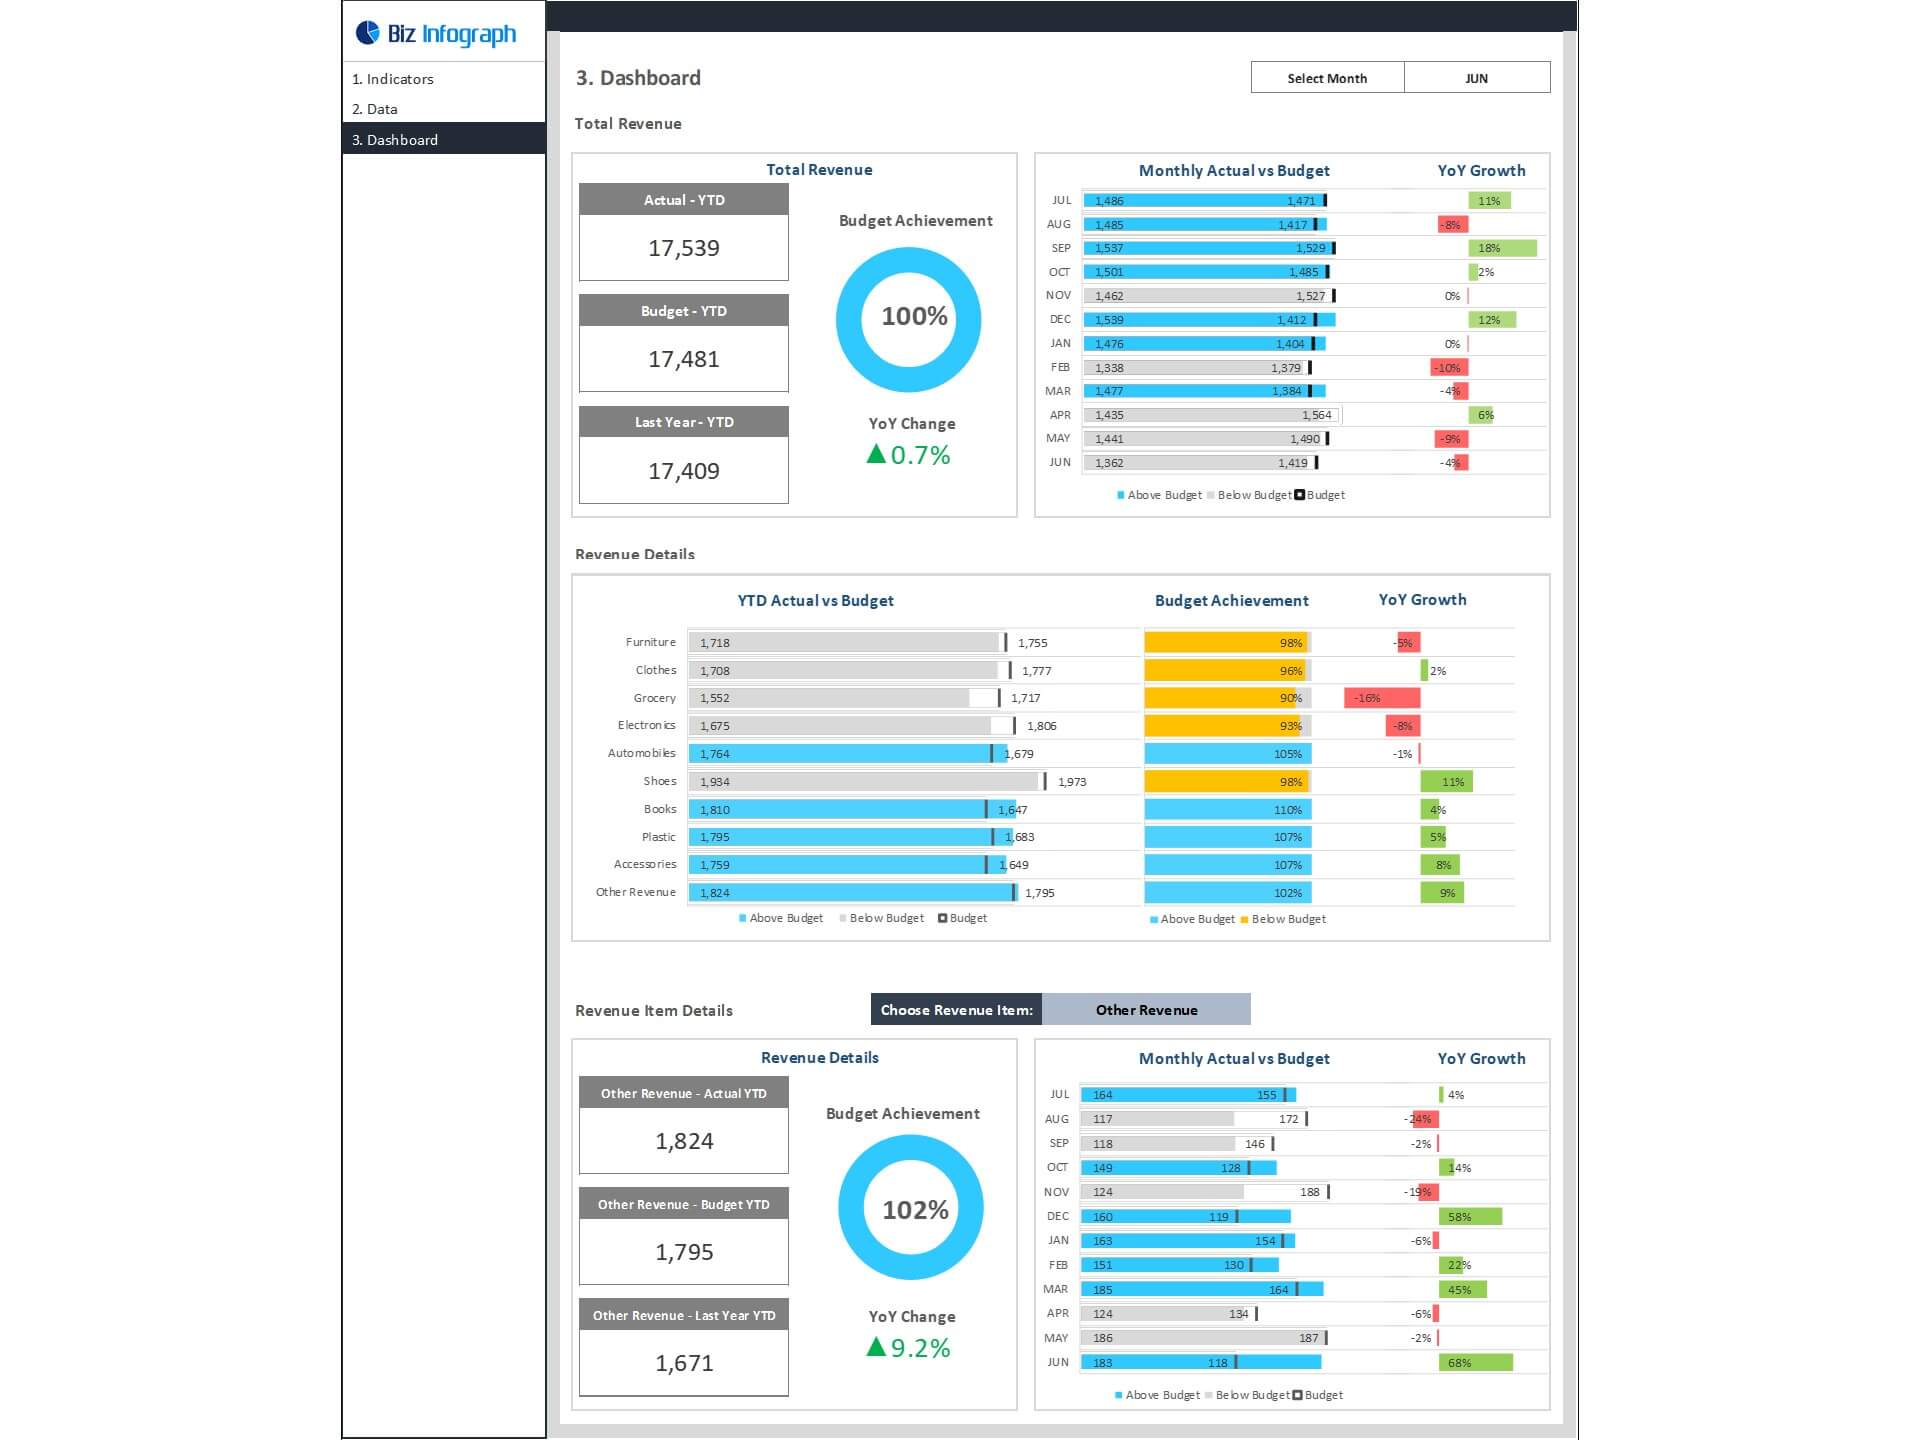
- Total Revenue: year-to-date total revenue in comparison with a budget and last year, monthly actual revenue achievement vs budget and year-over-year growth
- Revenue detail: the actual achievement of each revenue line item against budget and year-over-year growth
- Revenue line item detail: details of each individual revenue item detail with total year-to-date actual in comparison with a budget and last year. Monthly actual achievement over budget and year-over-year growth
Key Features of Dashboard Template:
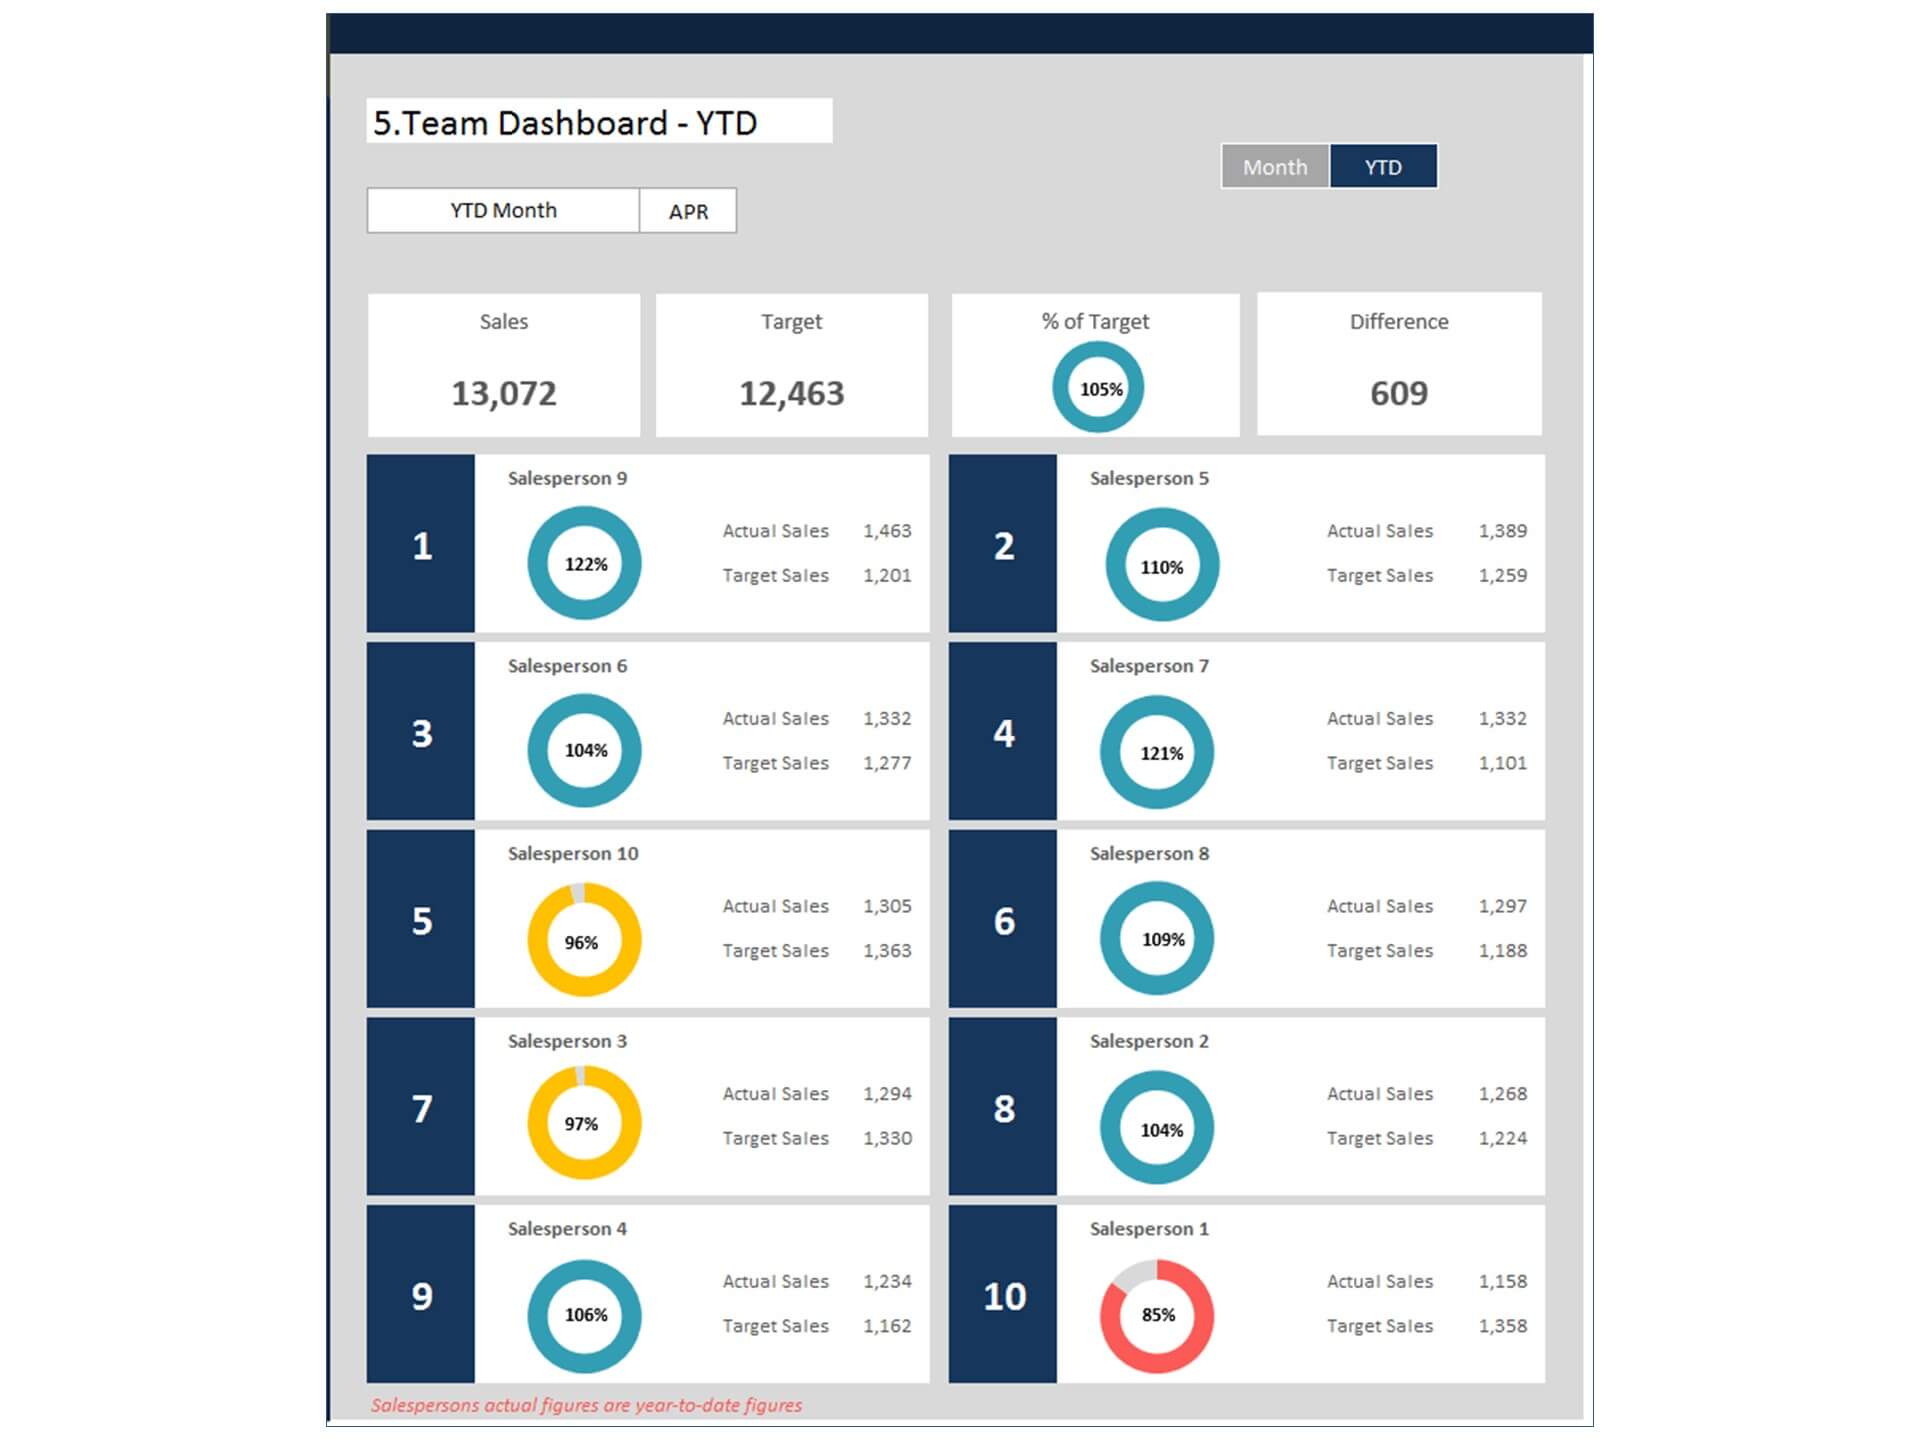
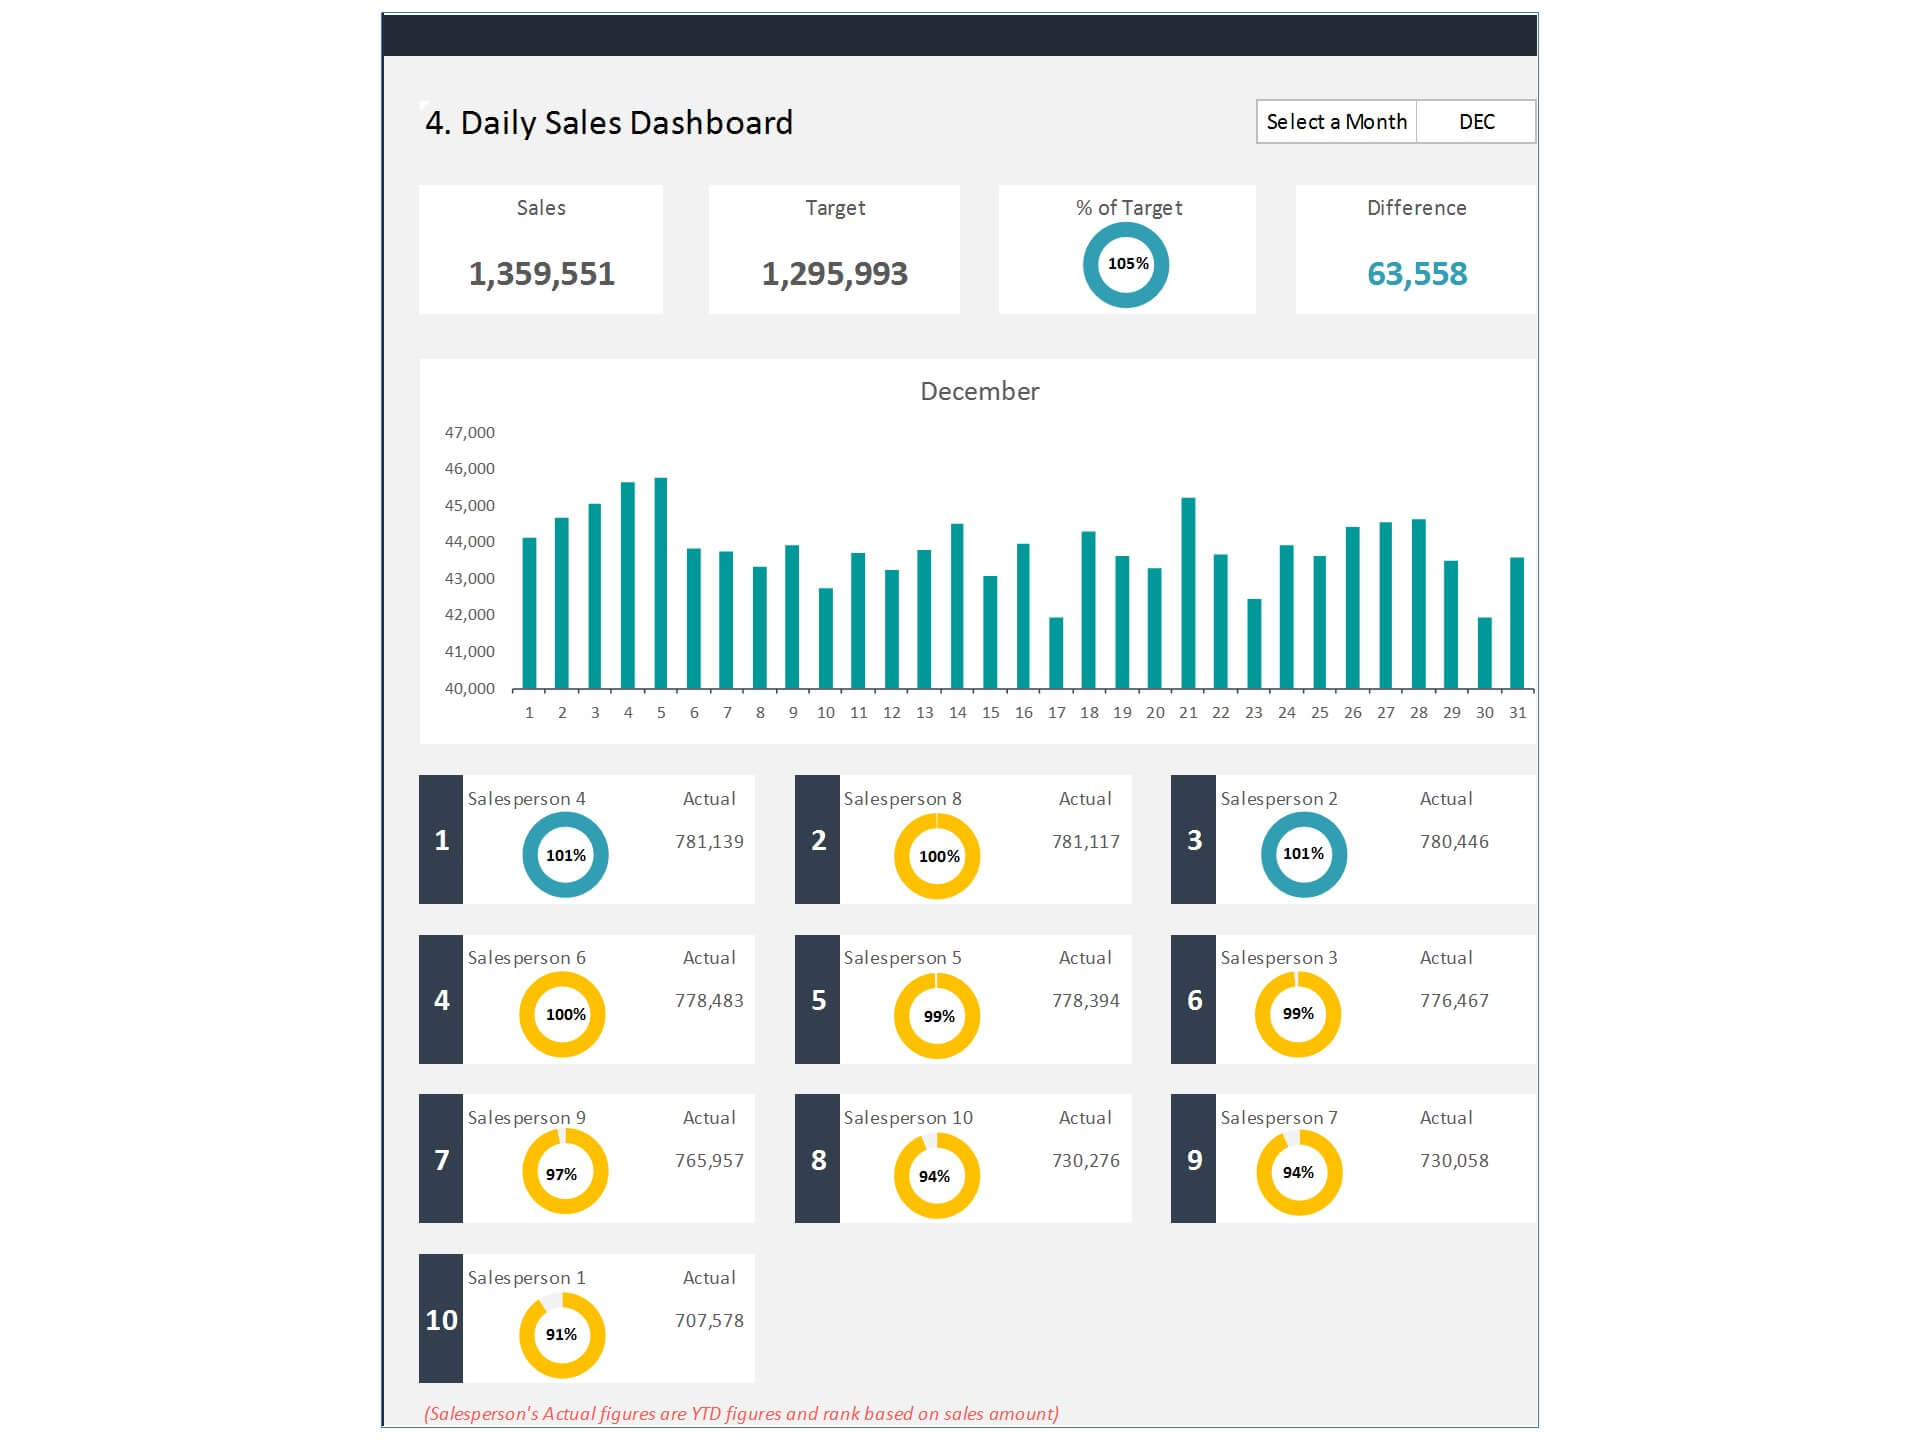
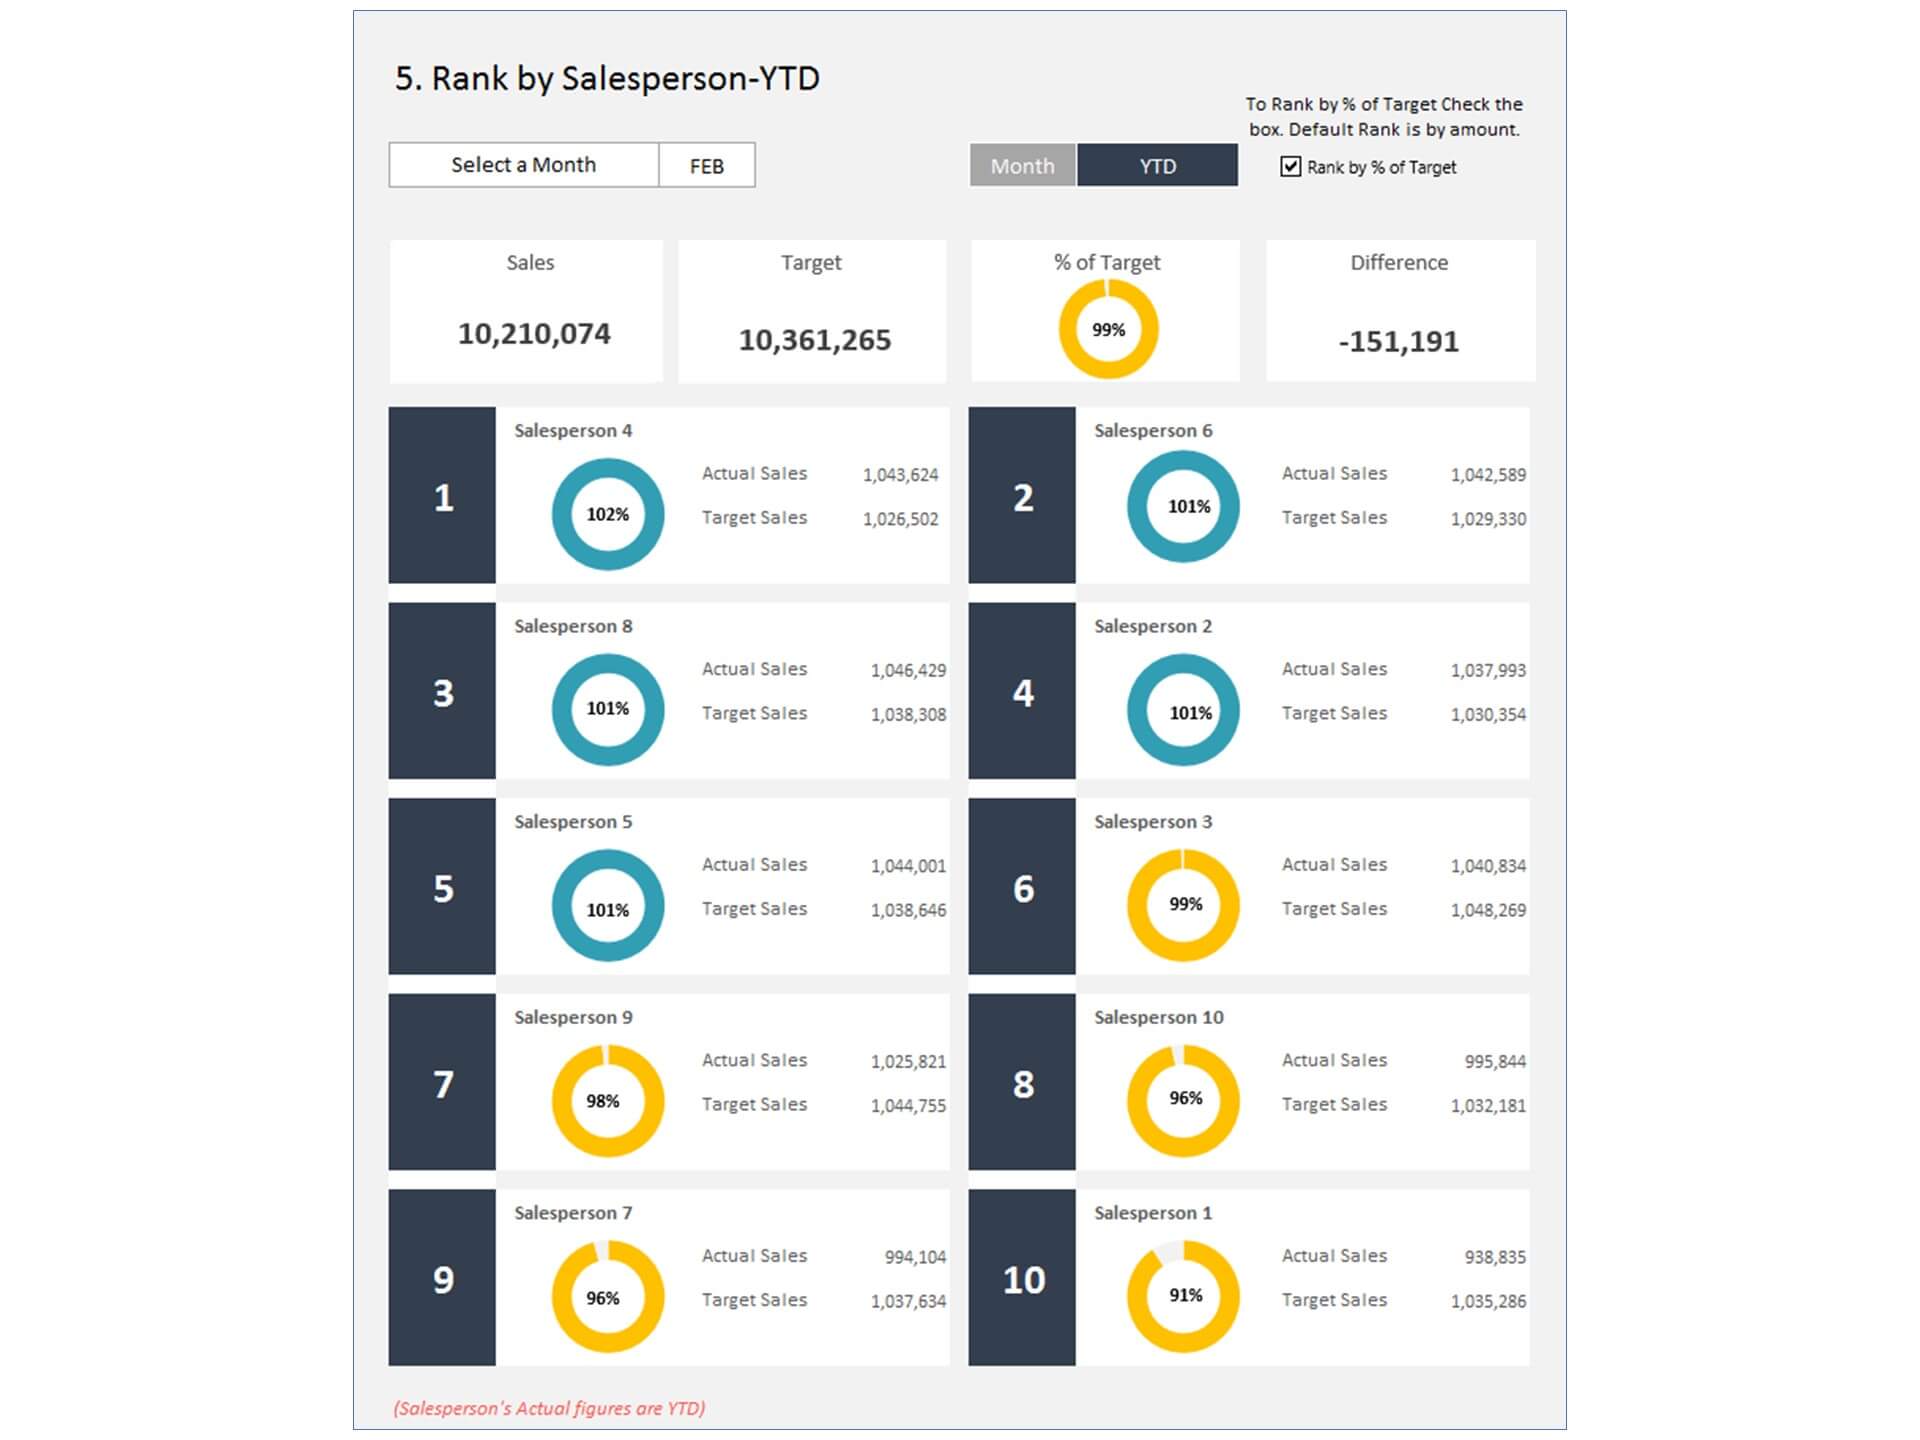
- Provides key financial insights for the Head of Sales and sales team with details of actual and budget comparison of revenue total, revenue line item details
- Fully editable, easy to use, template with sample data
- Eye-catching design and customizable
- Change the sample data with your data
- Spreadsheets ready for printing without Biz Infograph logo
- Consolidate key financial performance indicators in one dashboard
- No monthly fees
- Immediate download
- No VBA, no Macro
- No installation necessary
- Professionally designed
What is included in this dashboard template?
- Just plug your data, the dashboard will be ready instantly and start using.
- A text file which contains a password to view and edit the formula
- A guide to unlocking all the elements in the dashboard
Professional Support:
- Video tutorial guide on how to navigate and use Sales Budget vs Actual Dashboard Template
- Professional service to customize dashboard template in excel as per business need
- Help and support in post-purchase
- Payment secured by Stripe and PayPal (no PayPal account needed)
A brief guide to using the dashboard template:
- Open the dashboard template
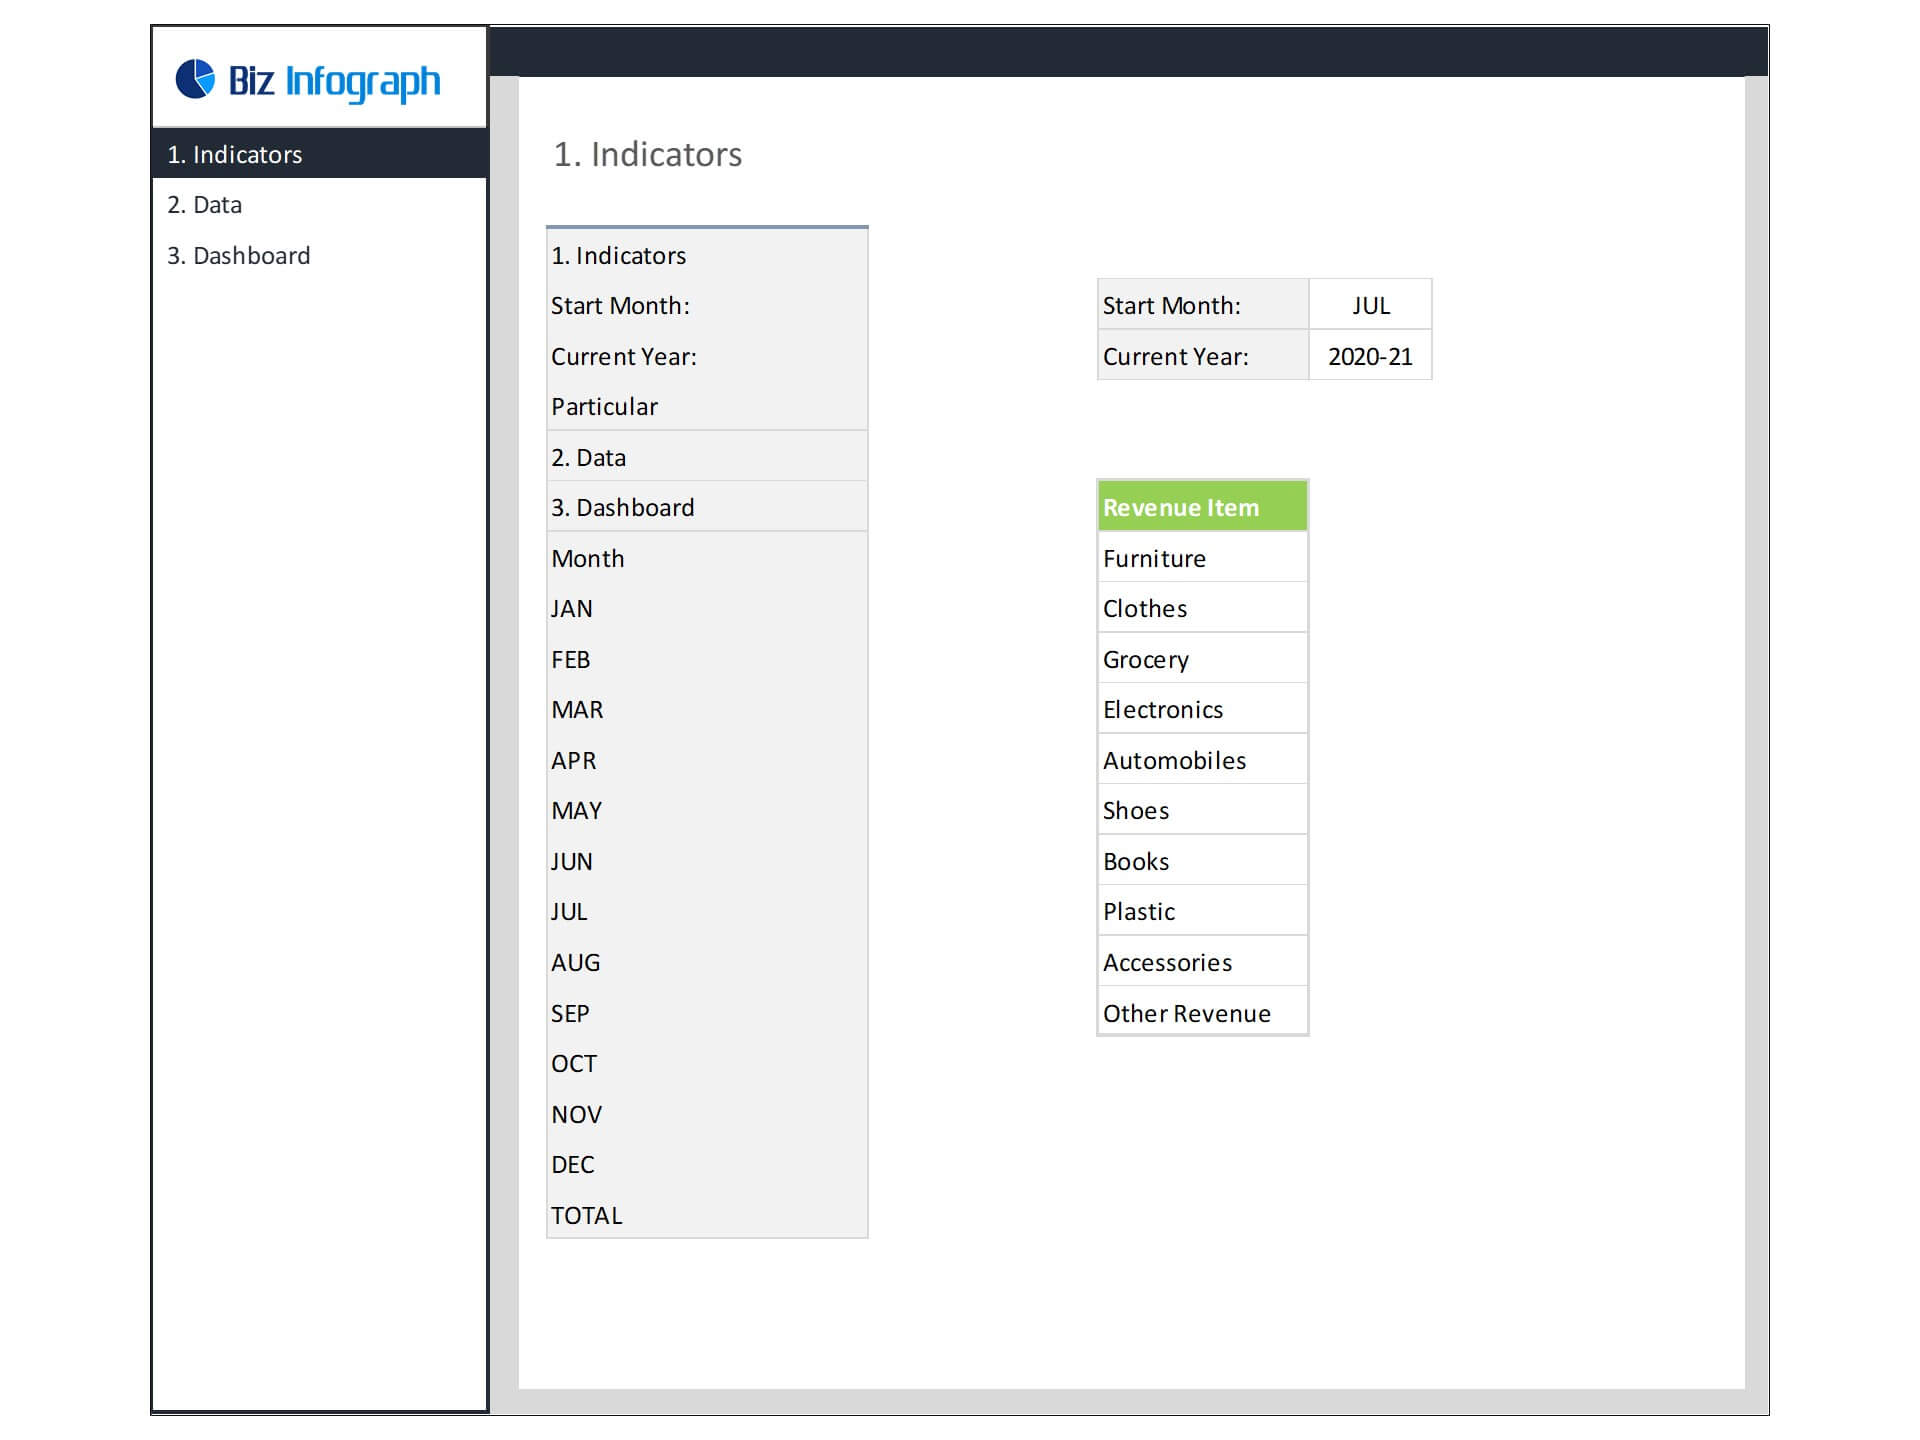
- Go to ‘Indicators’ menu – choose the start month of the fiscal year (i.e. Jan, Feb, Jul, etc.)
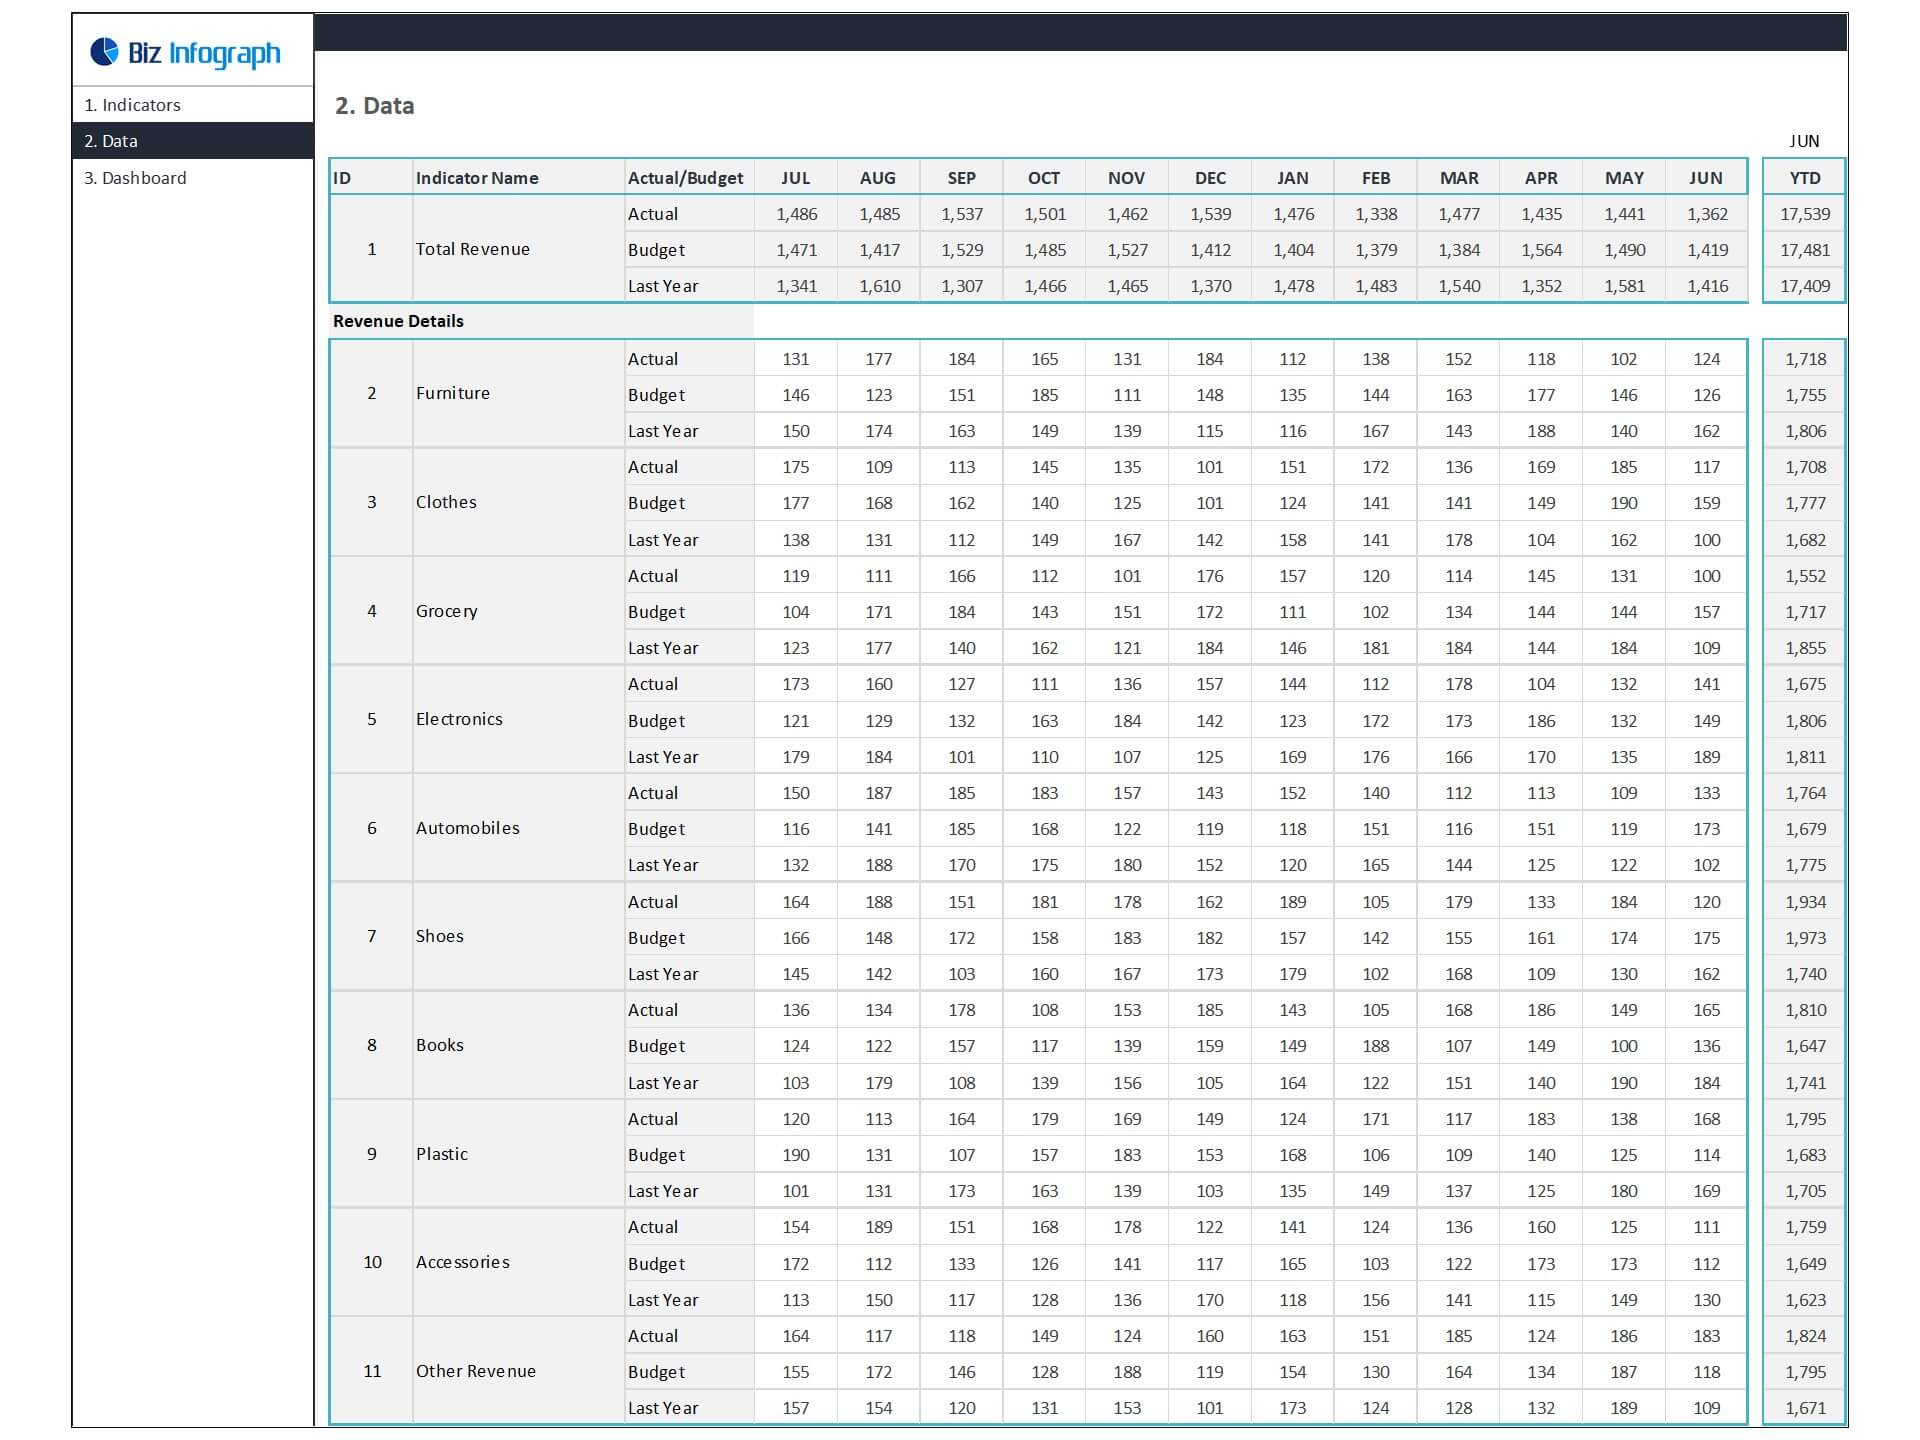
- Go to the ‘Enter Data’ menu – remove the sample data and give your actual data in the respective cells. Formula cells are locked, and you cannot edit it without a password.
- Go to the ‘Monthly Dashboard’ menu – select the month name from the drop-down to see the monthly picture of performance indicators
- Go to ‘YTD Dashboard’ menu - select month name from the drop-down to see the year-to-date picture of performance indicators
- Each page is ready for printing – just press CTRL+P
This Excel dashboard template is password-protected to avoid mistakes, such as accidentally deleting formulas. When you completed the purchase, the password will be available.
For ready-to-use Dashboard Templates: