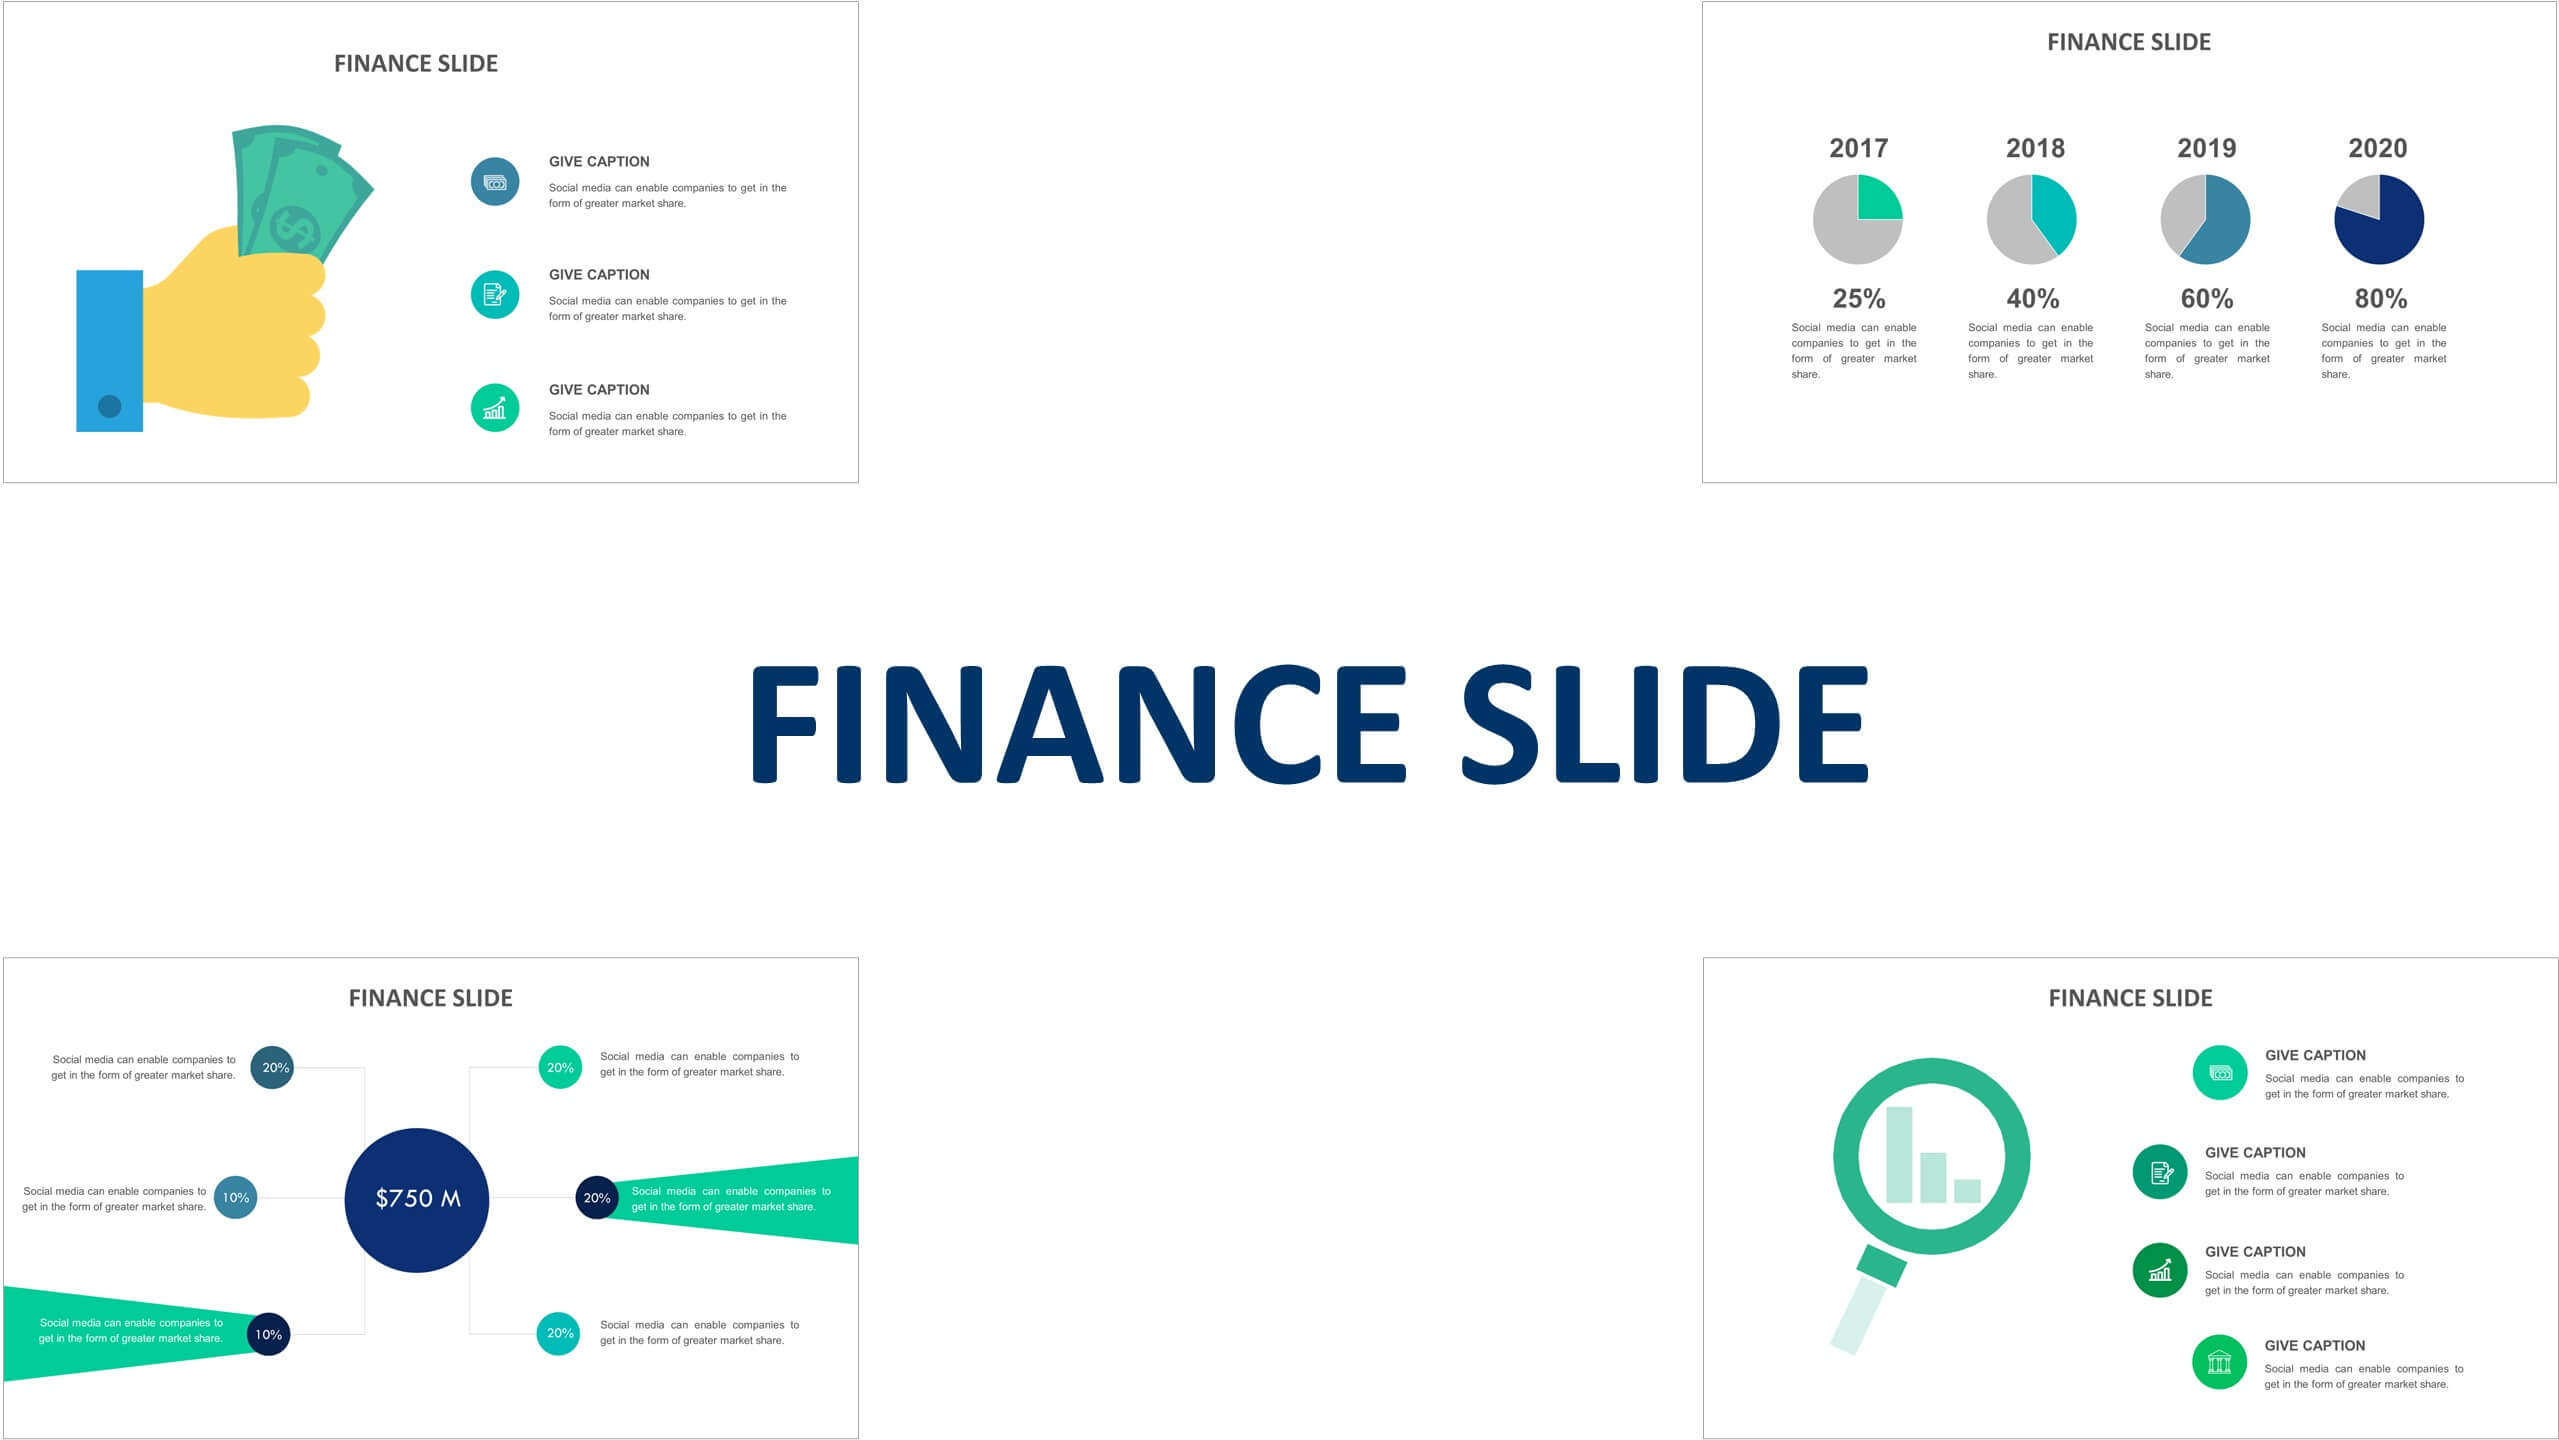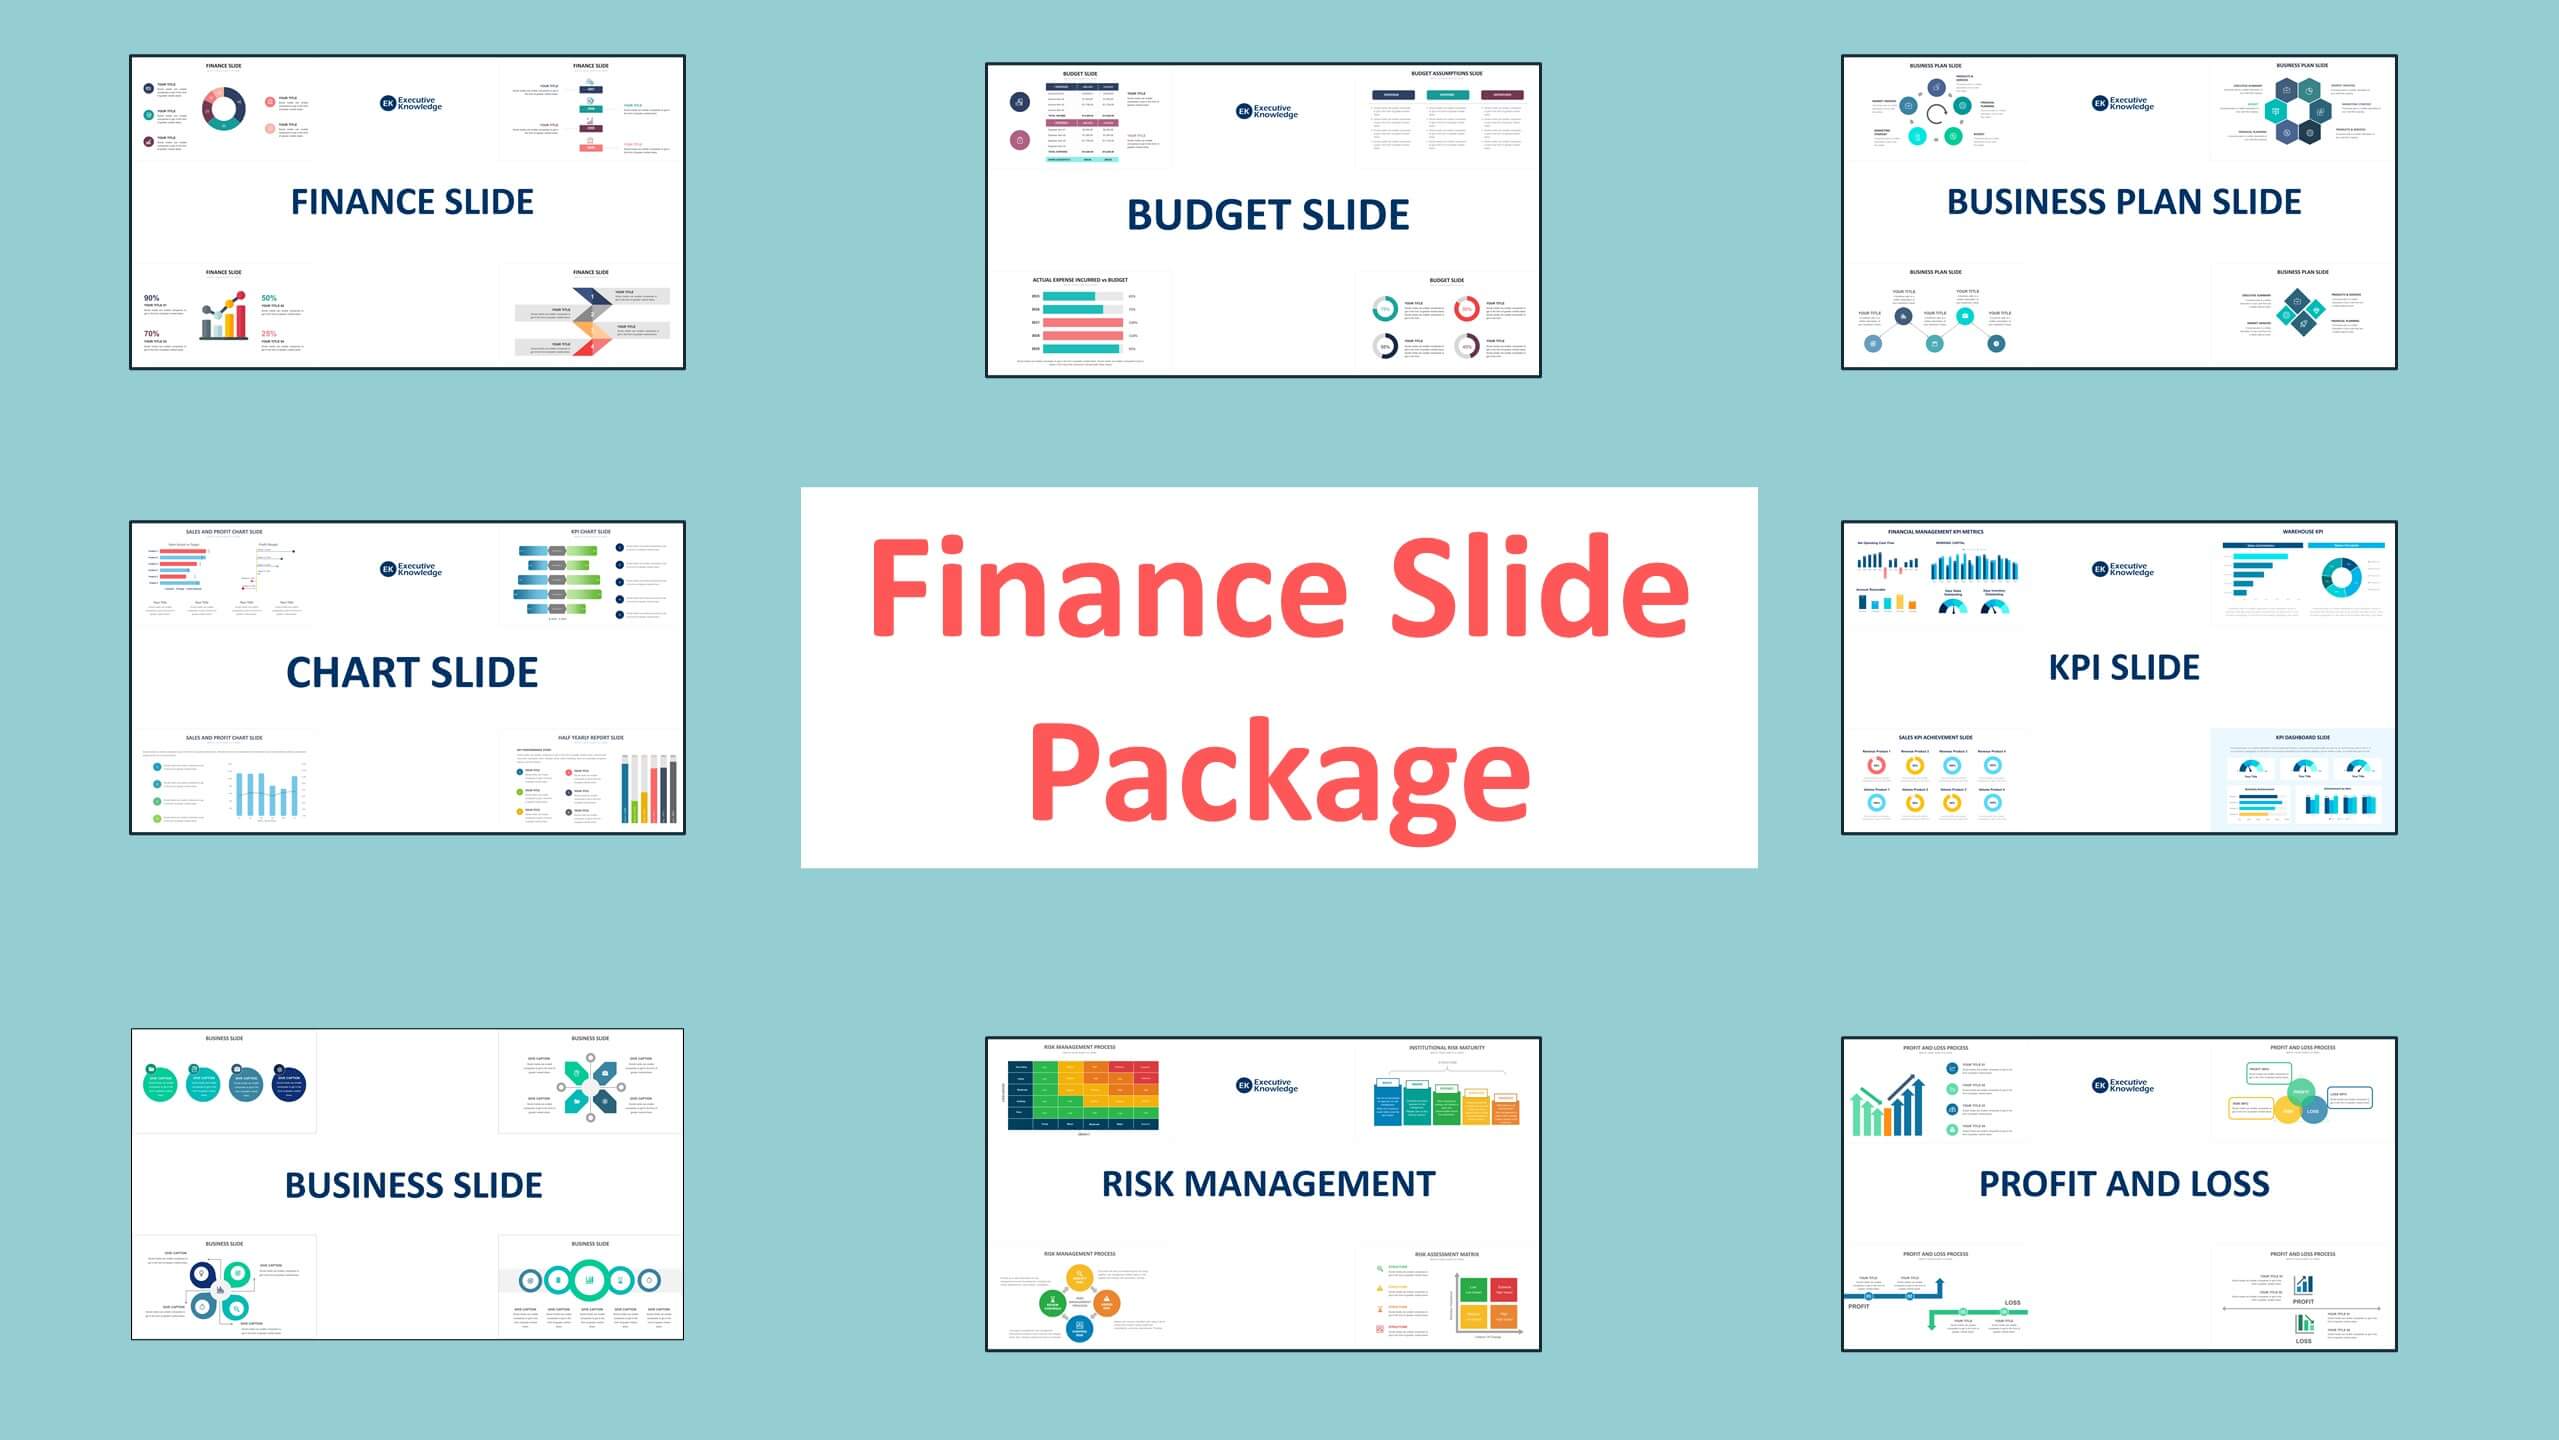


Best Chart slide templates with compatible in PowerPoint and Keynote are for creating beautiful and audience-engaging presentations. Be stand out with the right visual aids in your presentation. Biz Infograph offers a wide collection of editable and easy-to-customize charts and diagrams to help you with your next presentation.
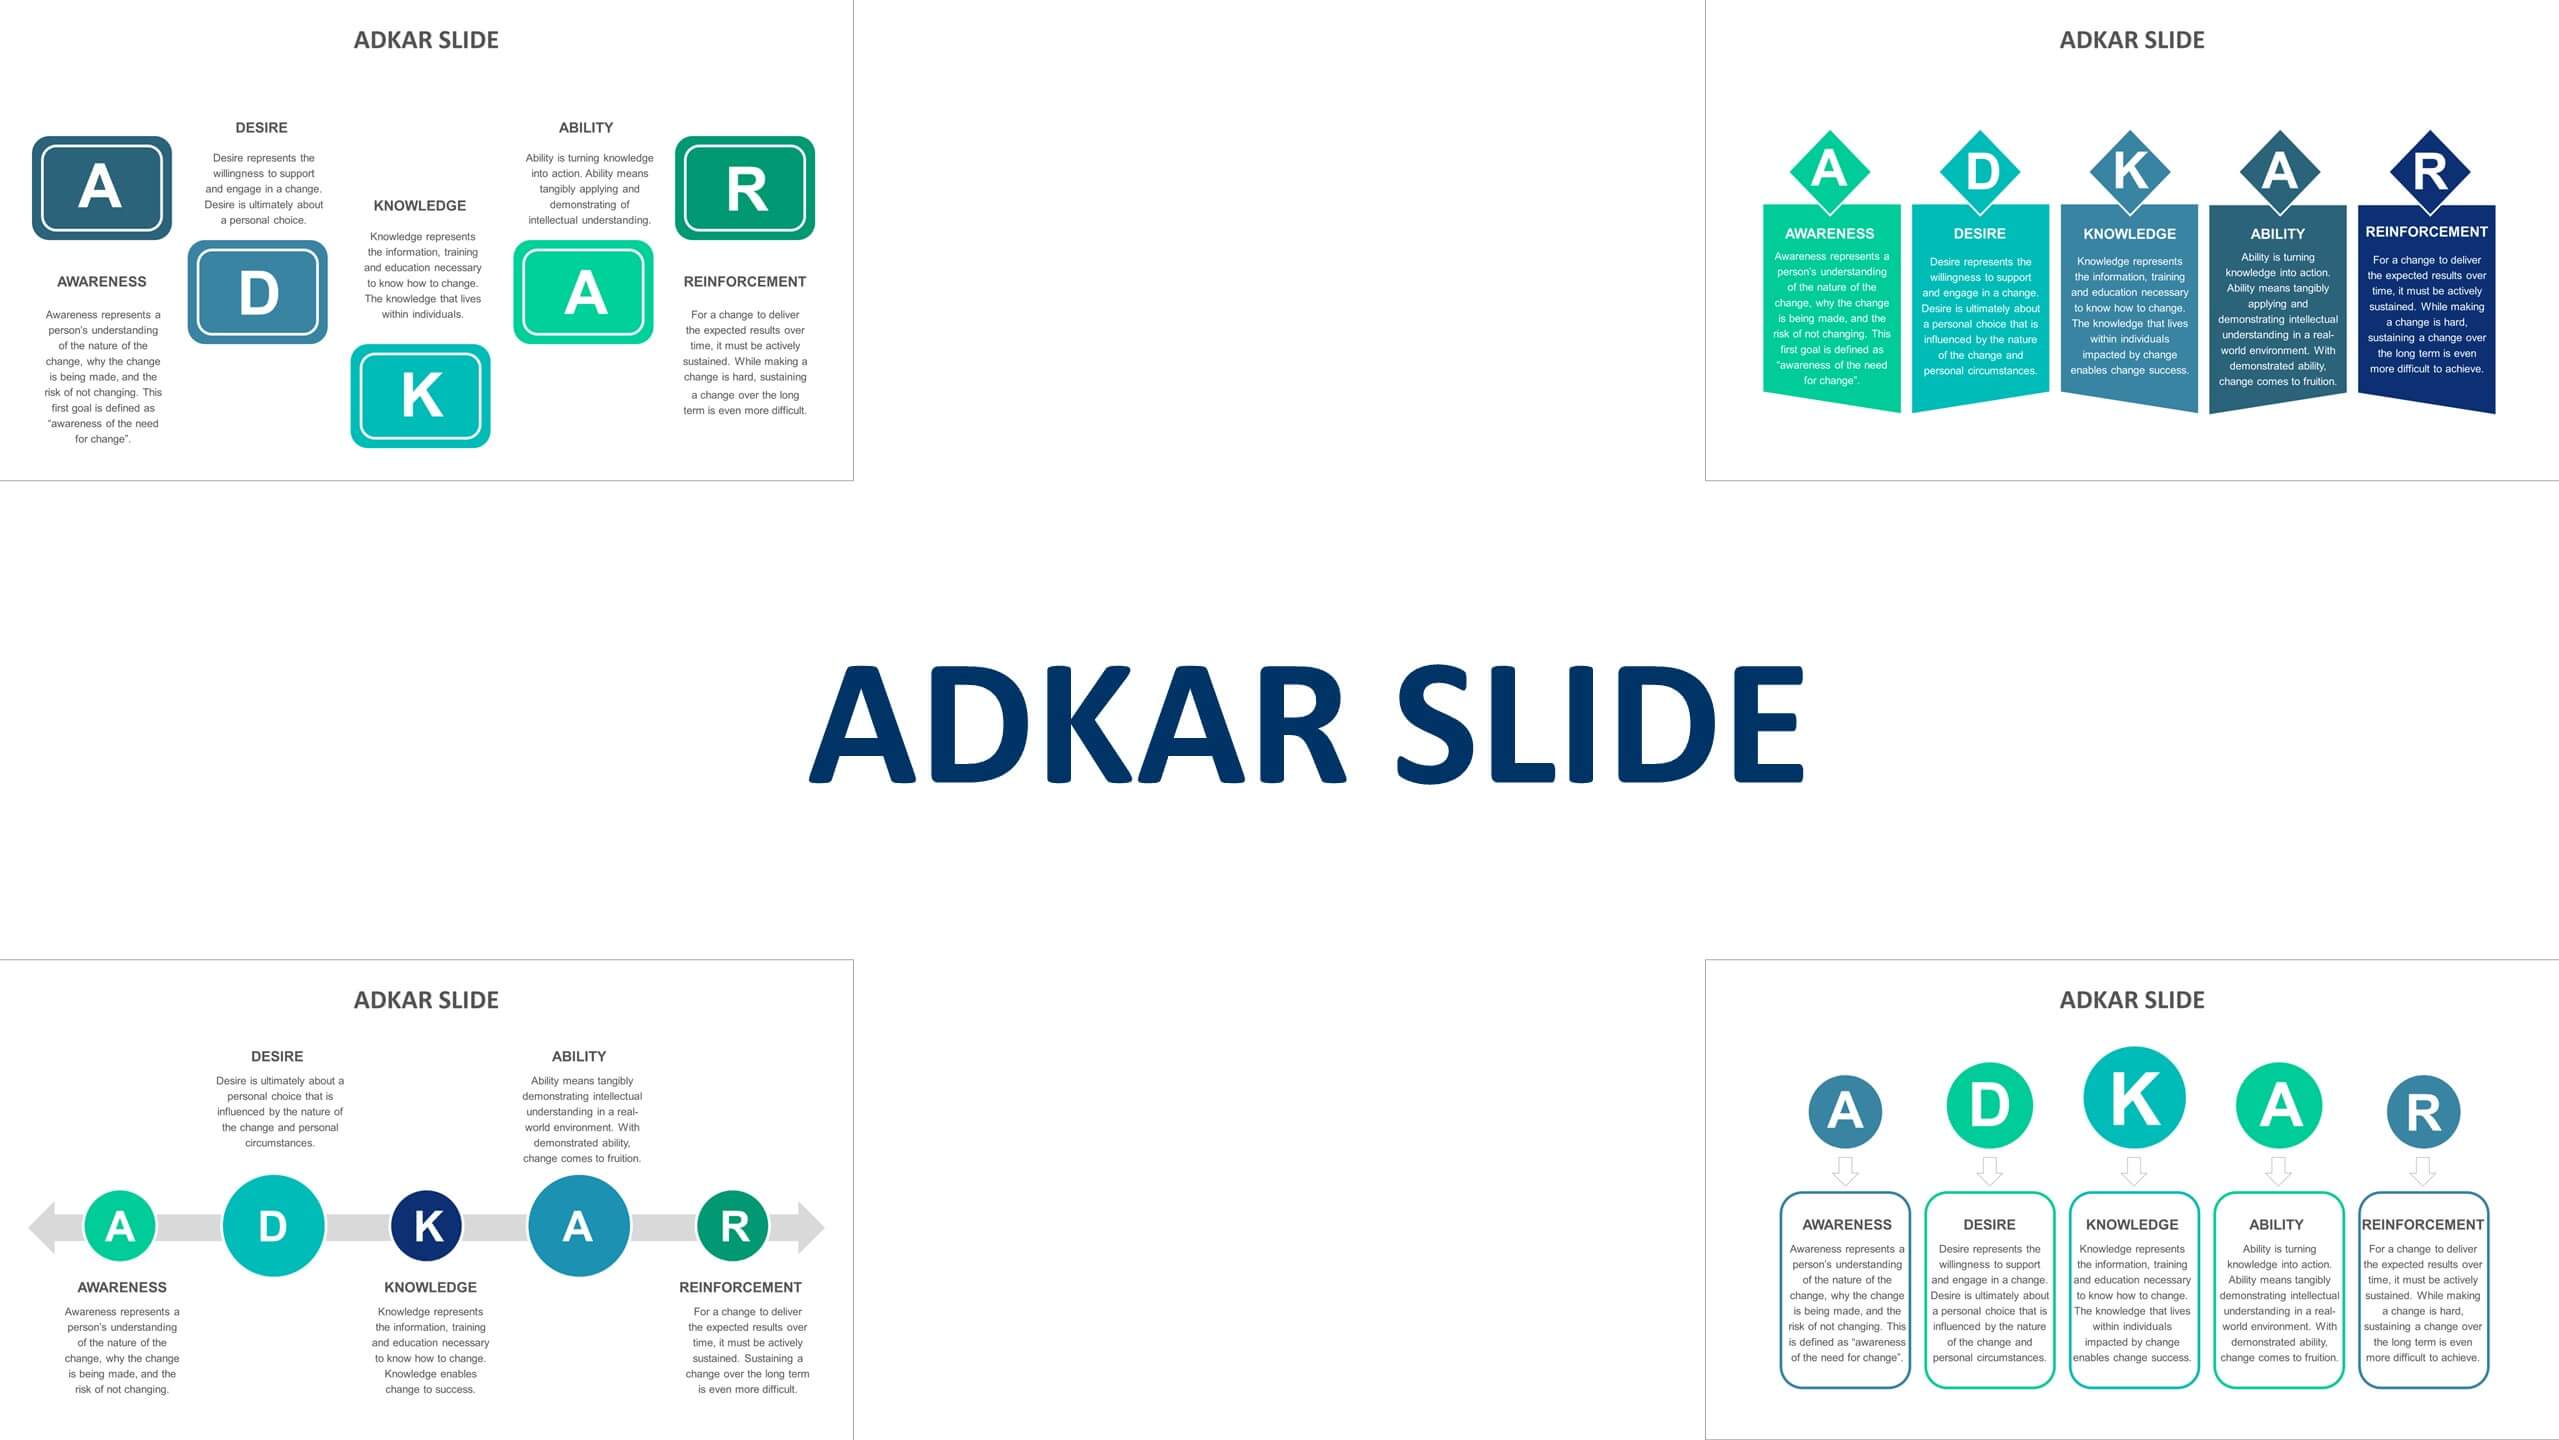
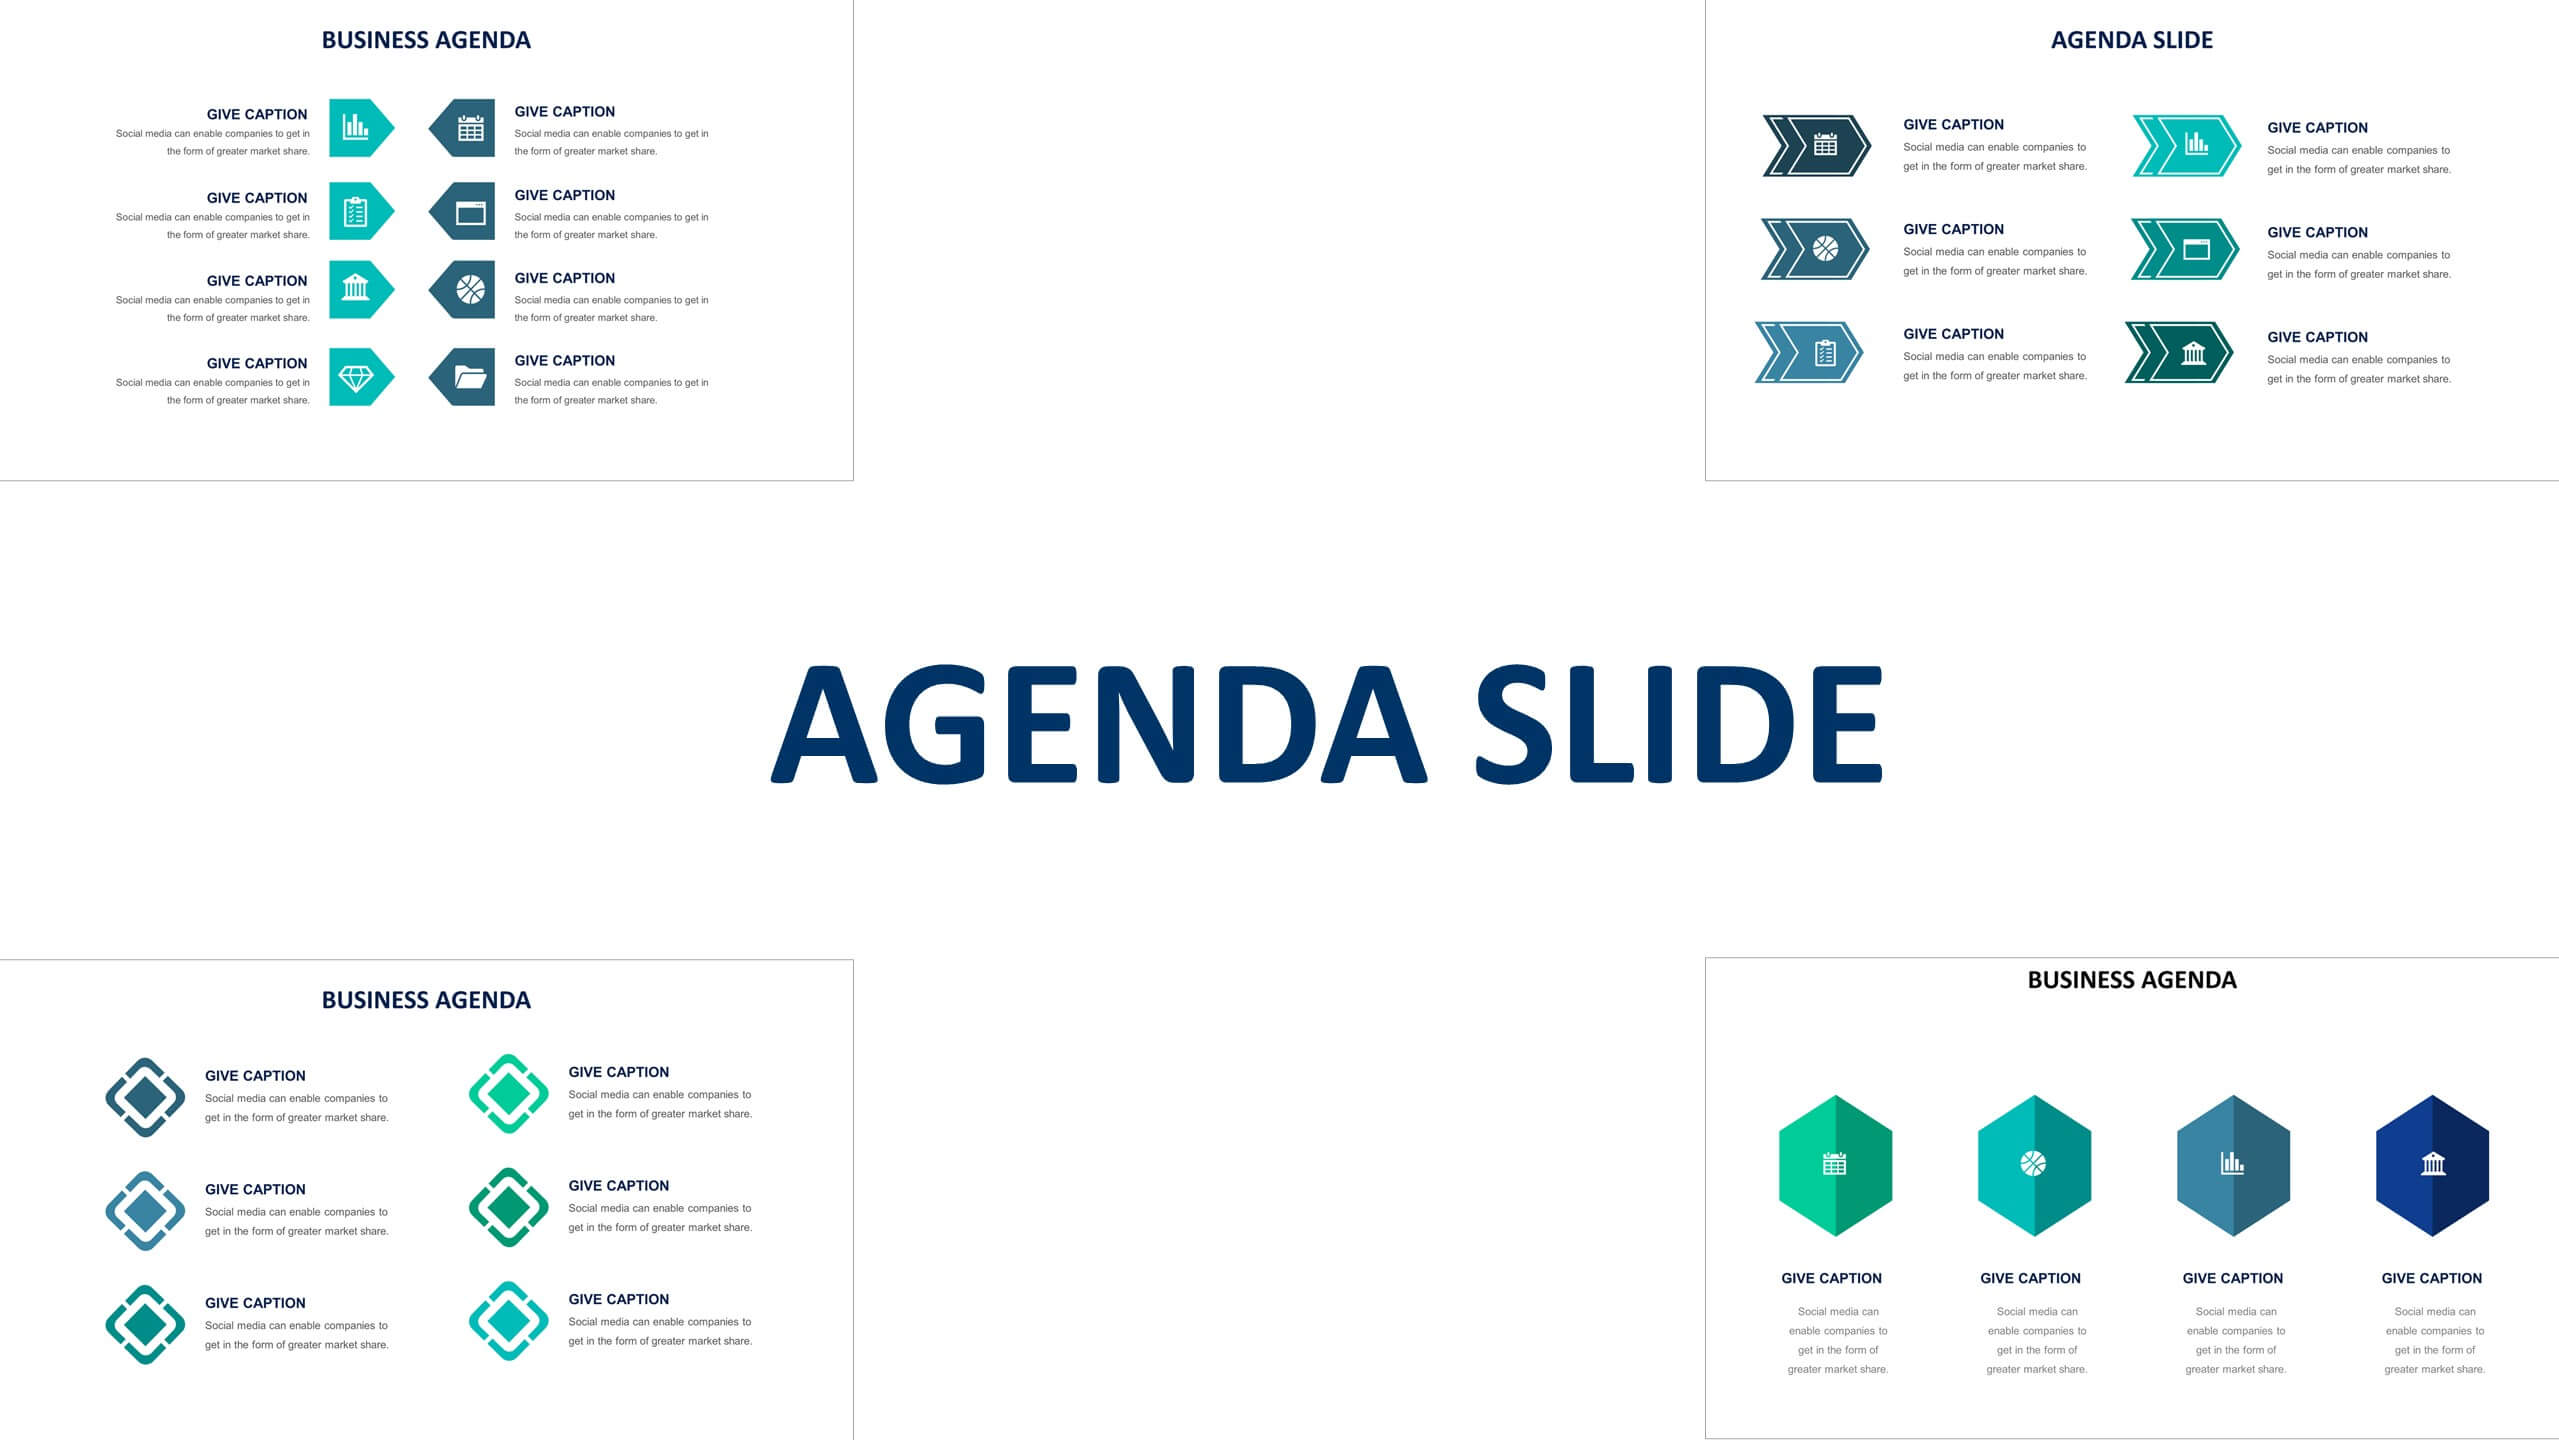
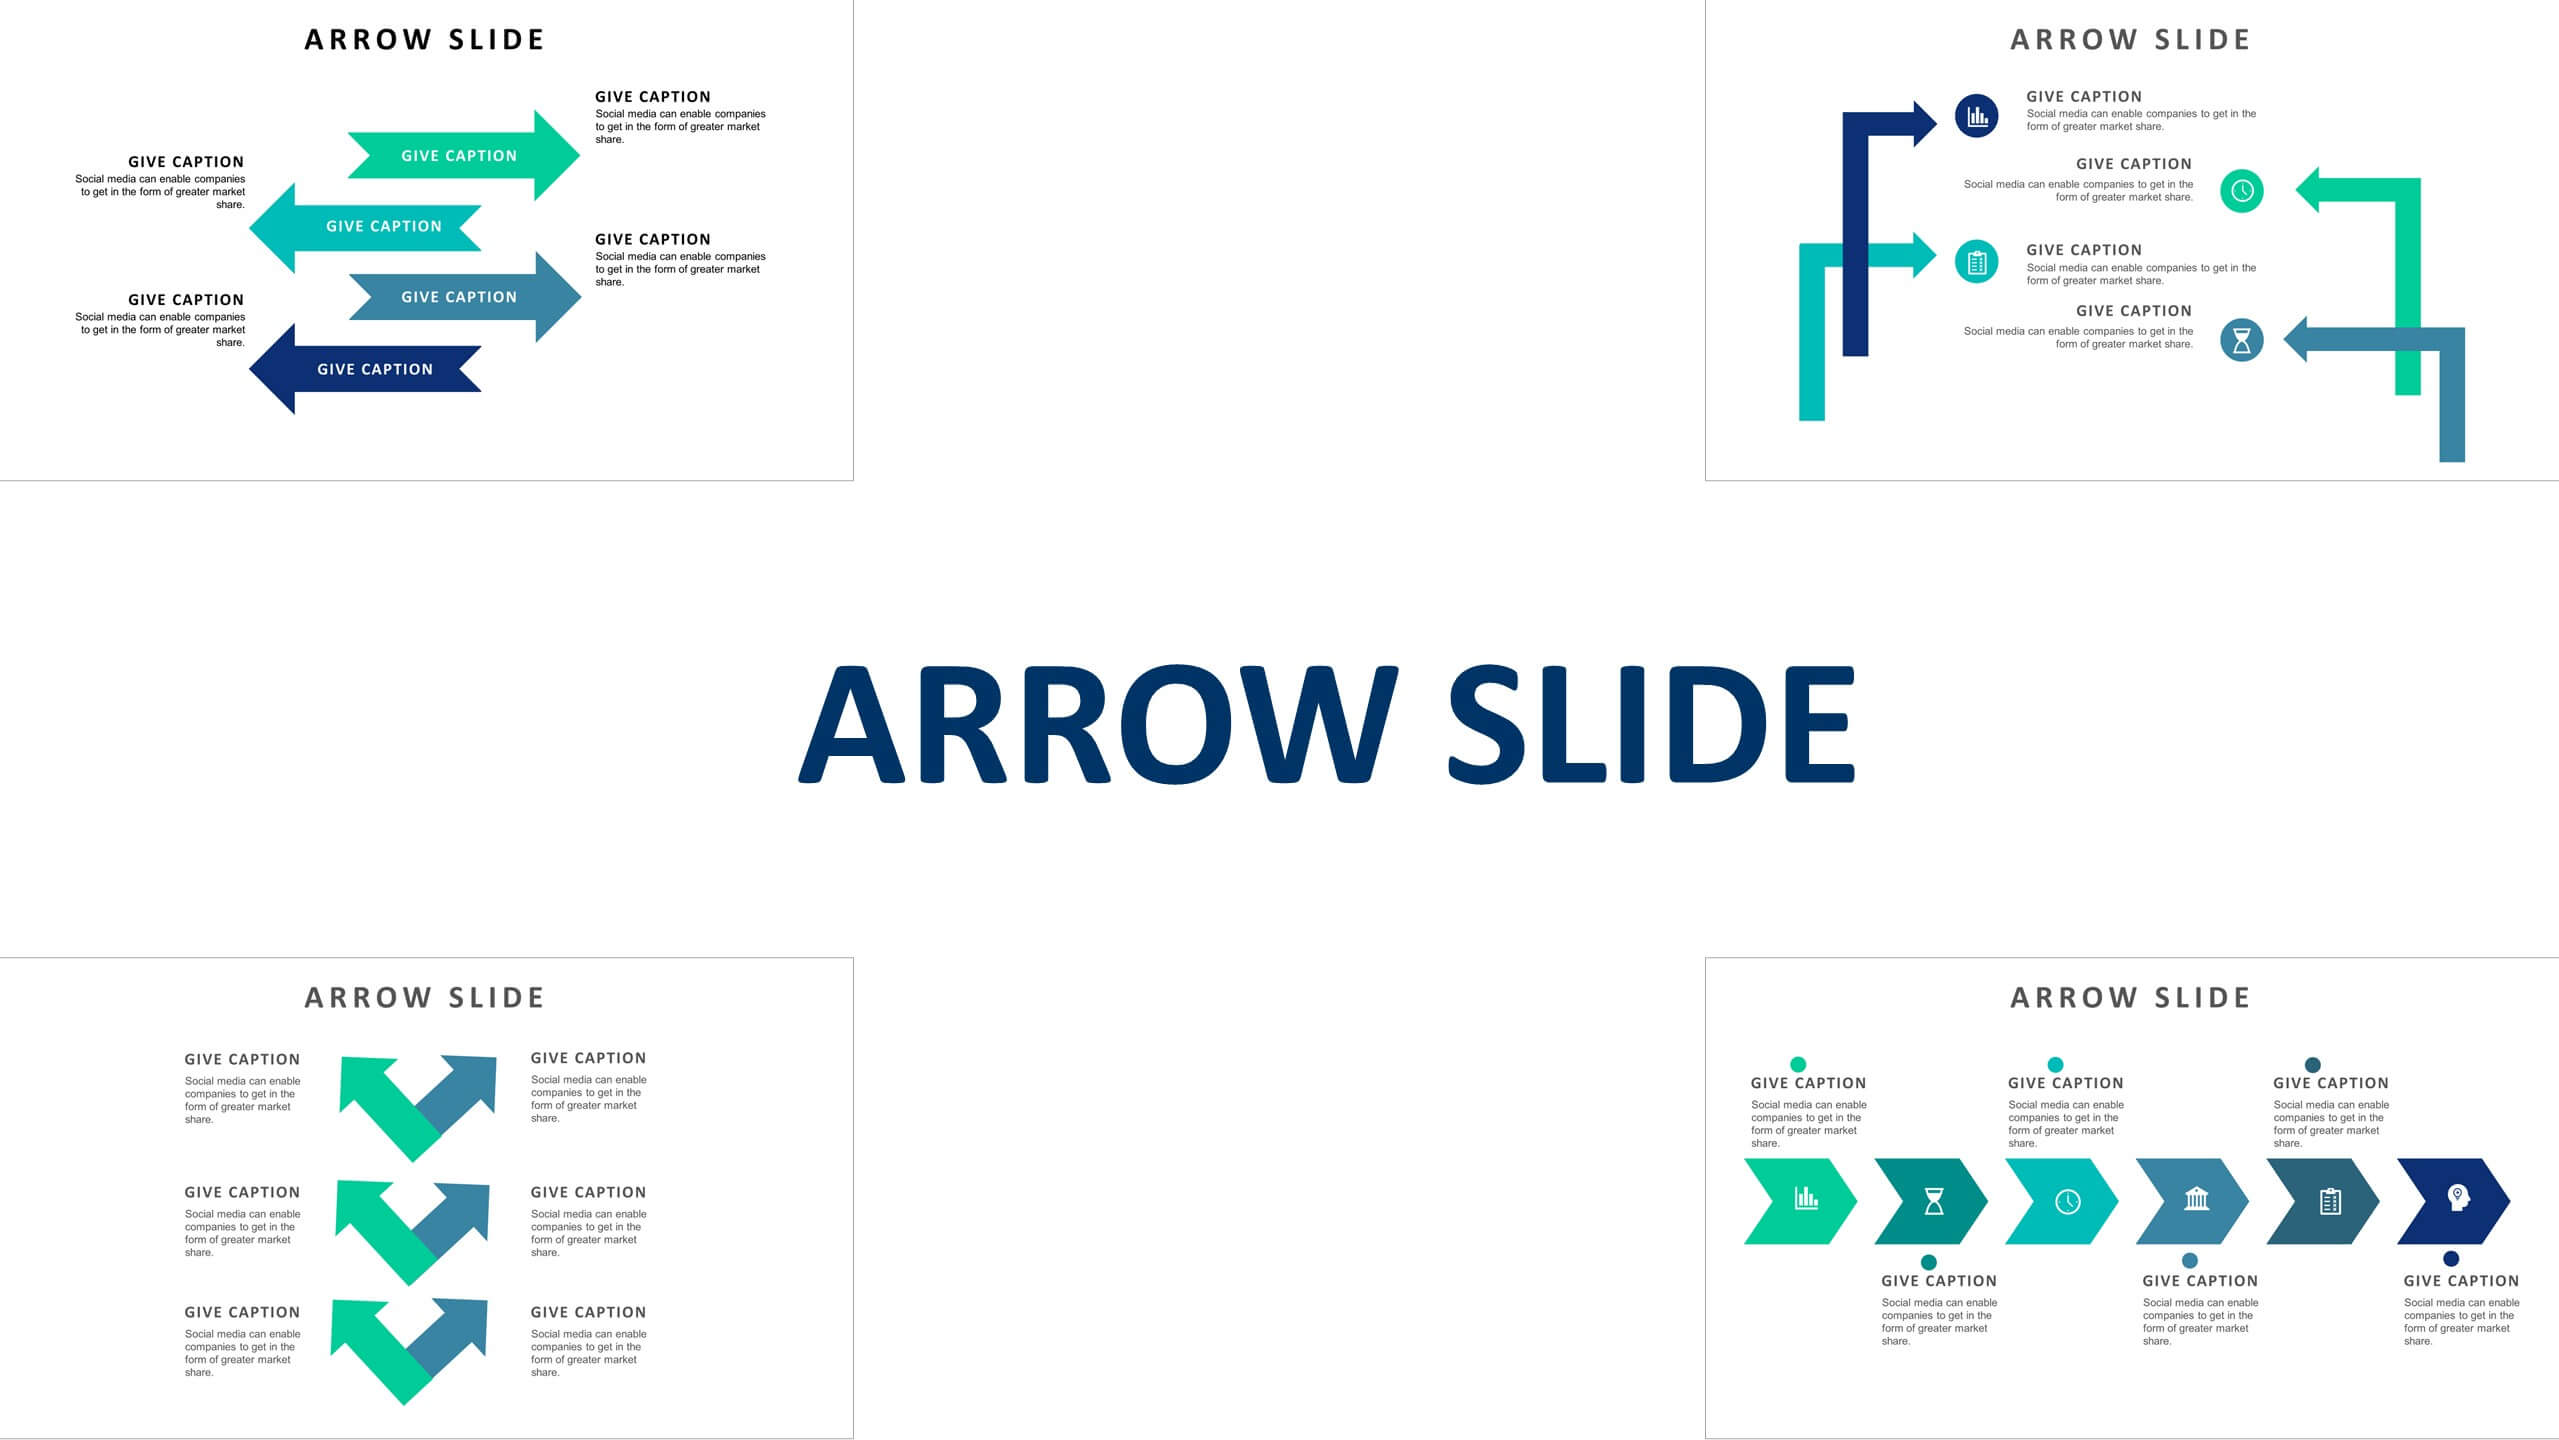
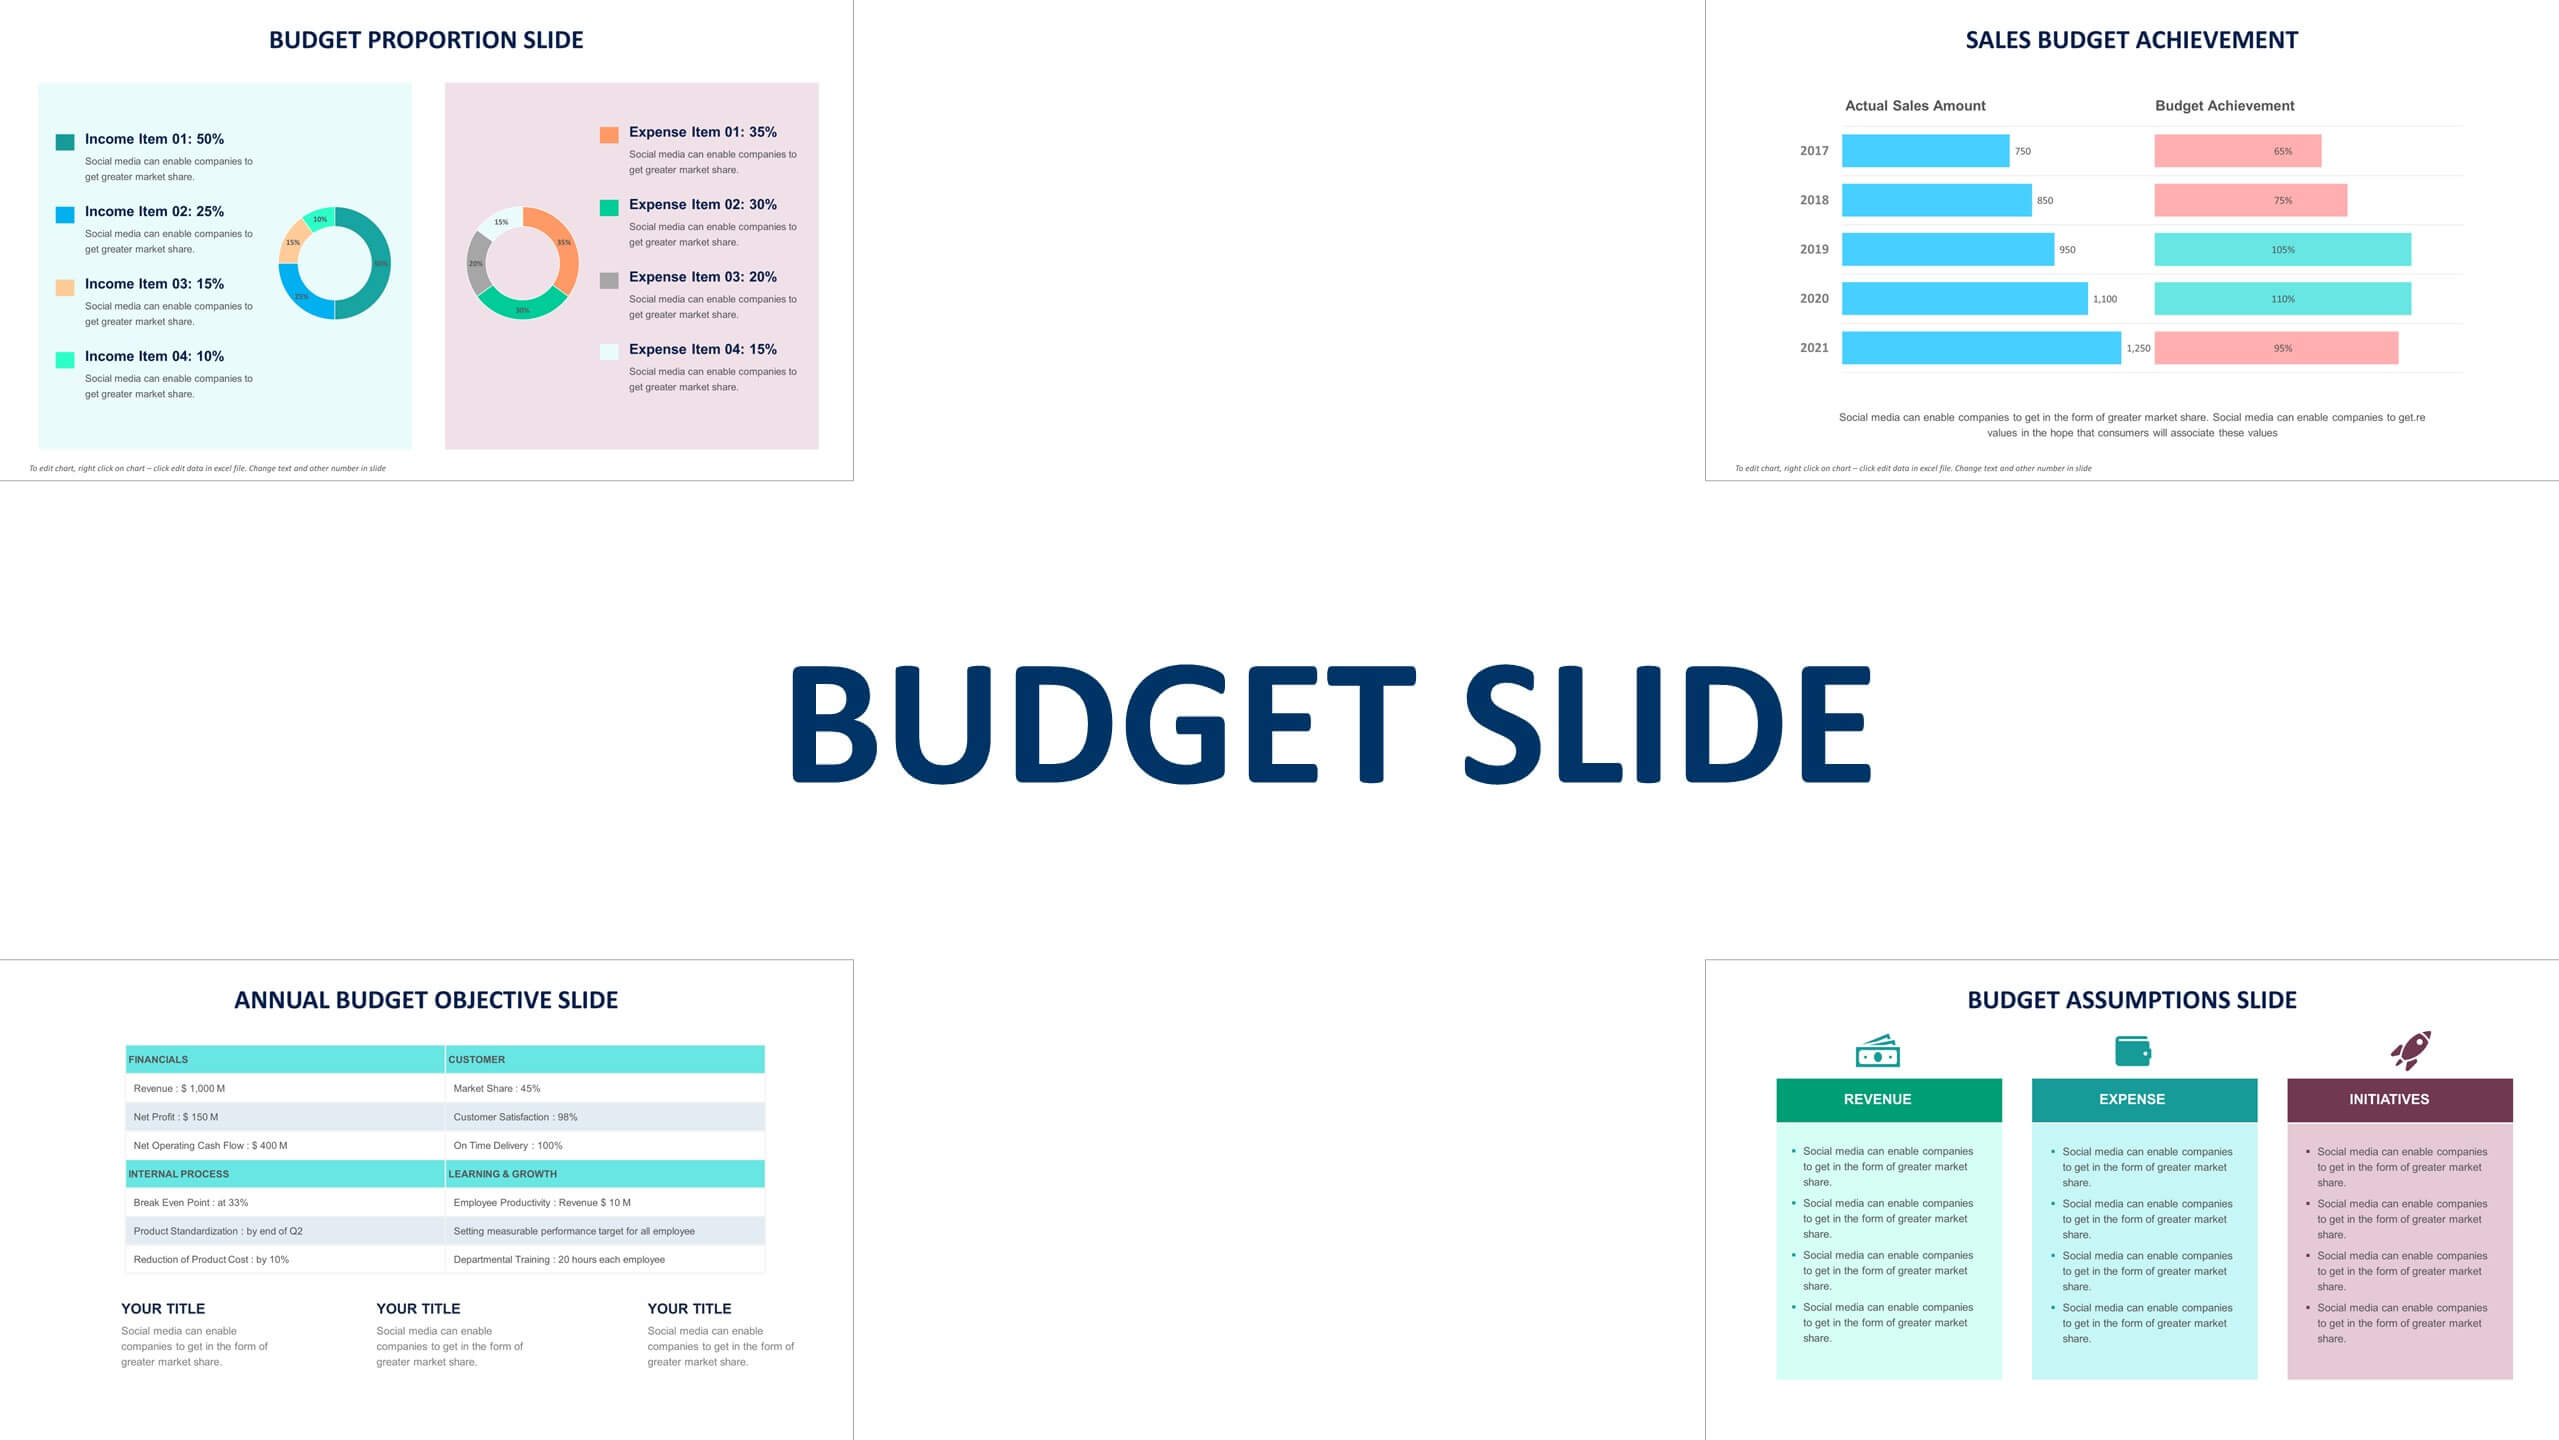
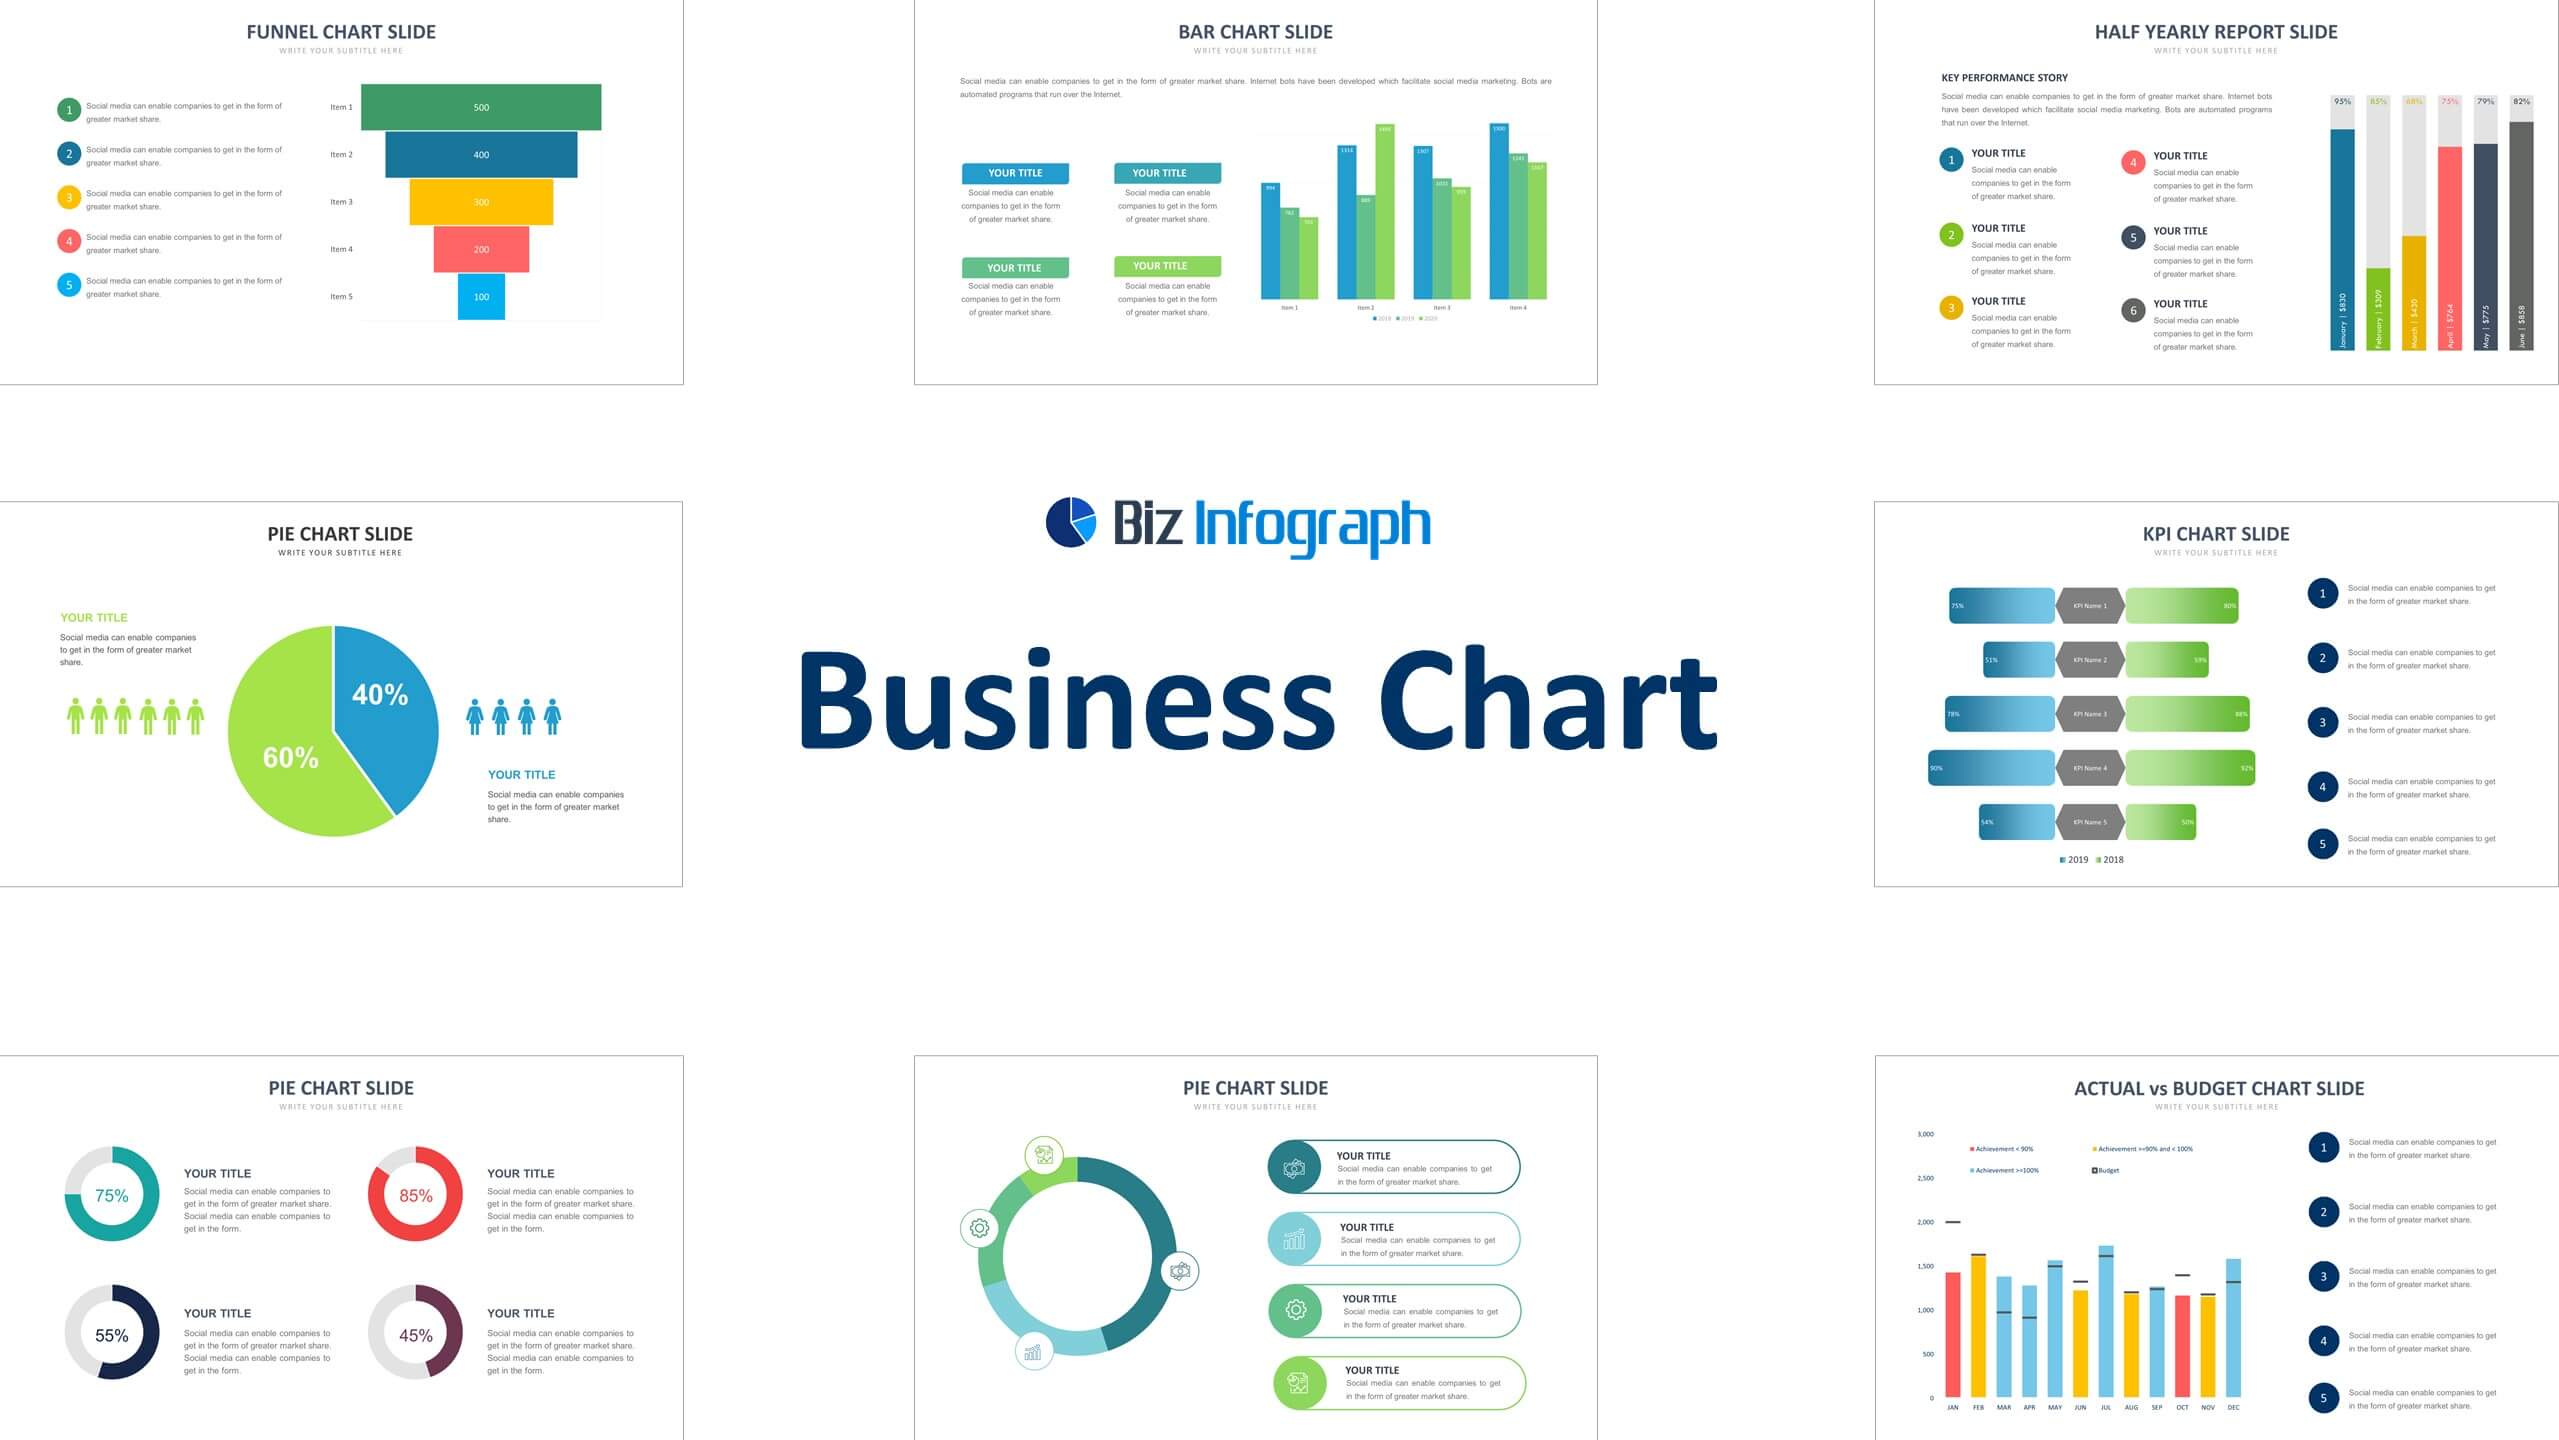
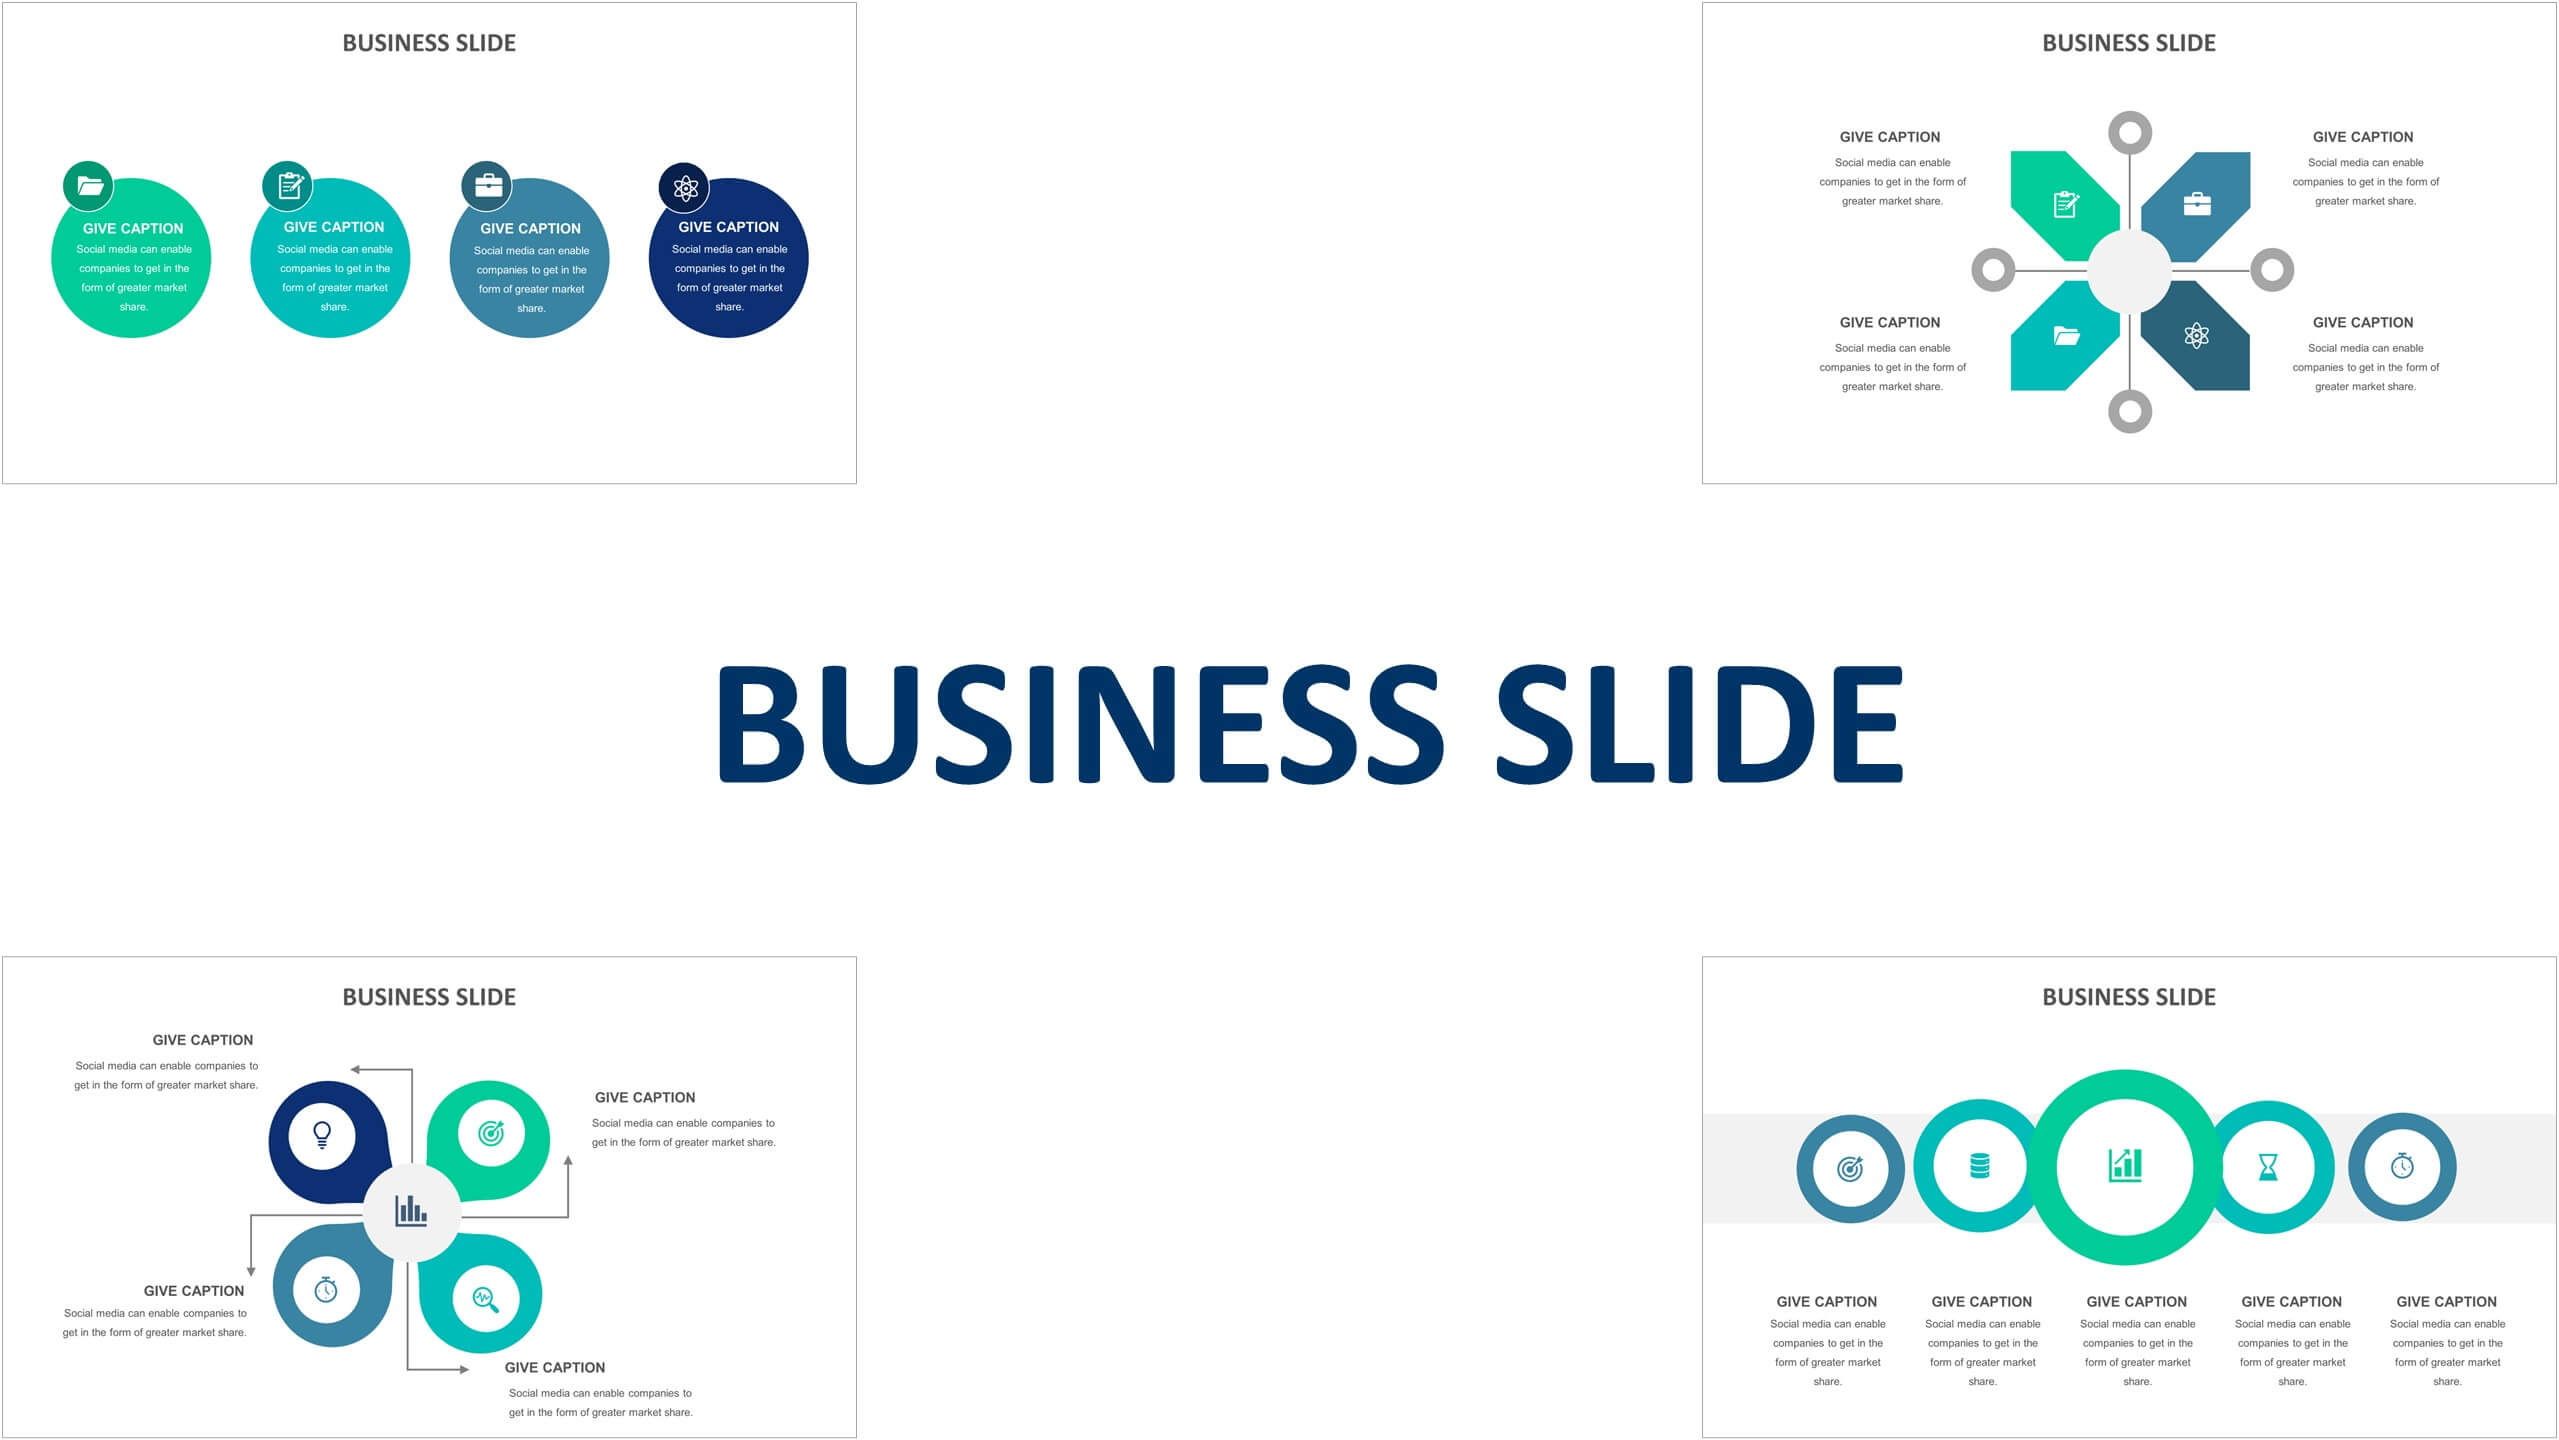
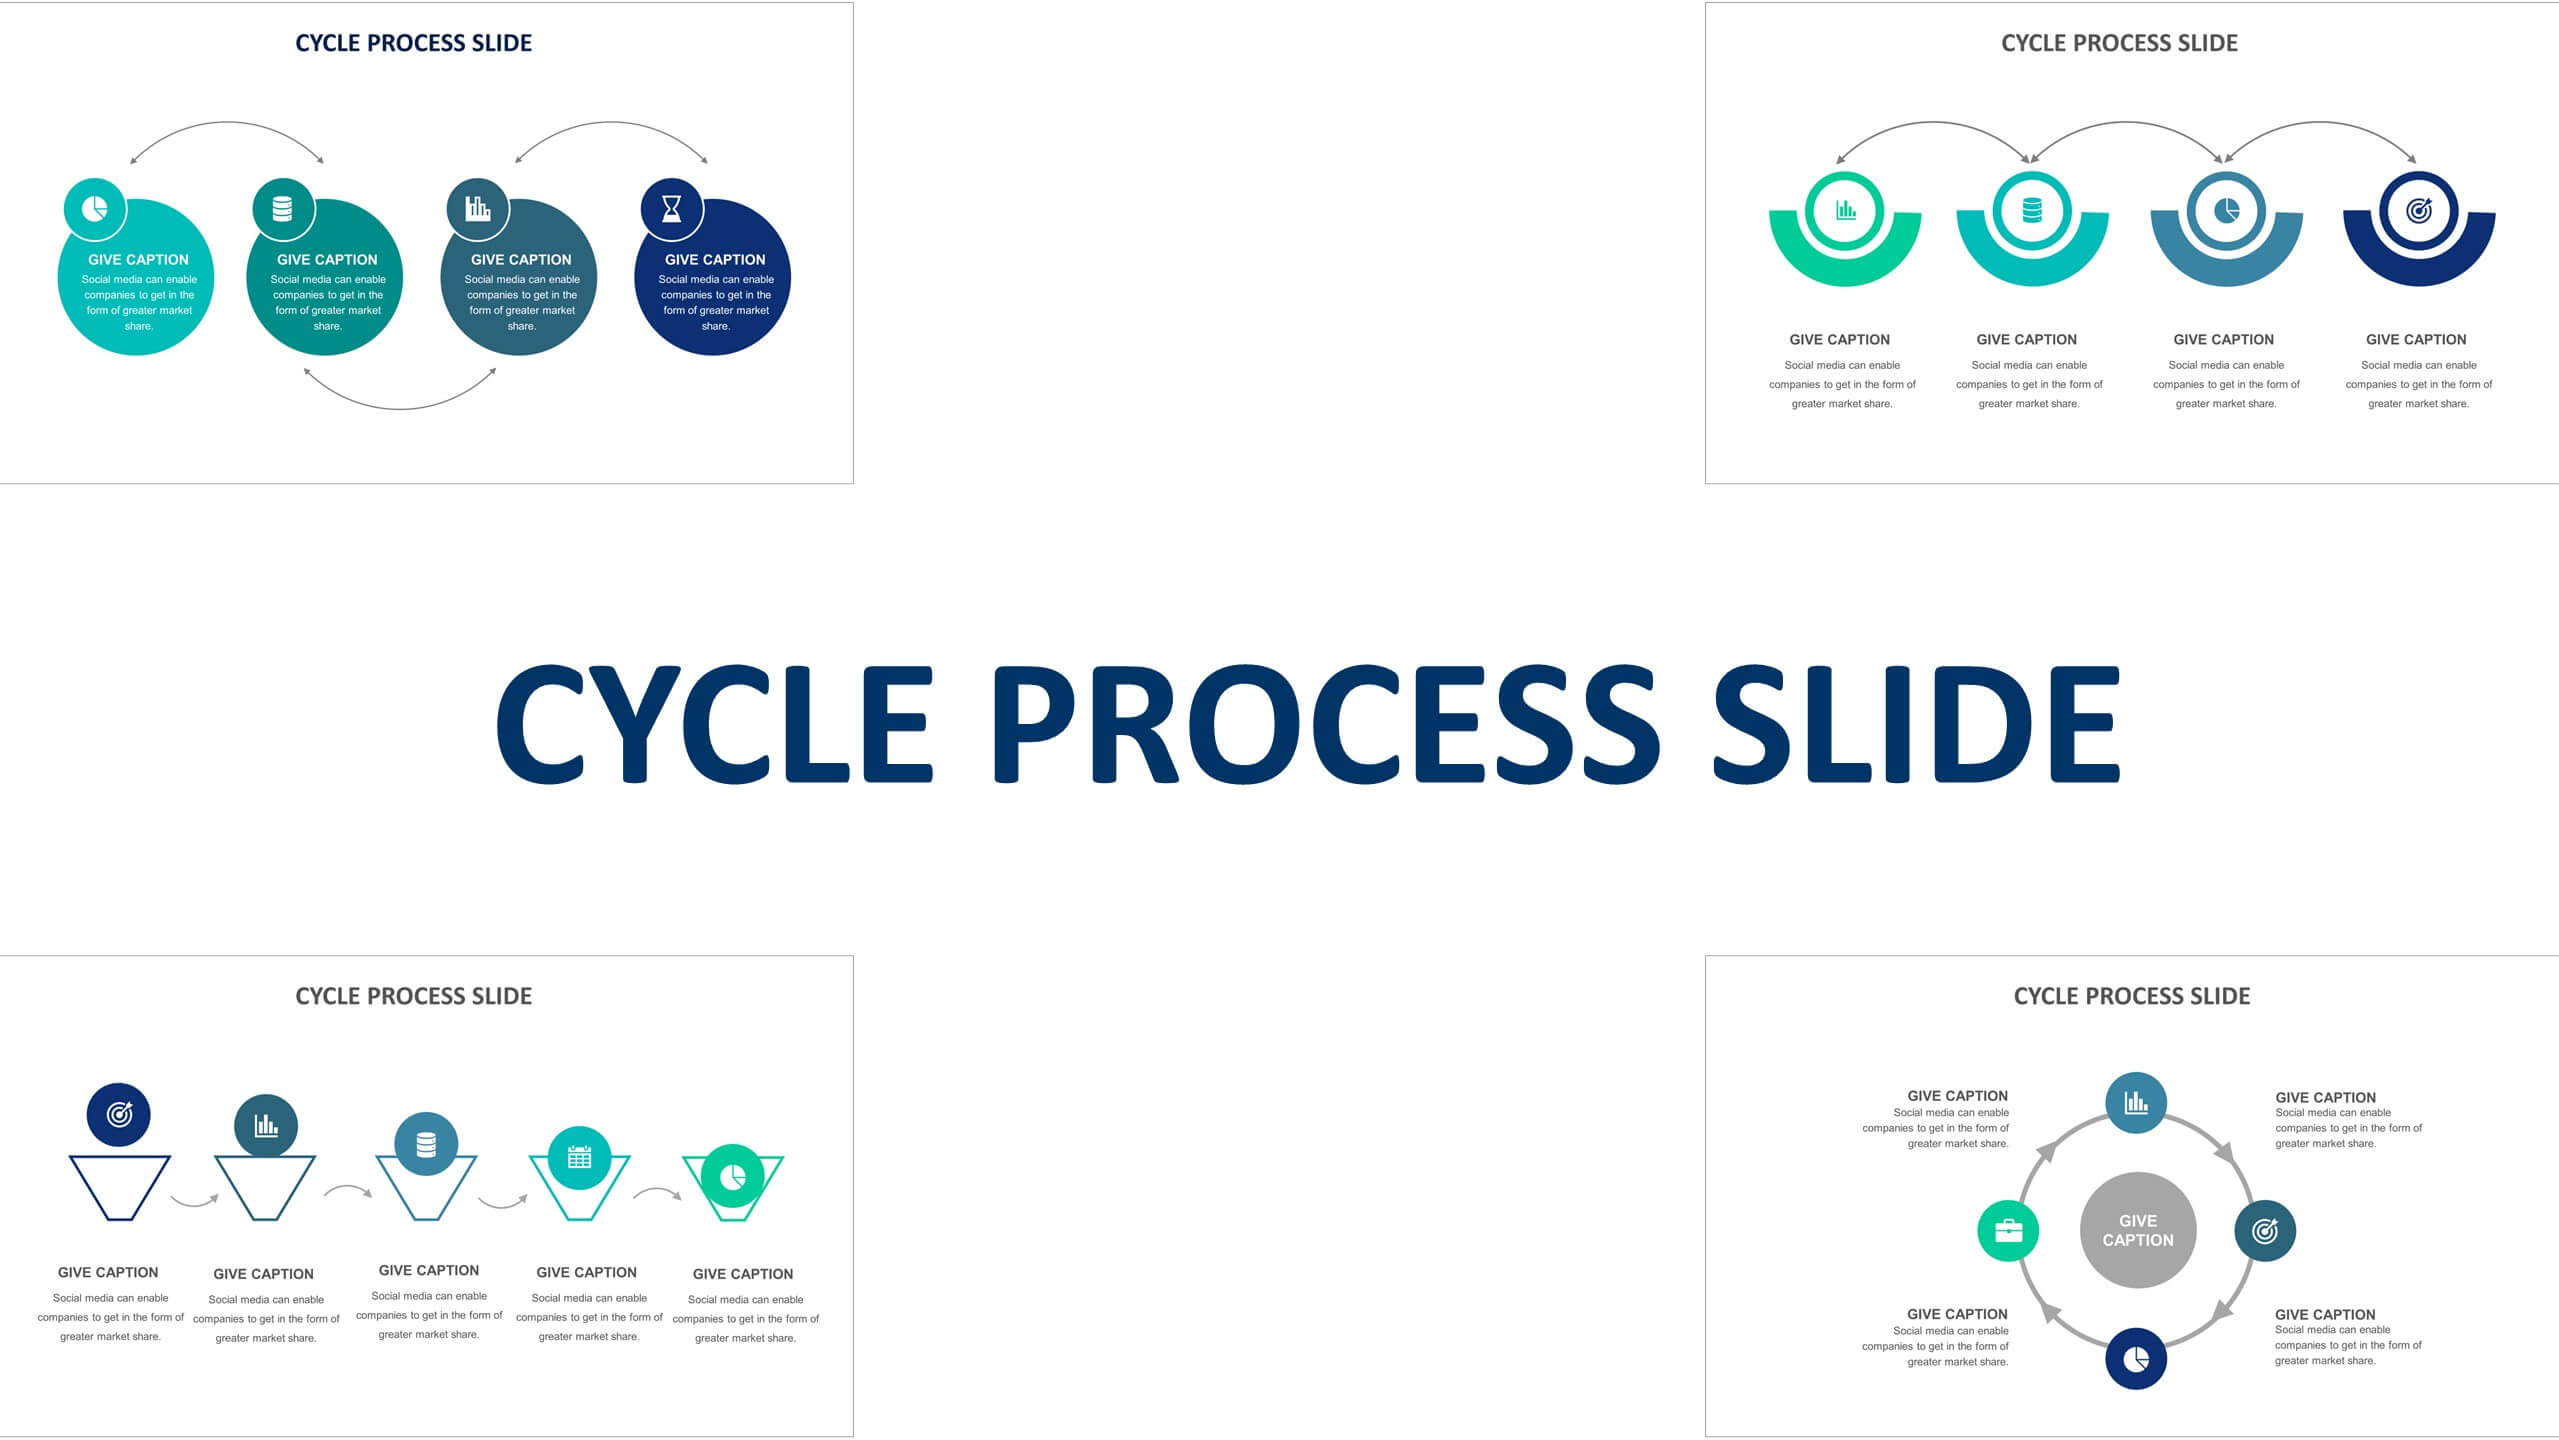
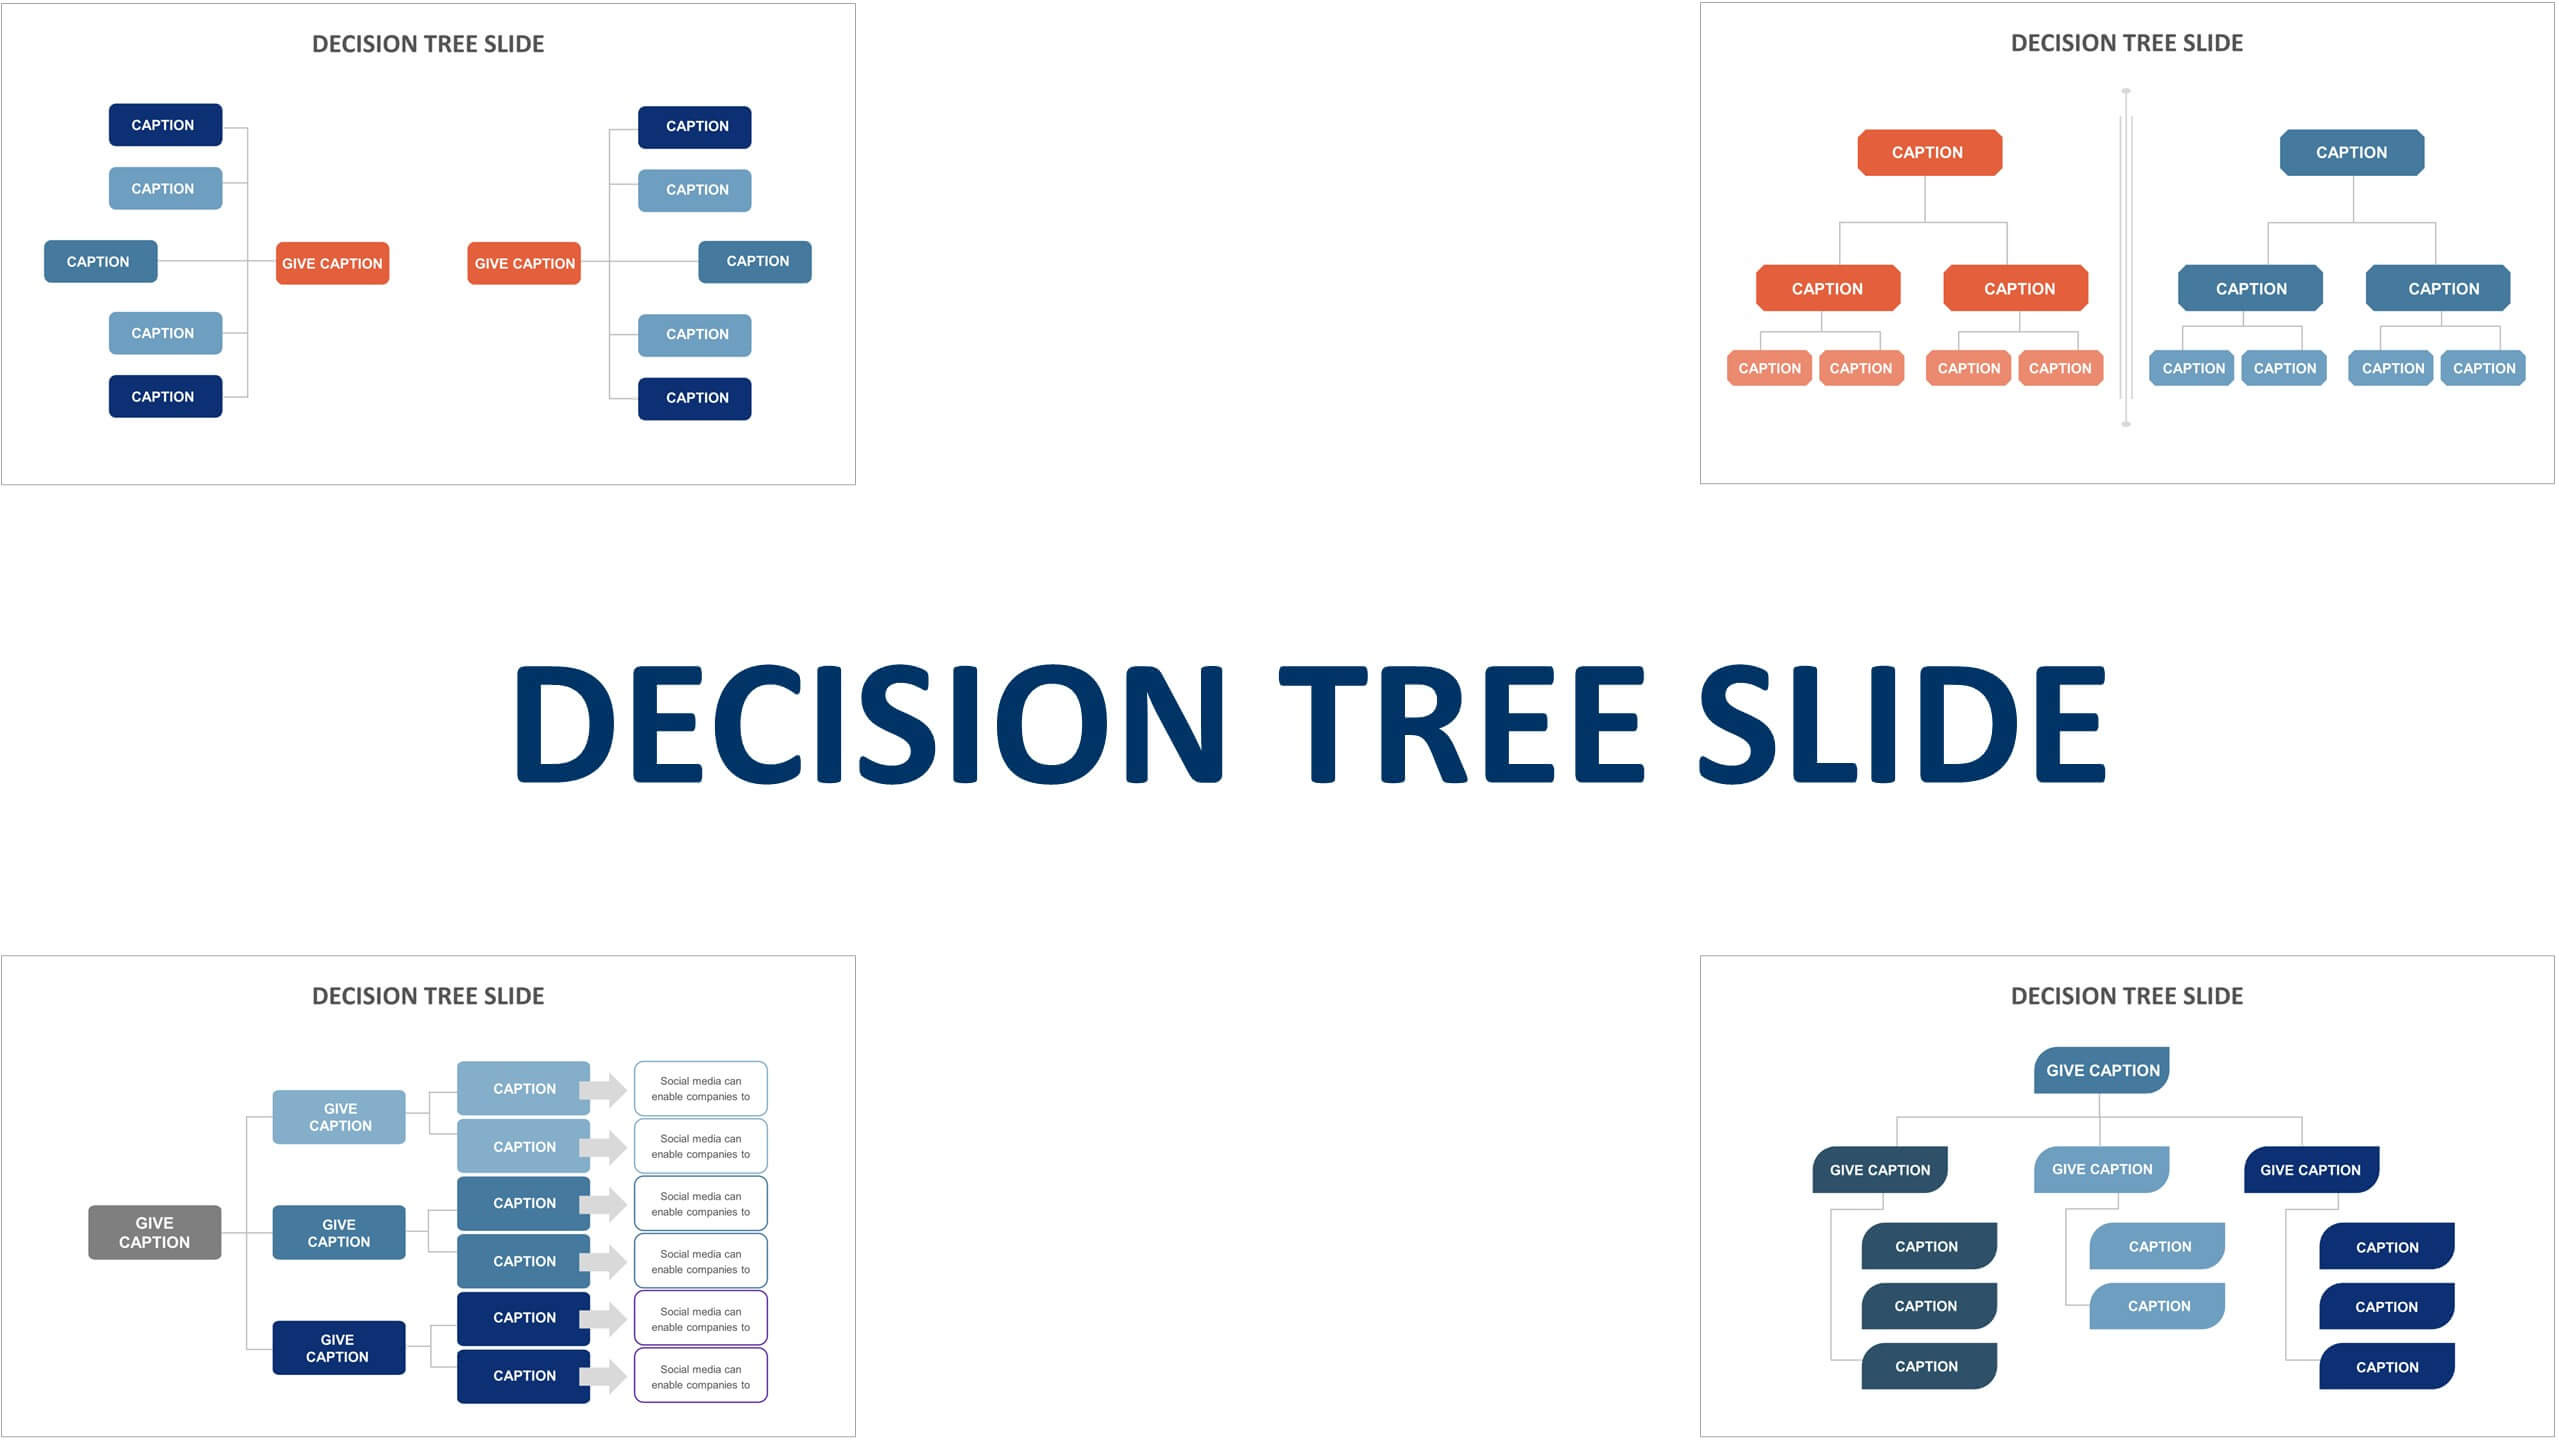
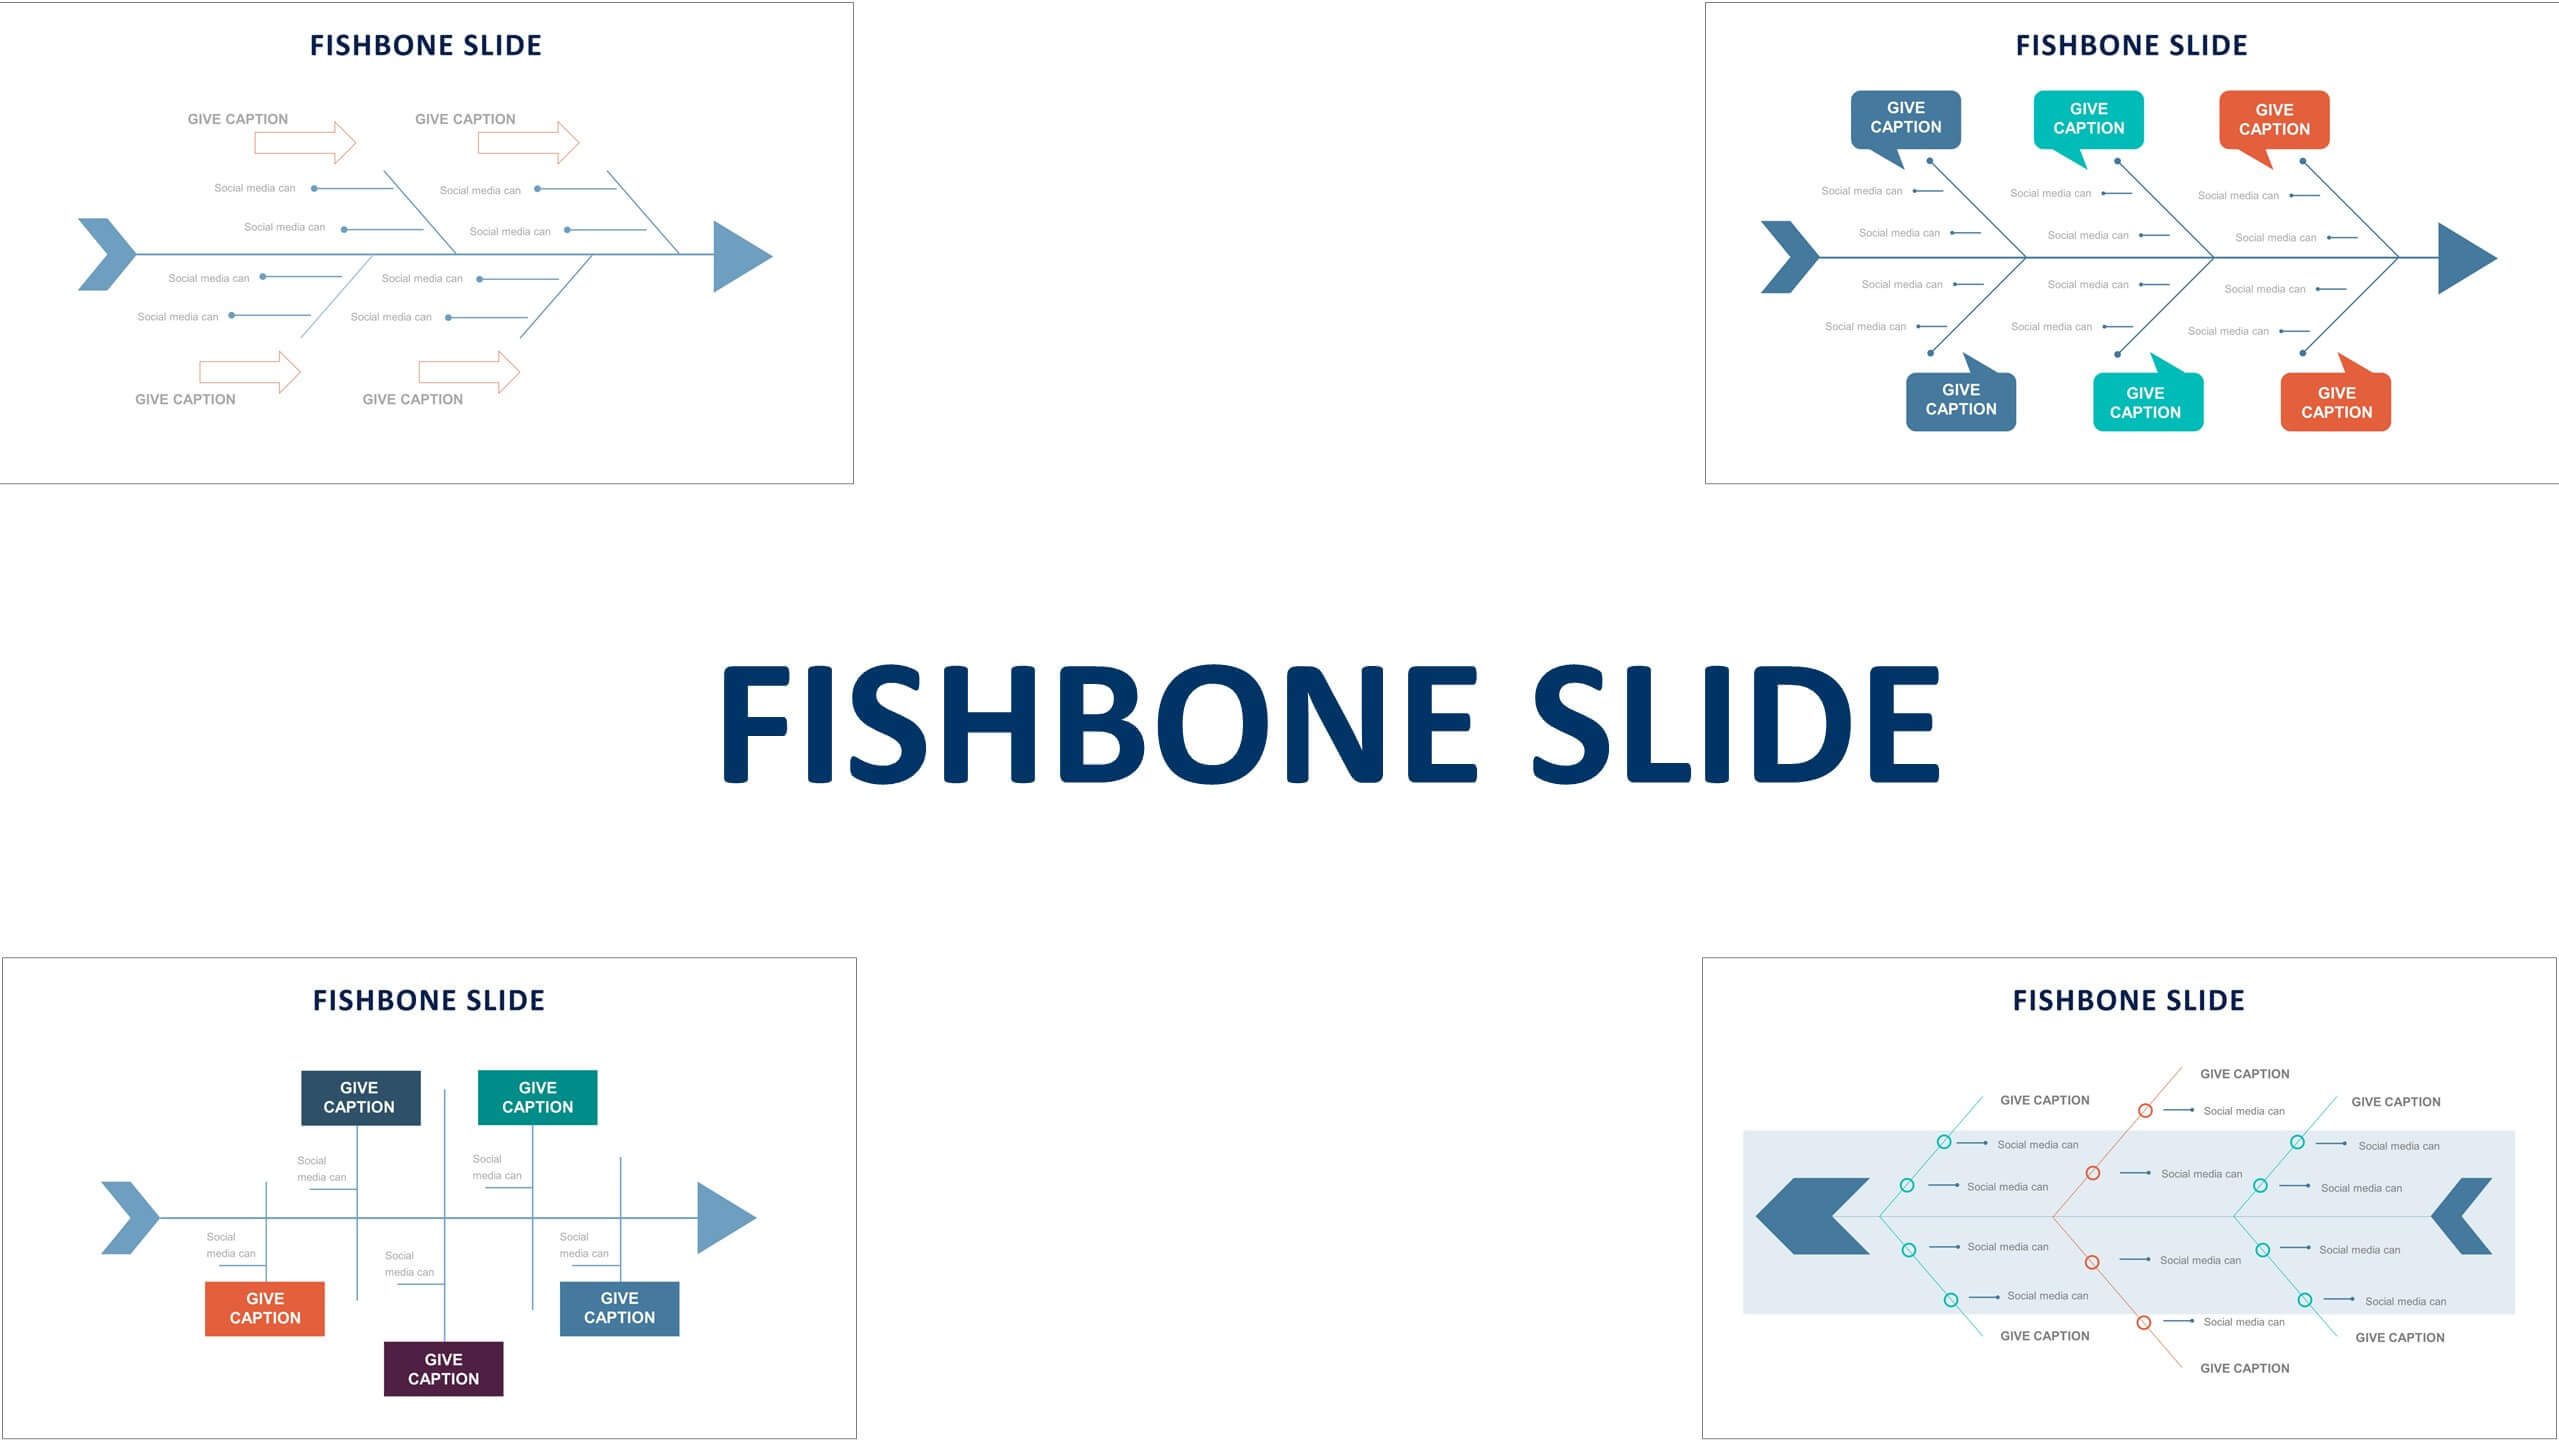
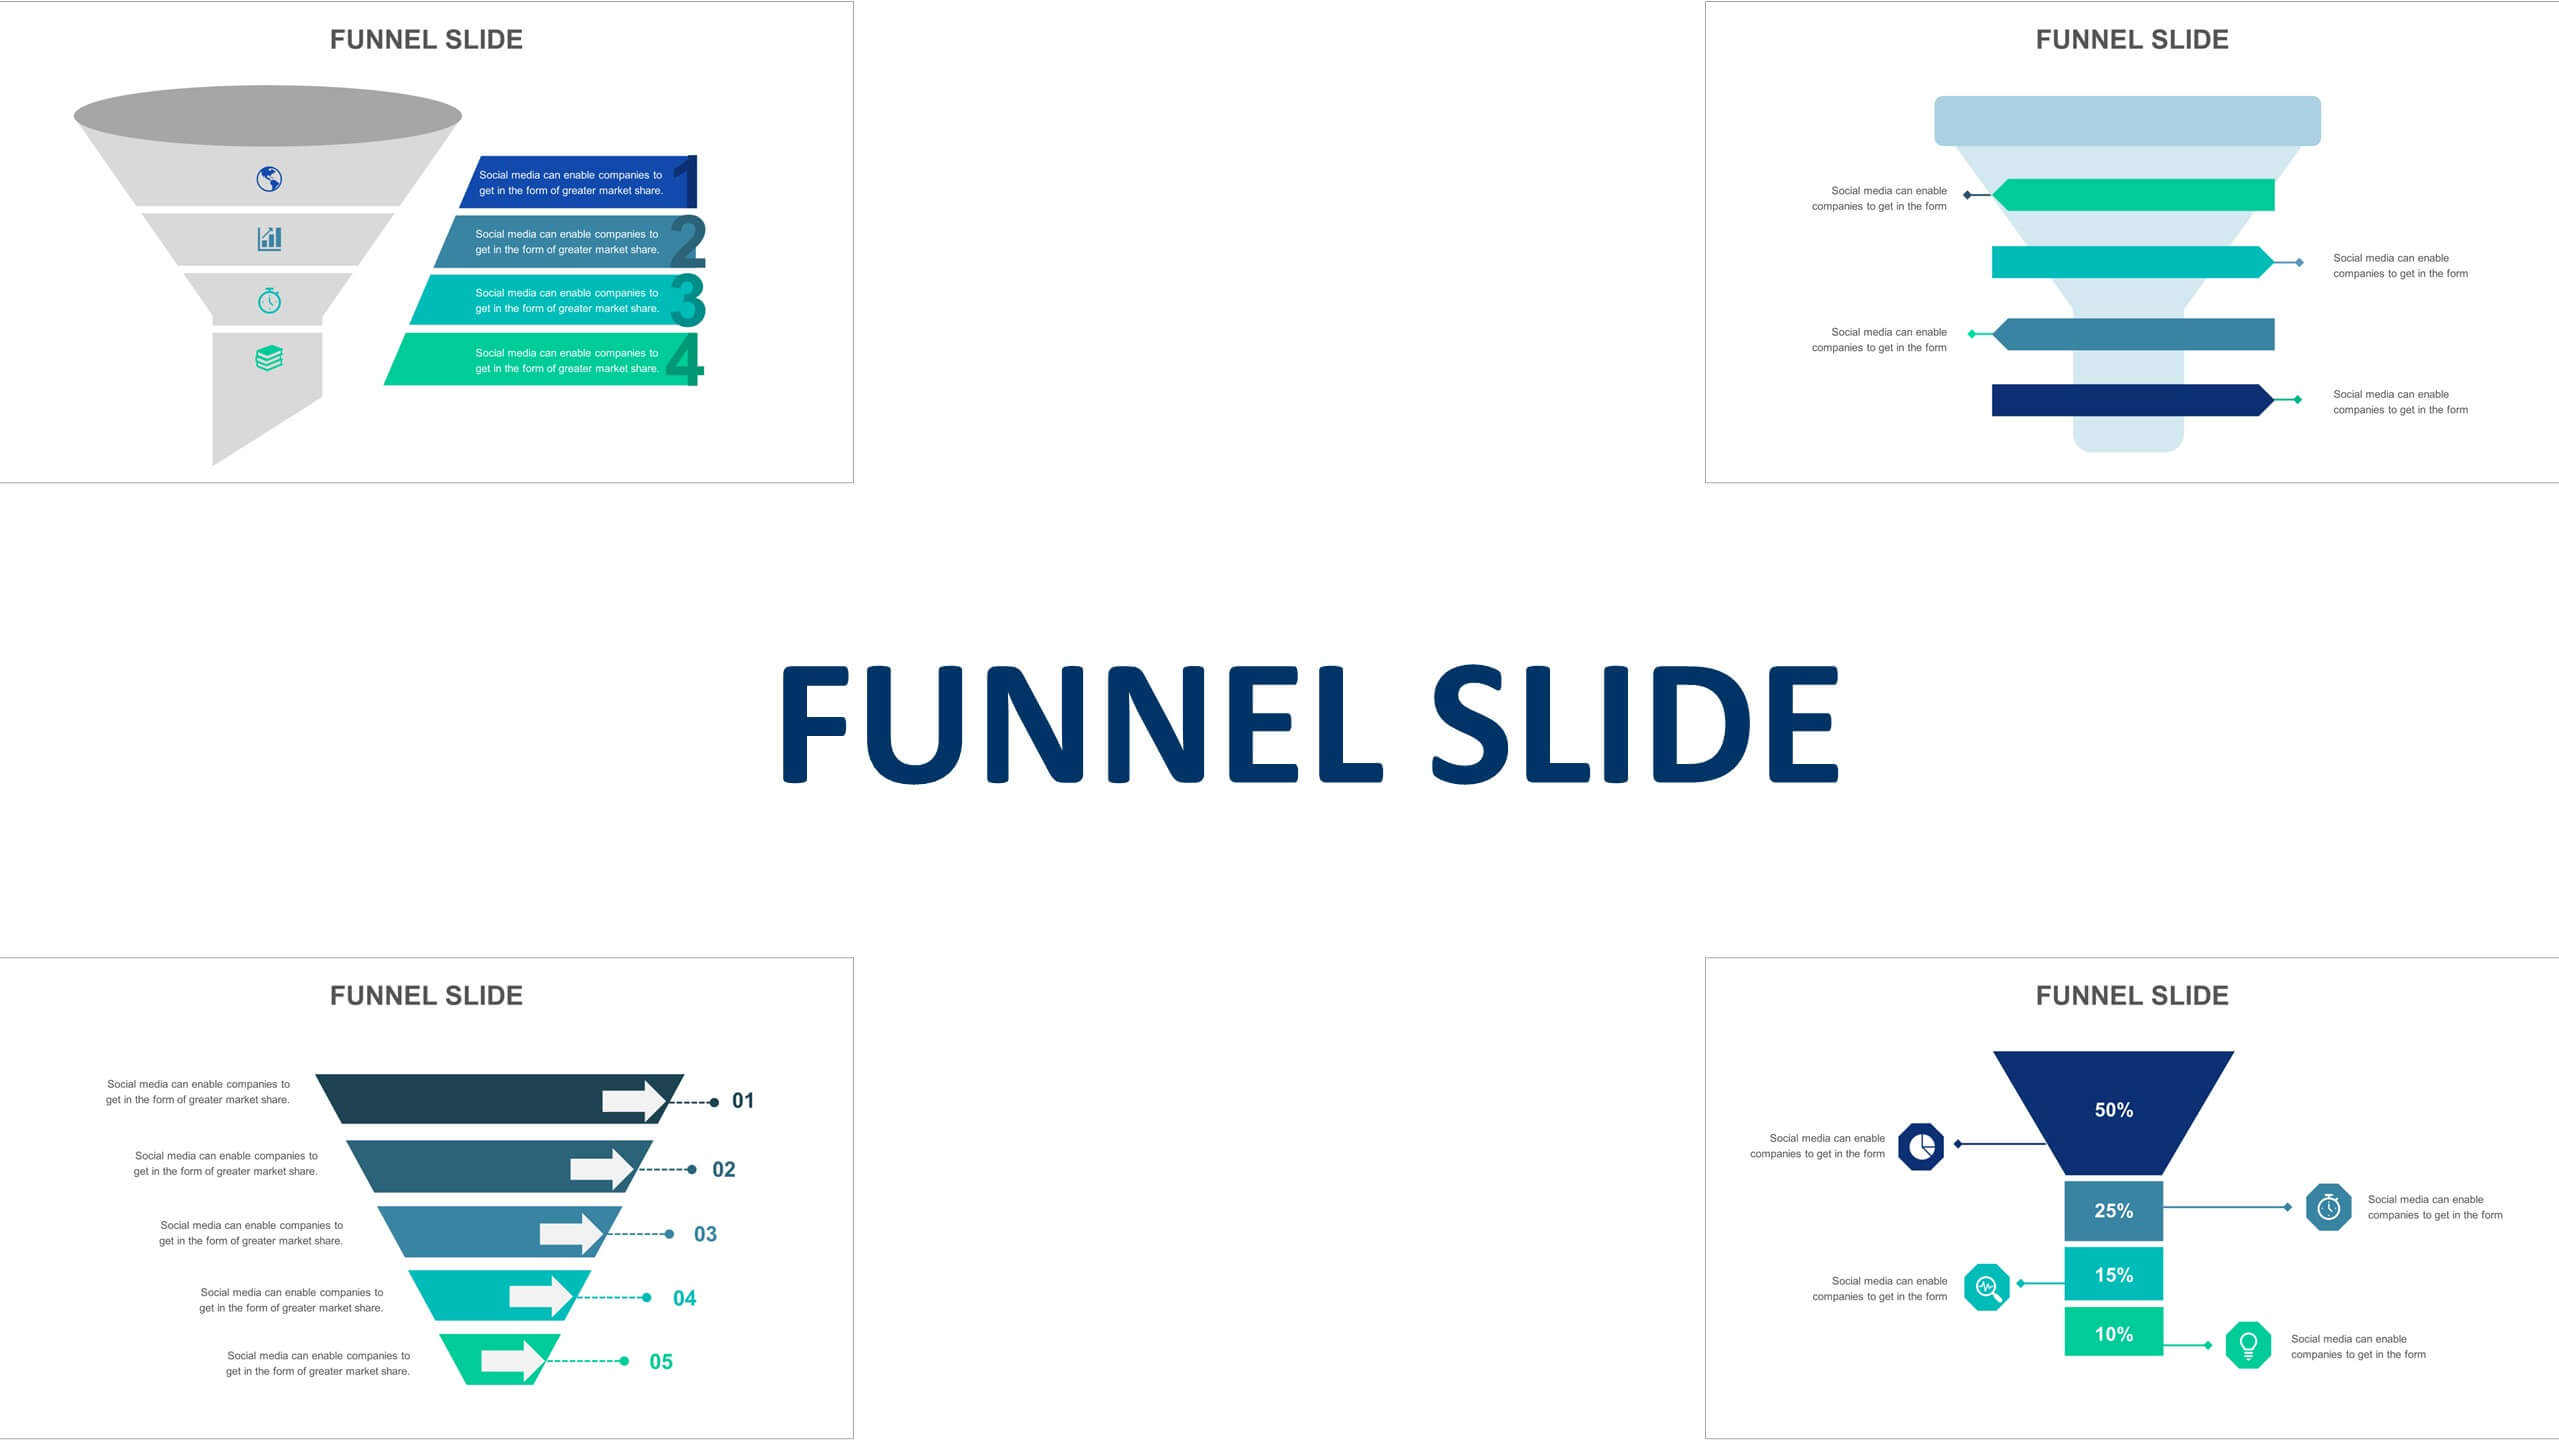
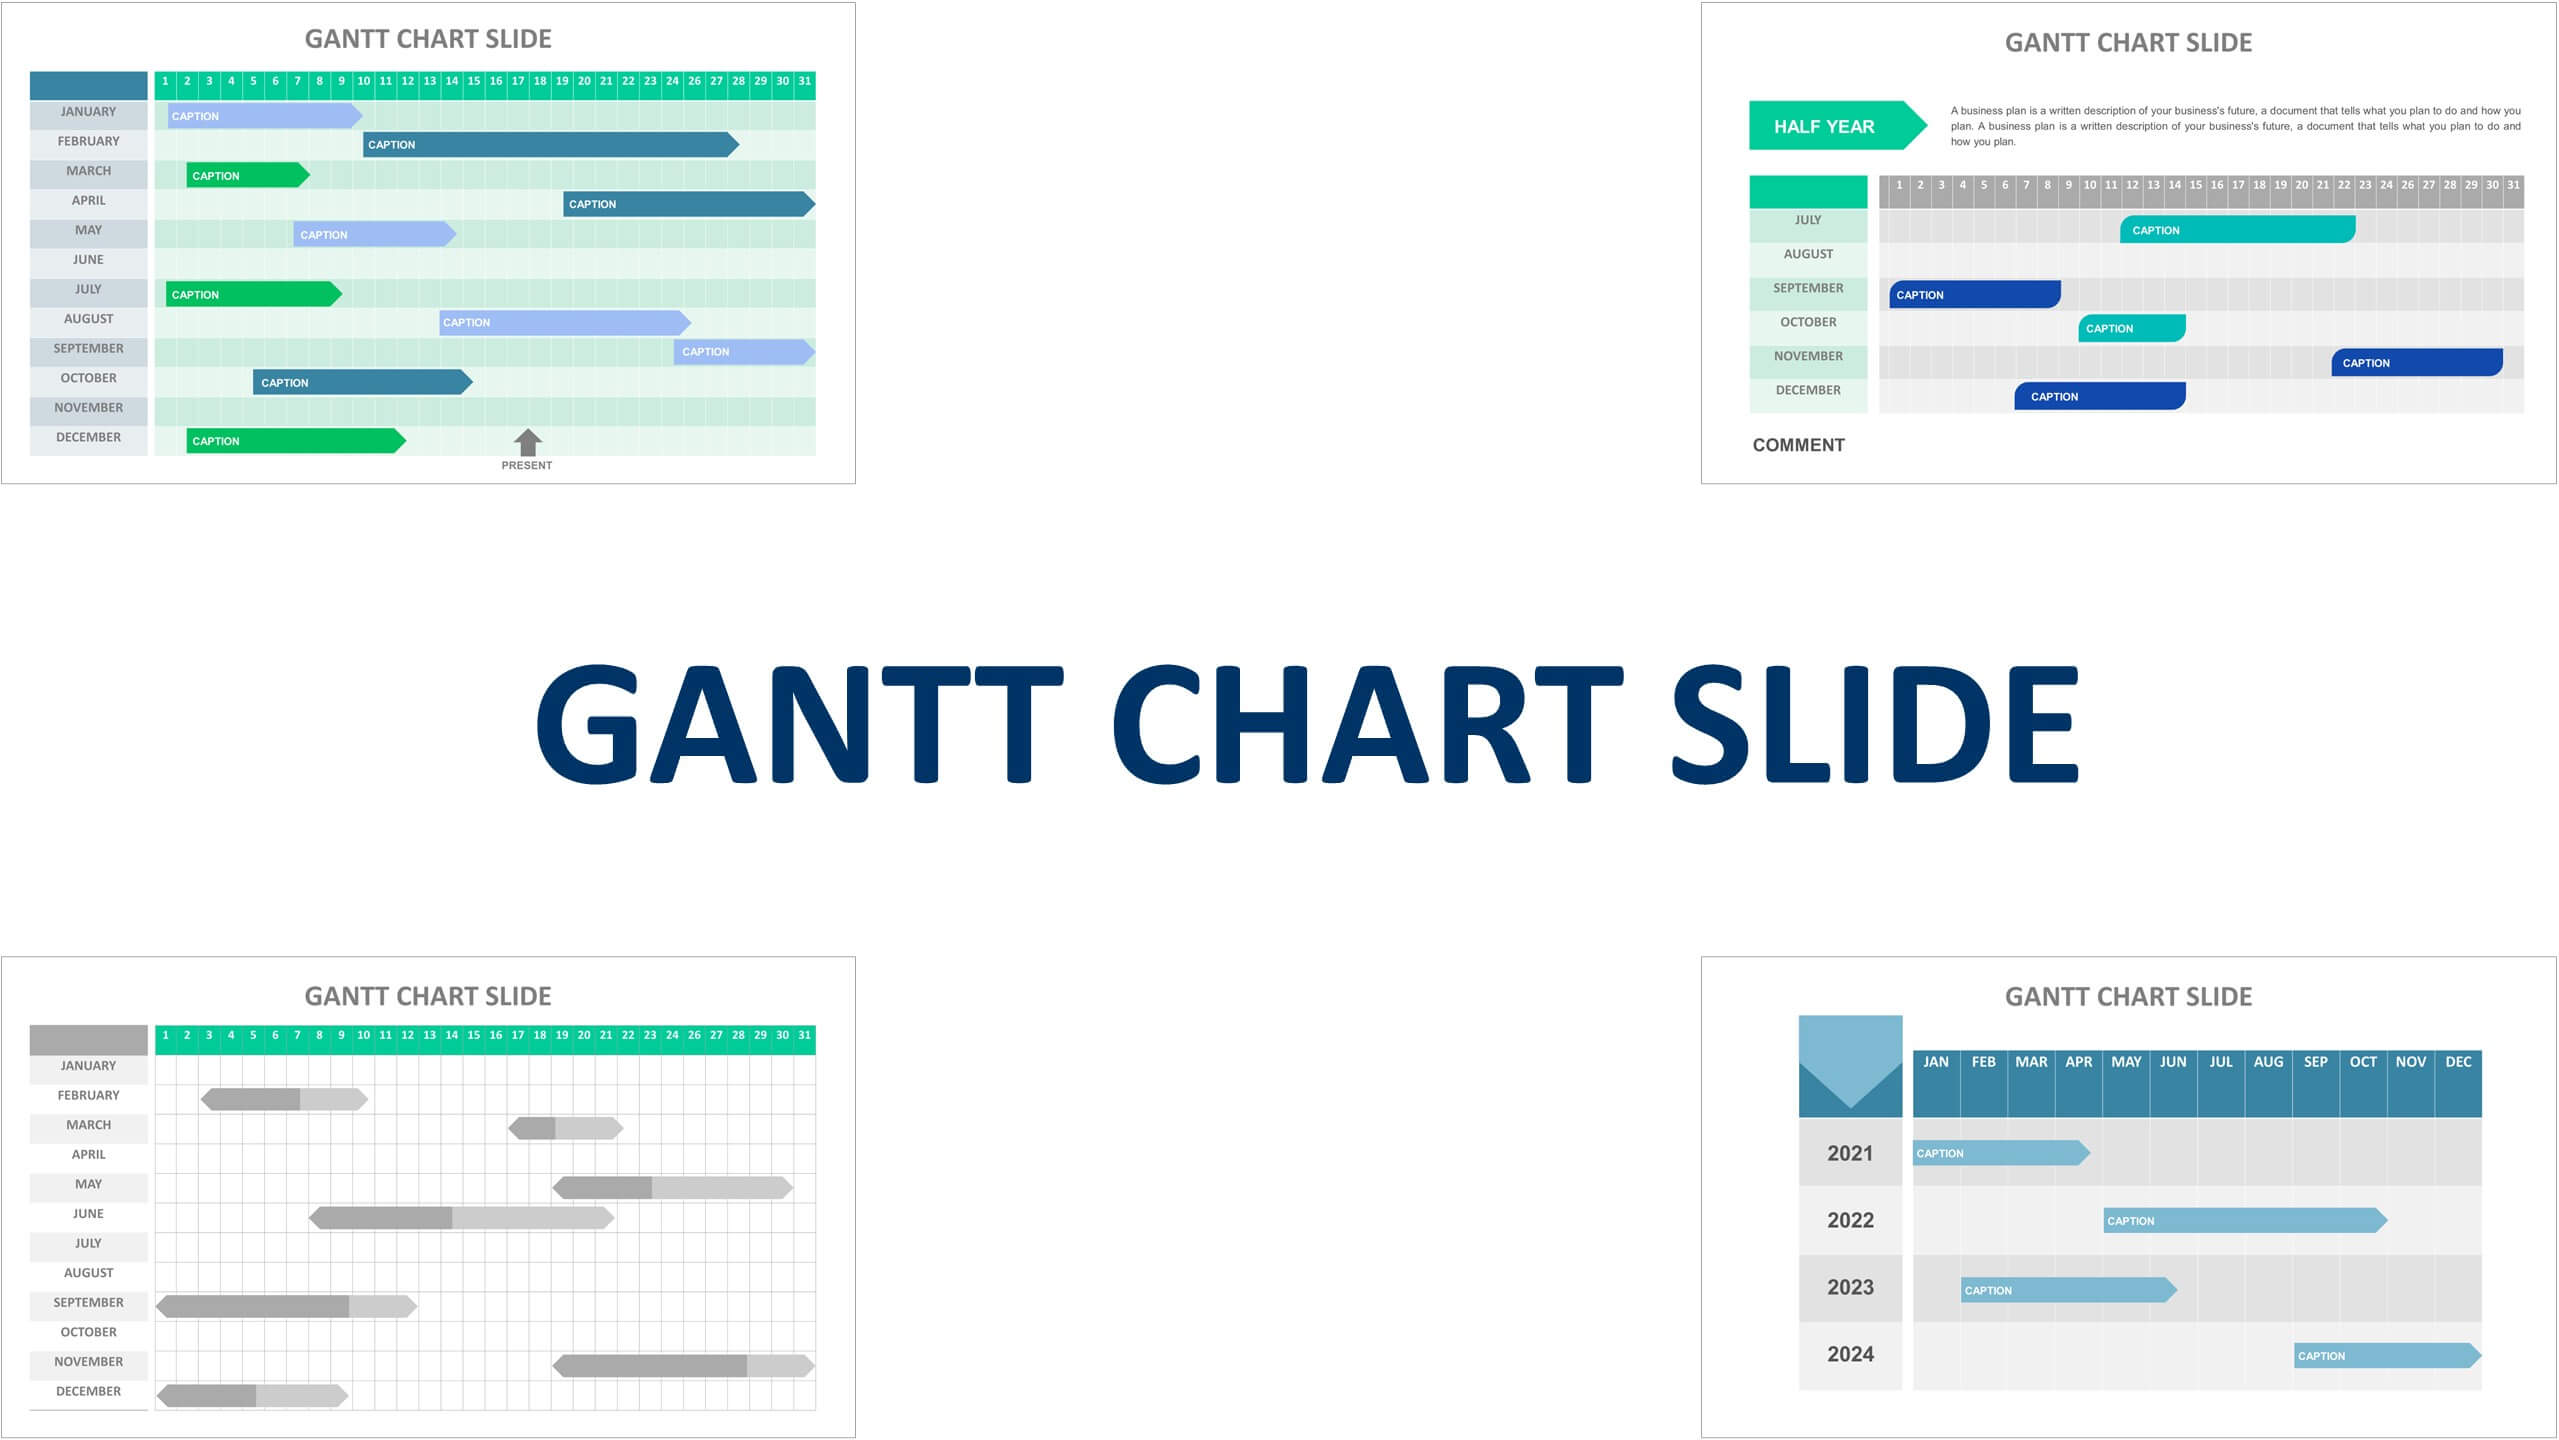
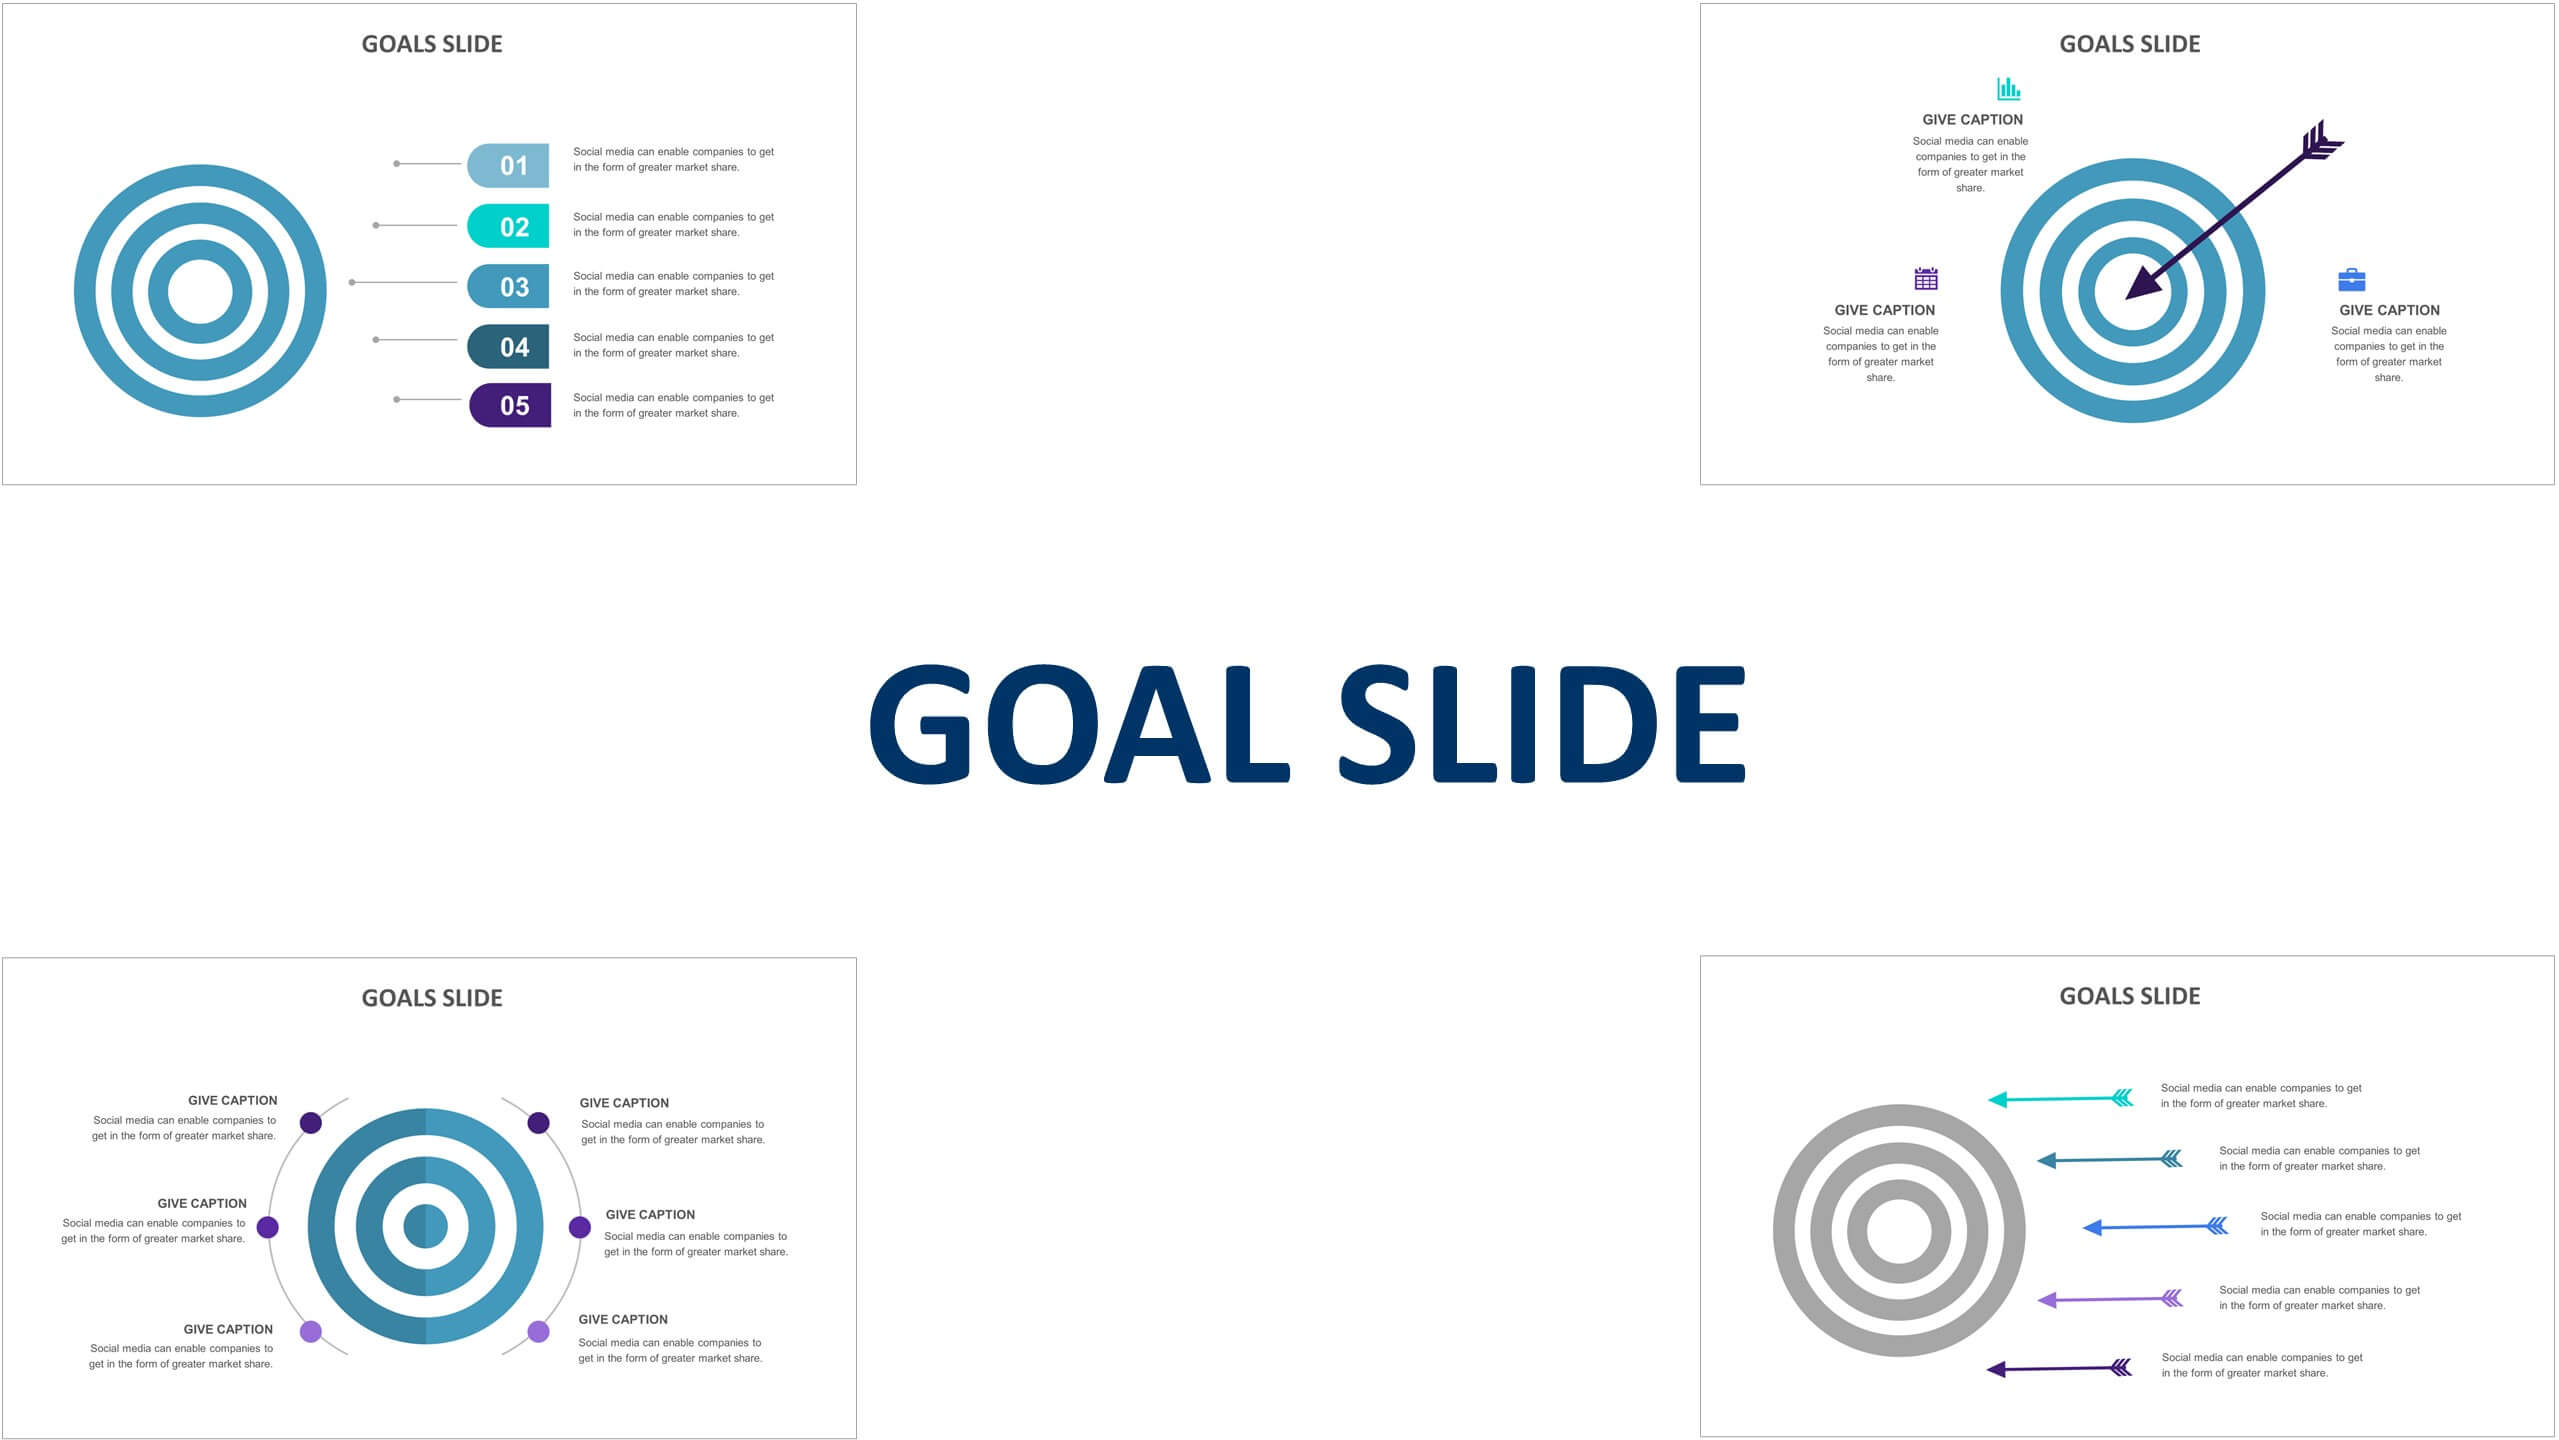
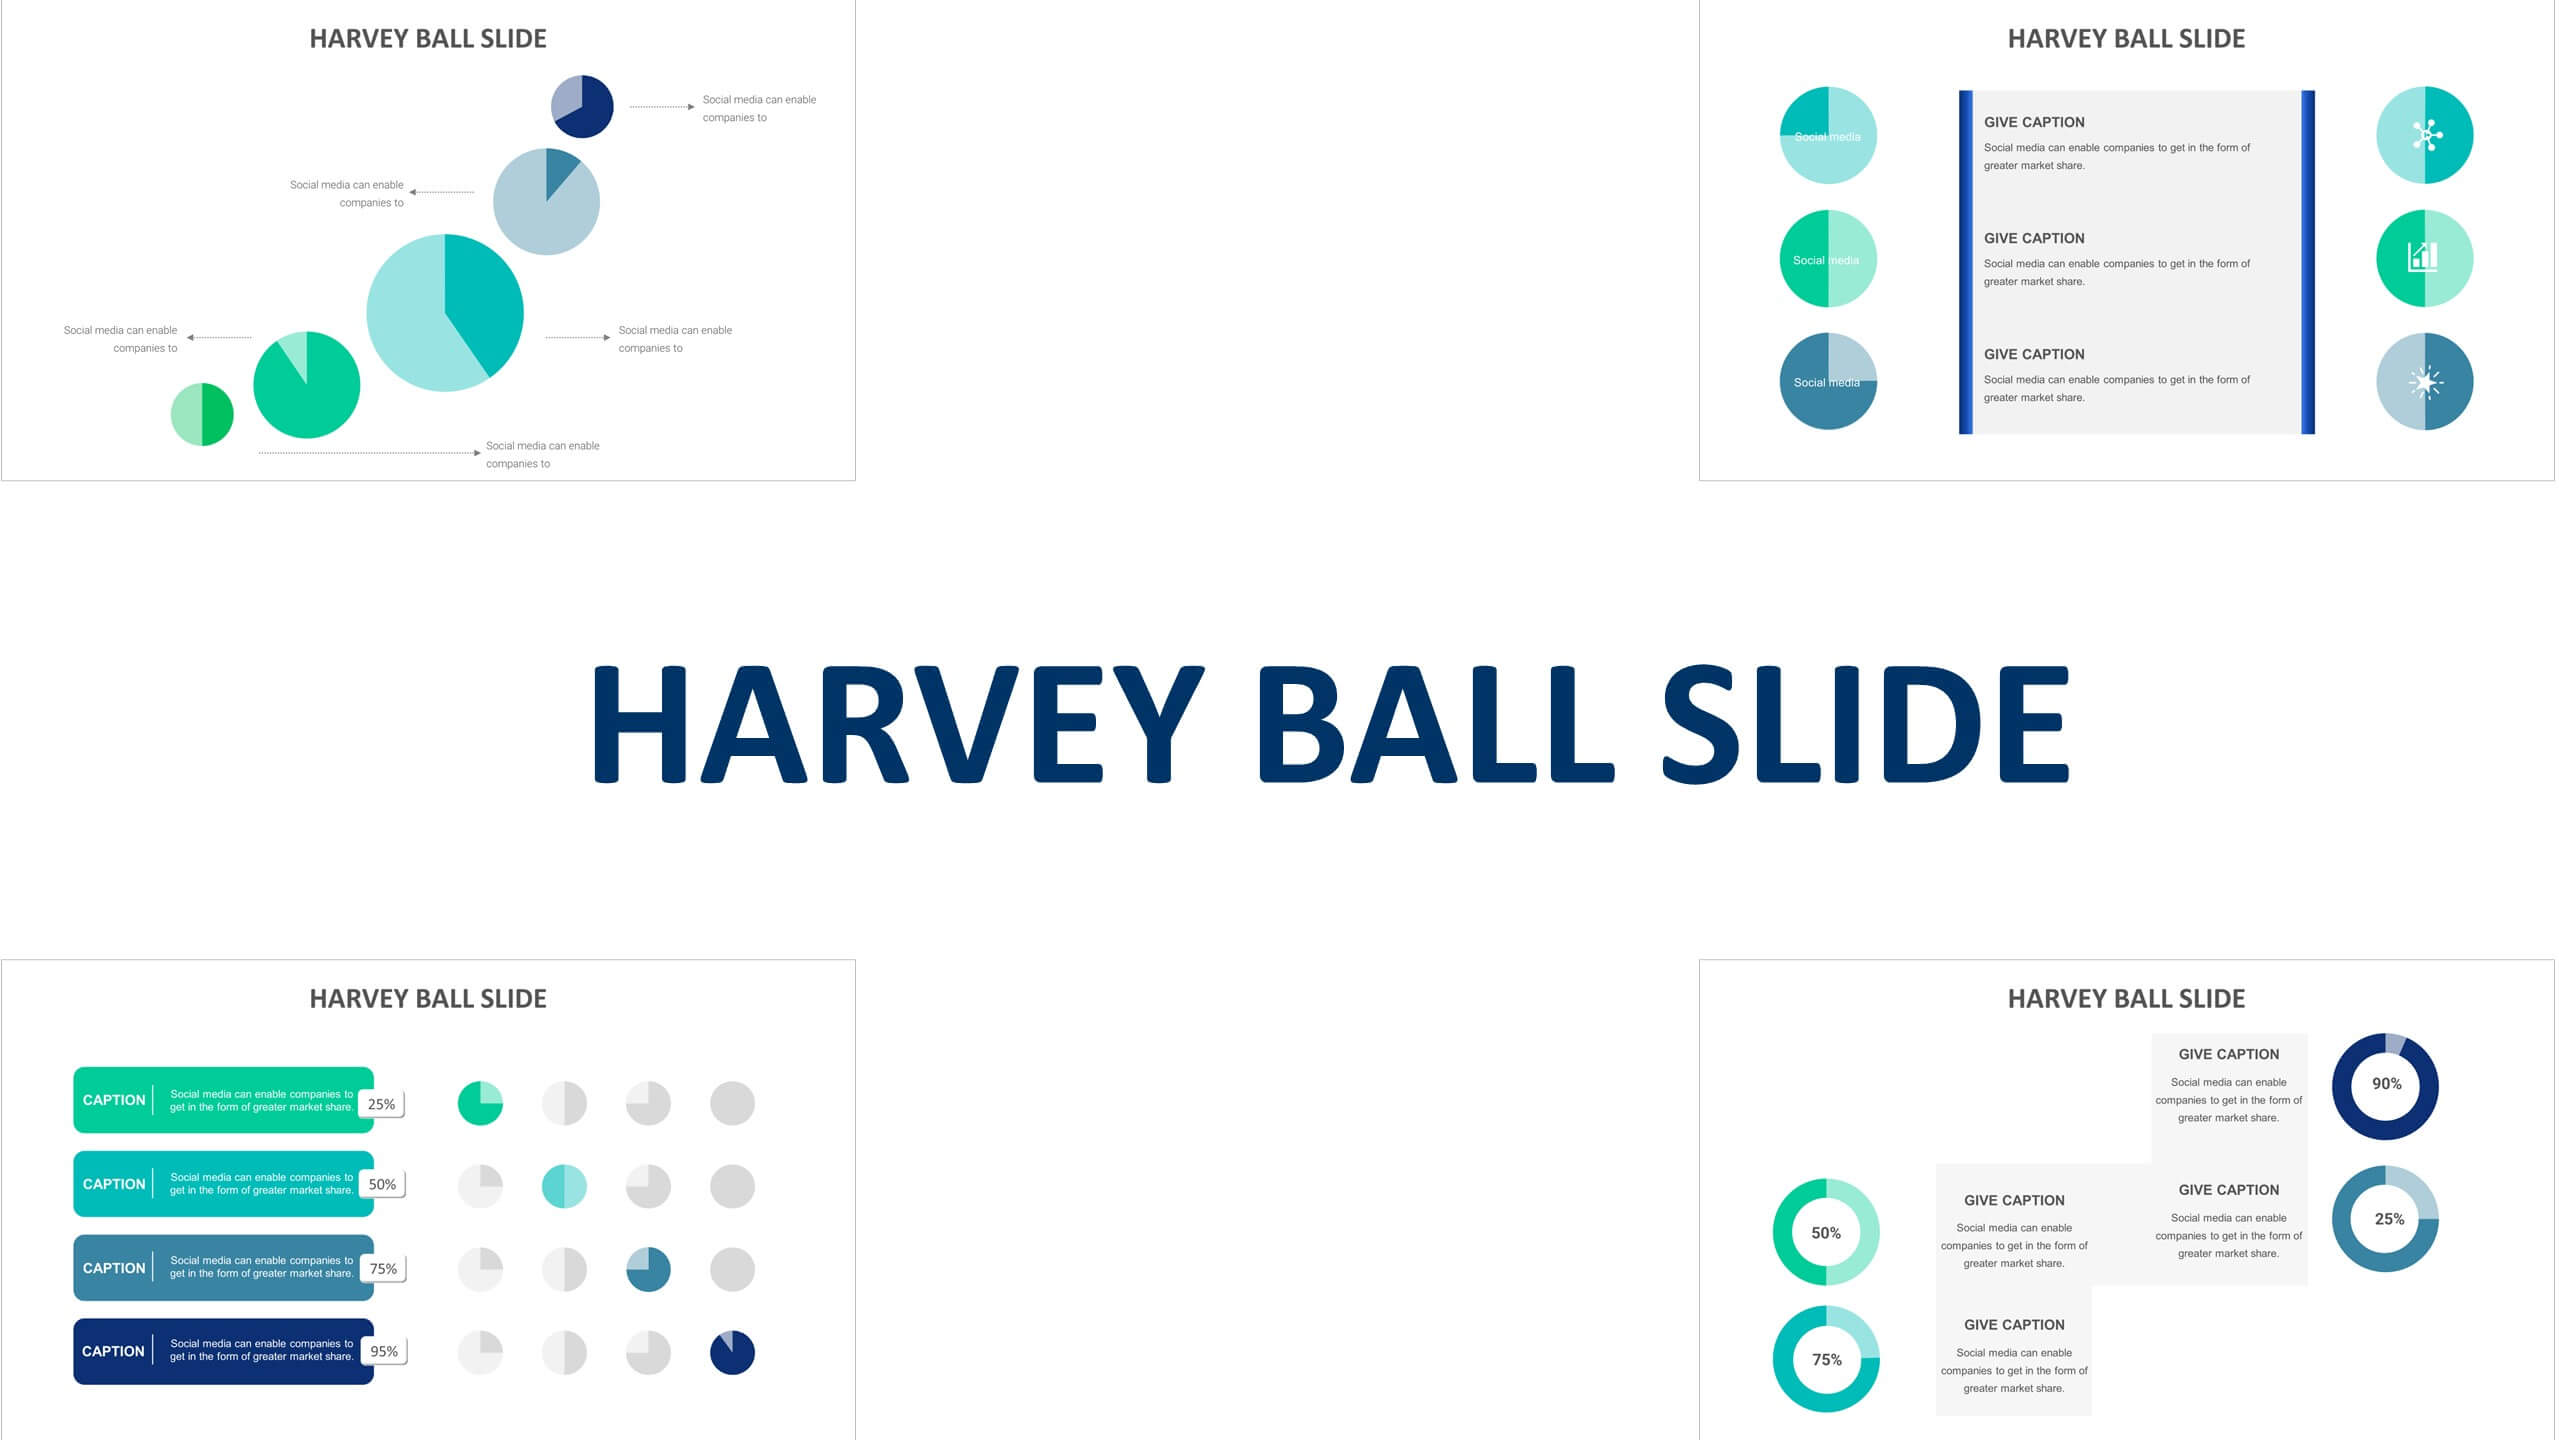
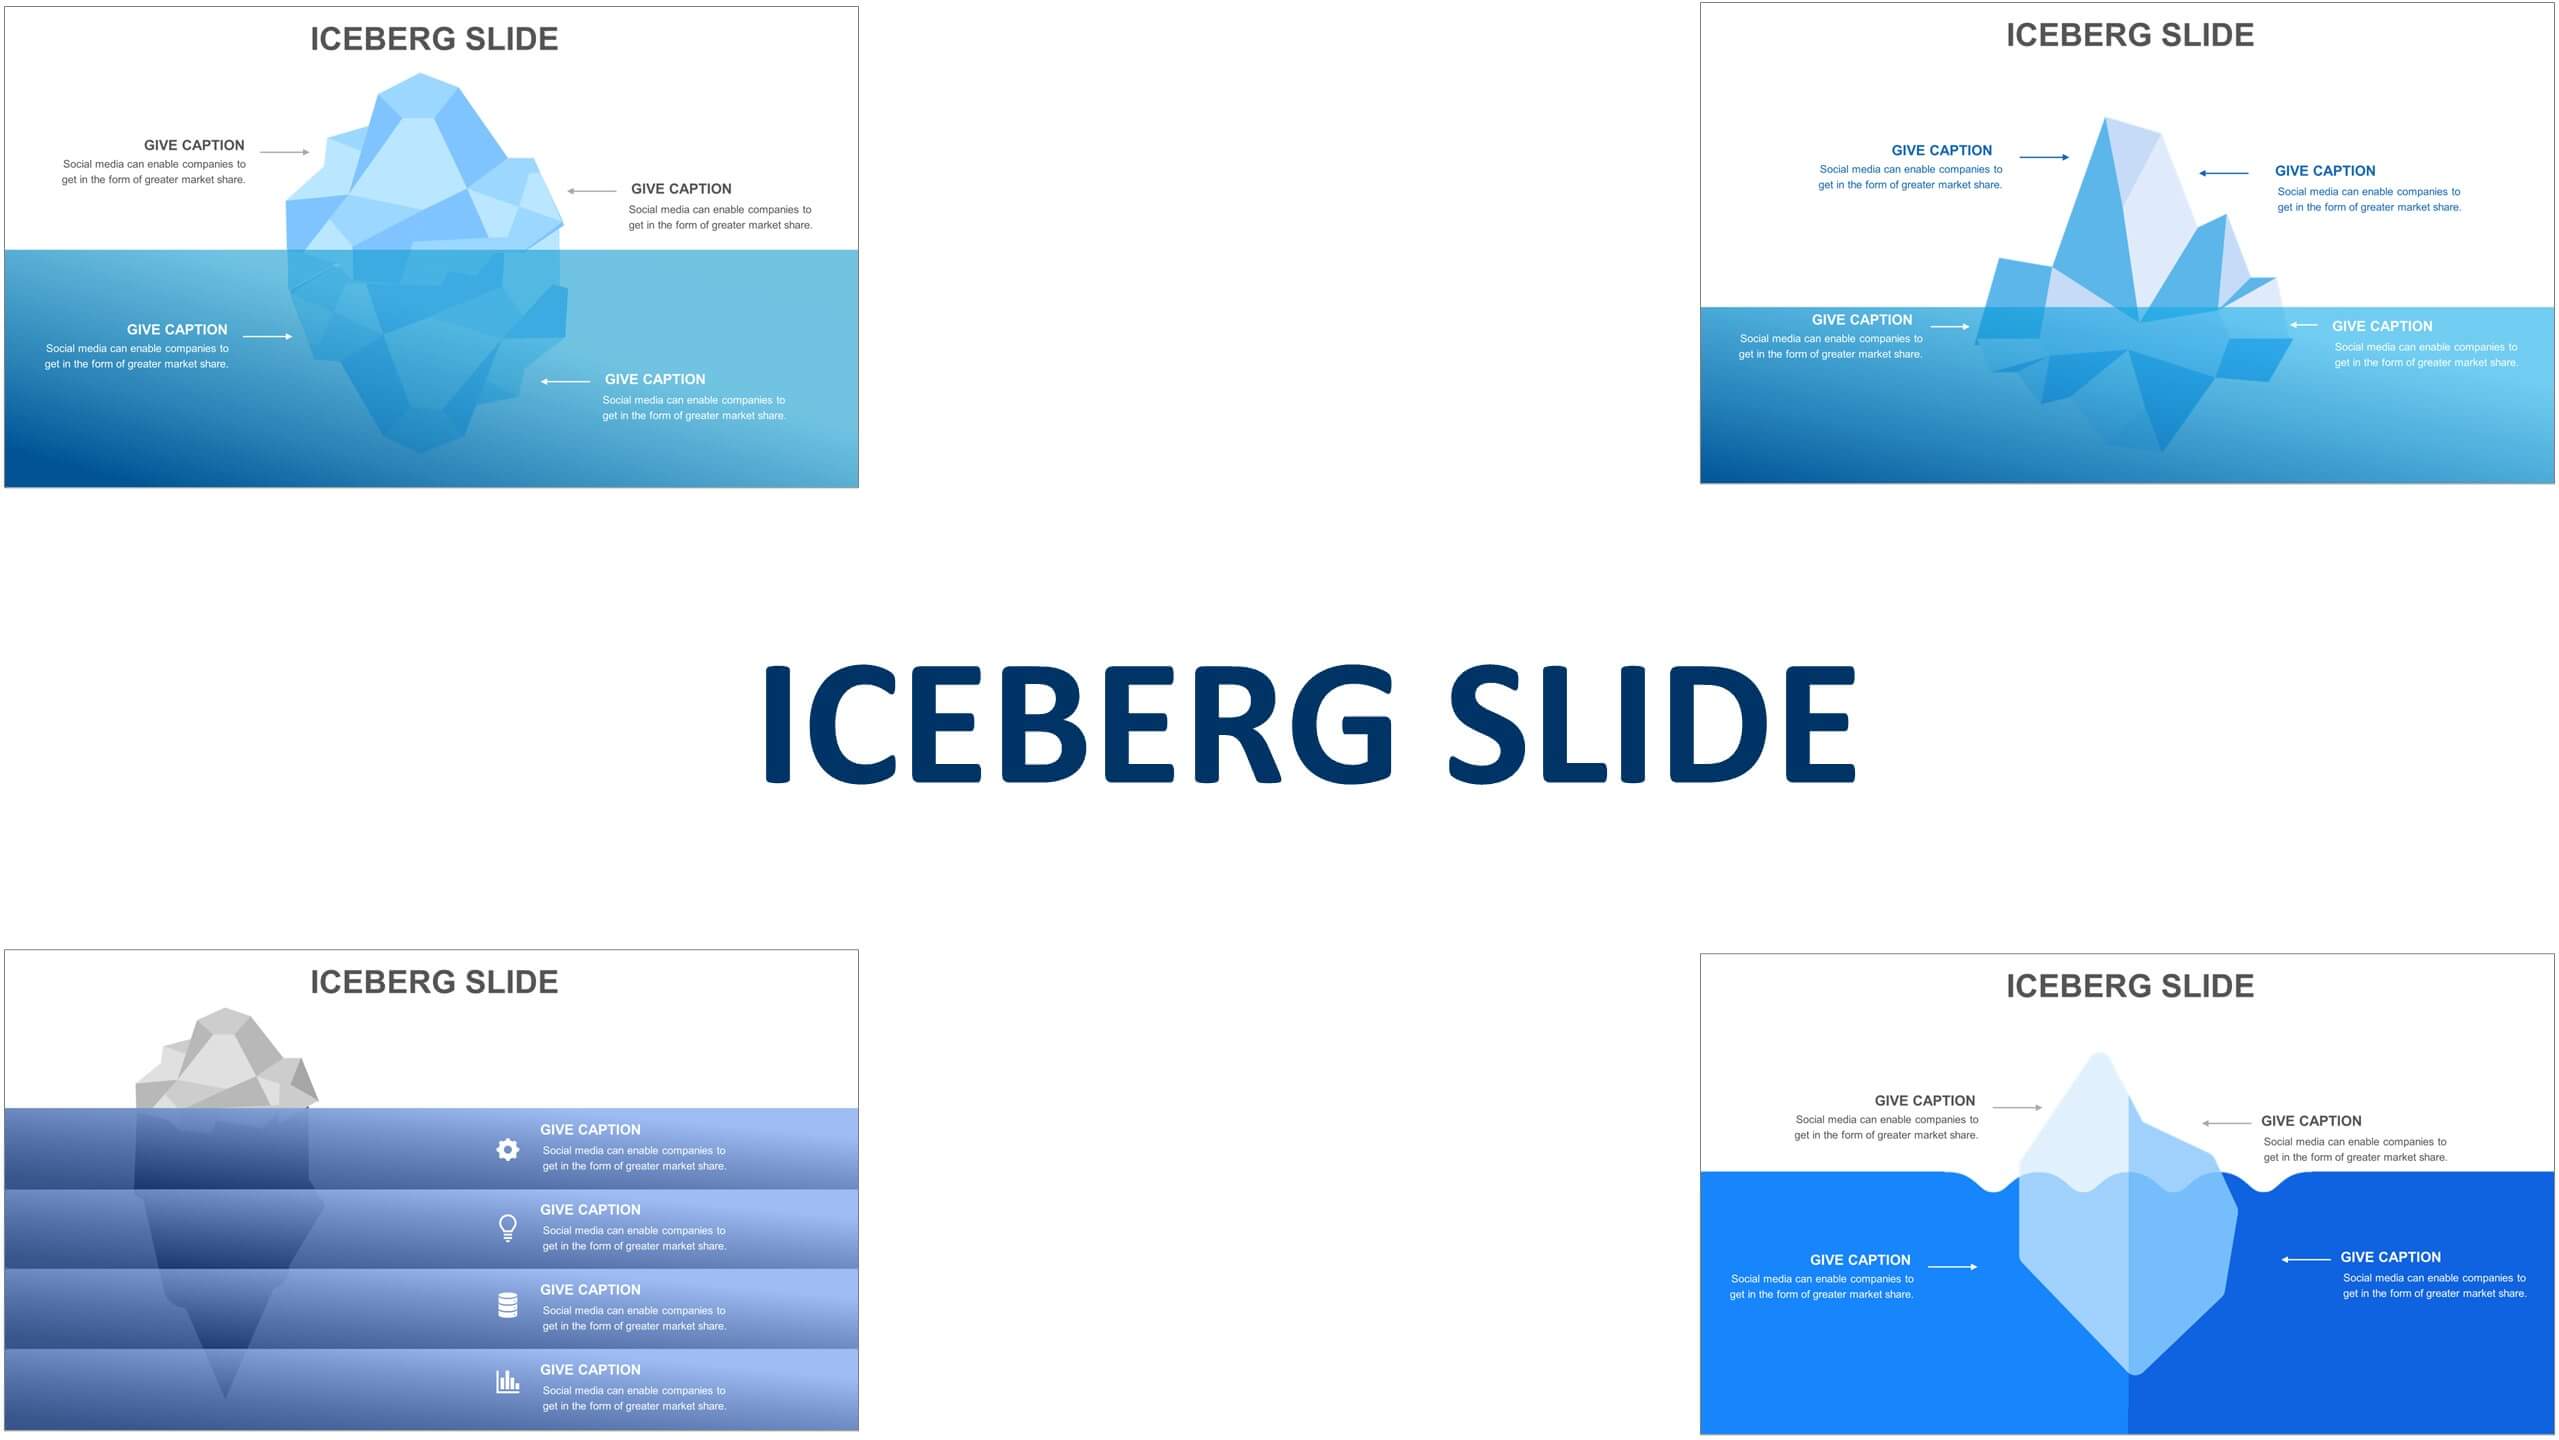
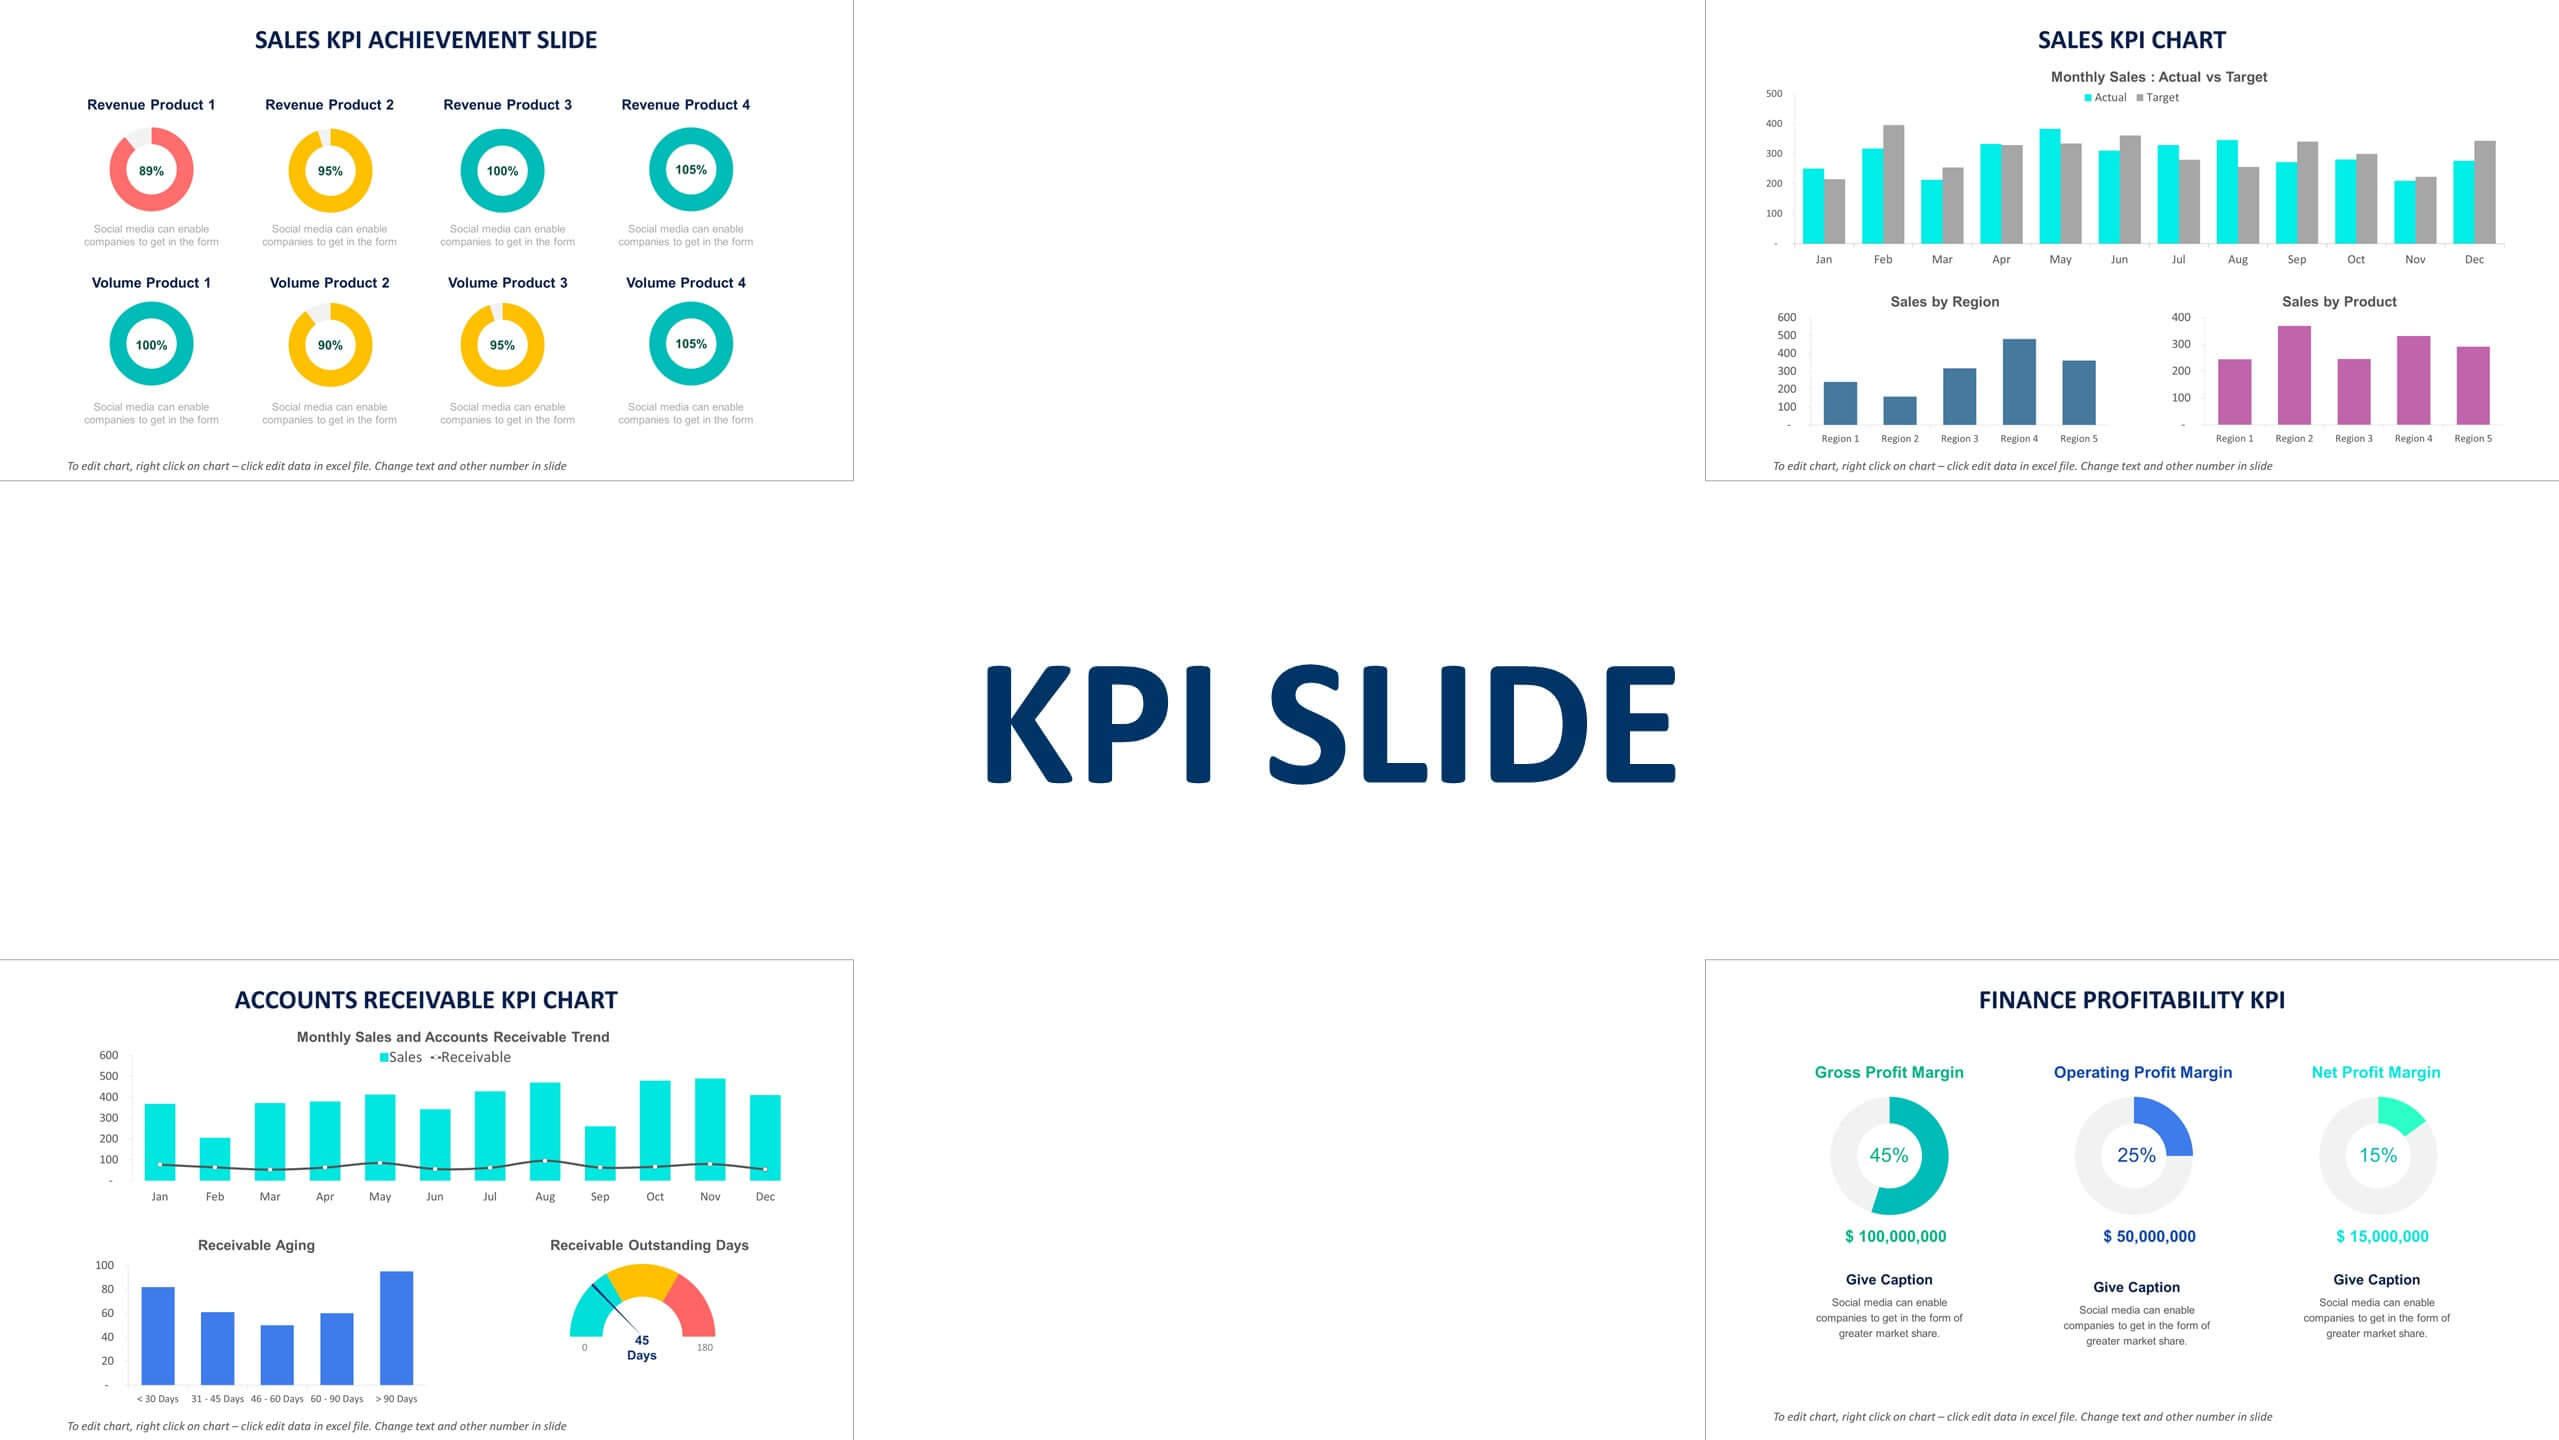
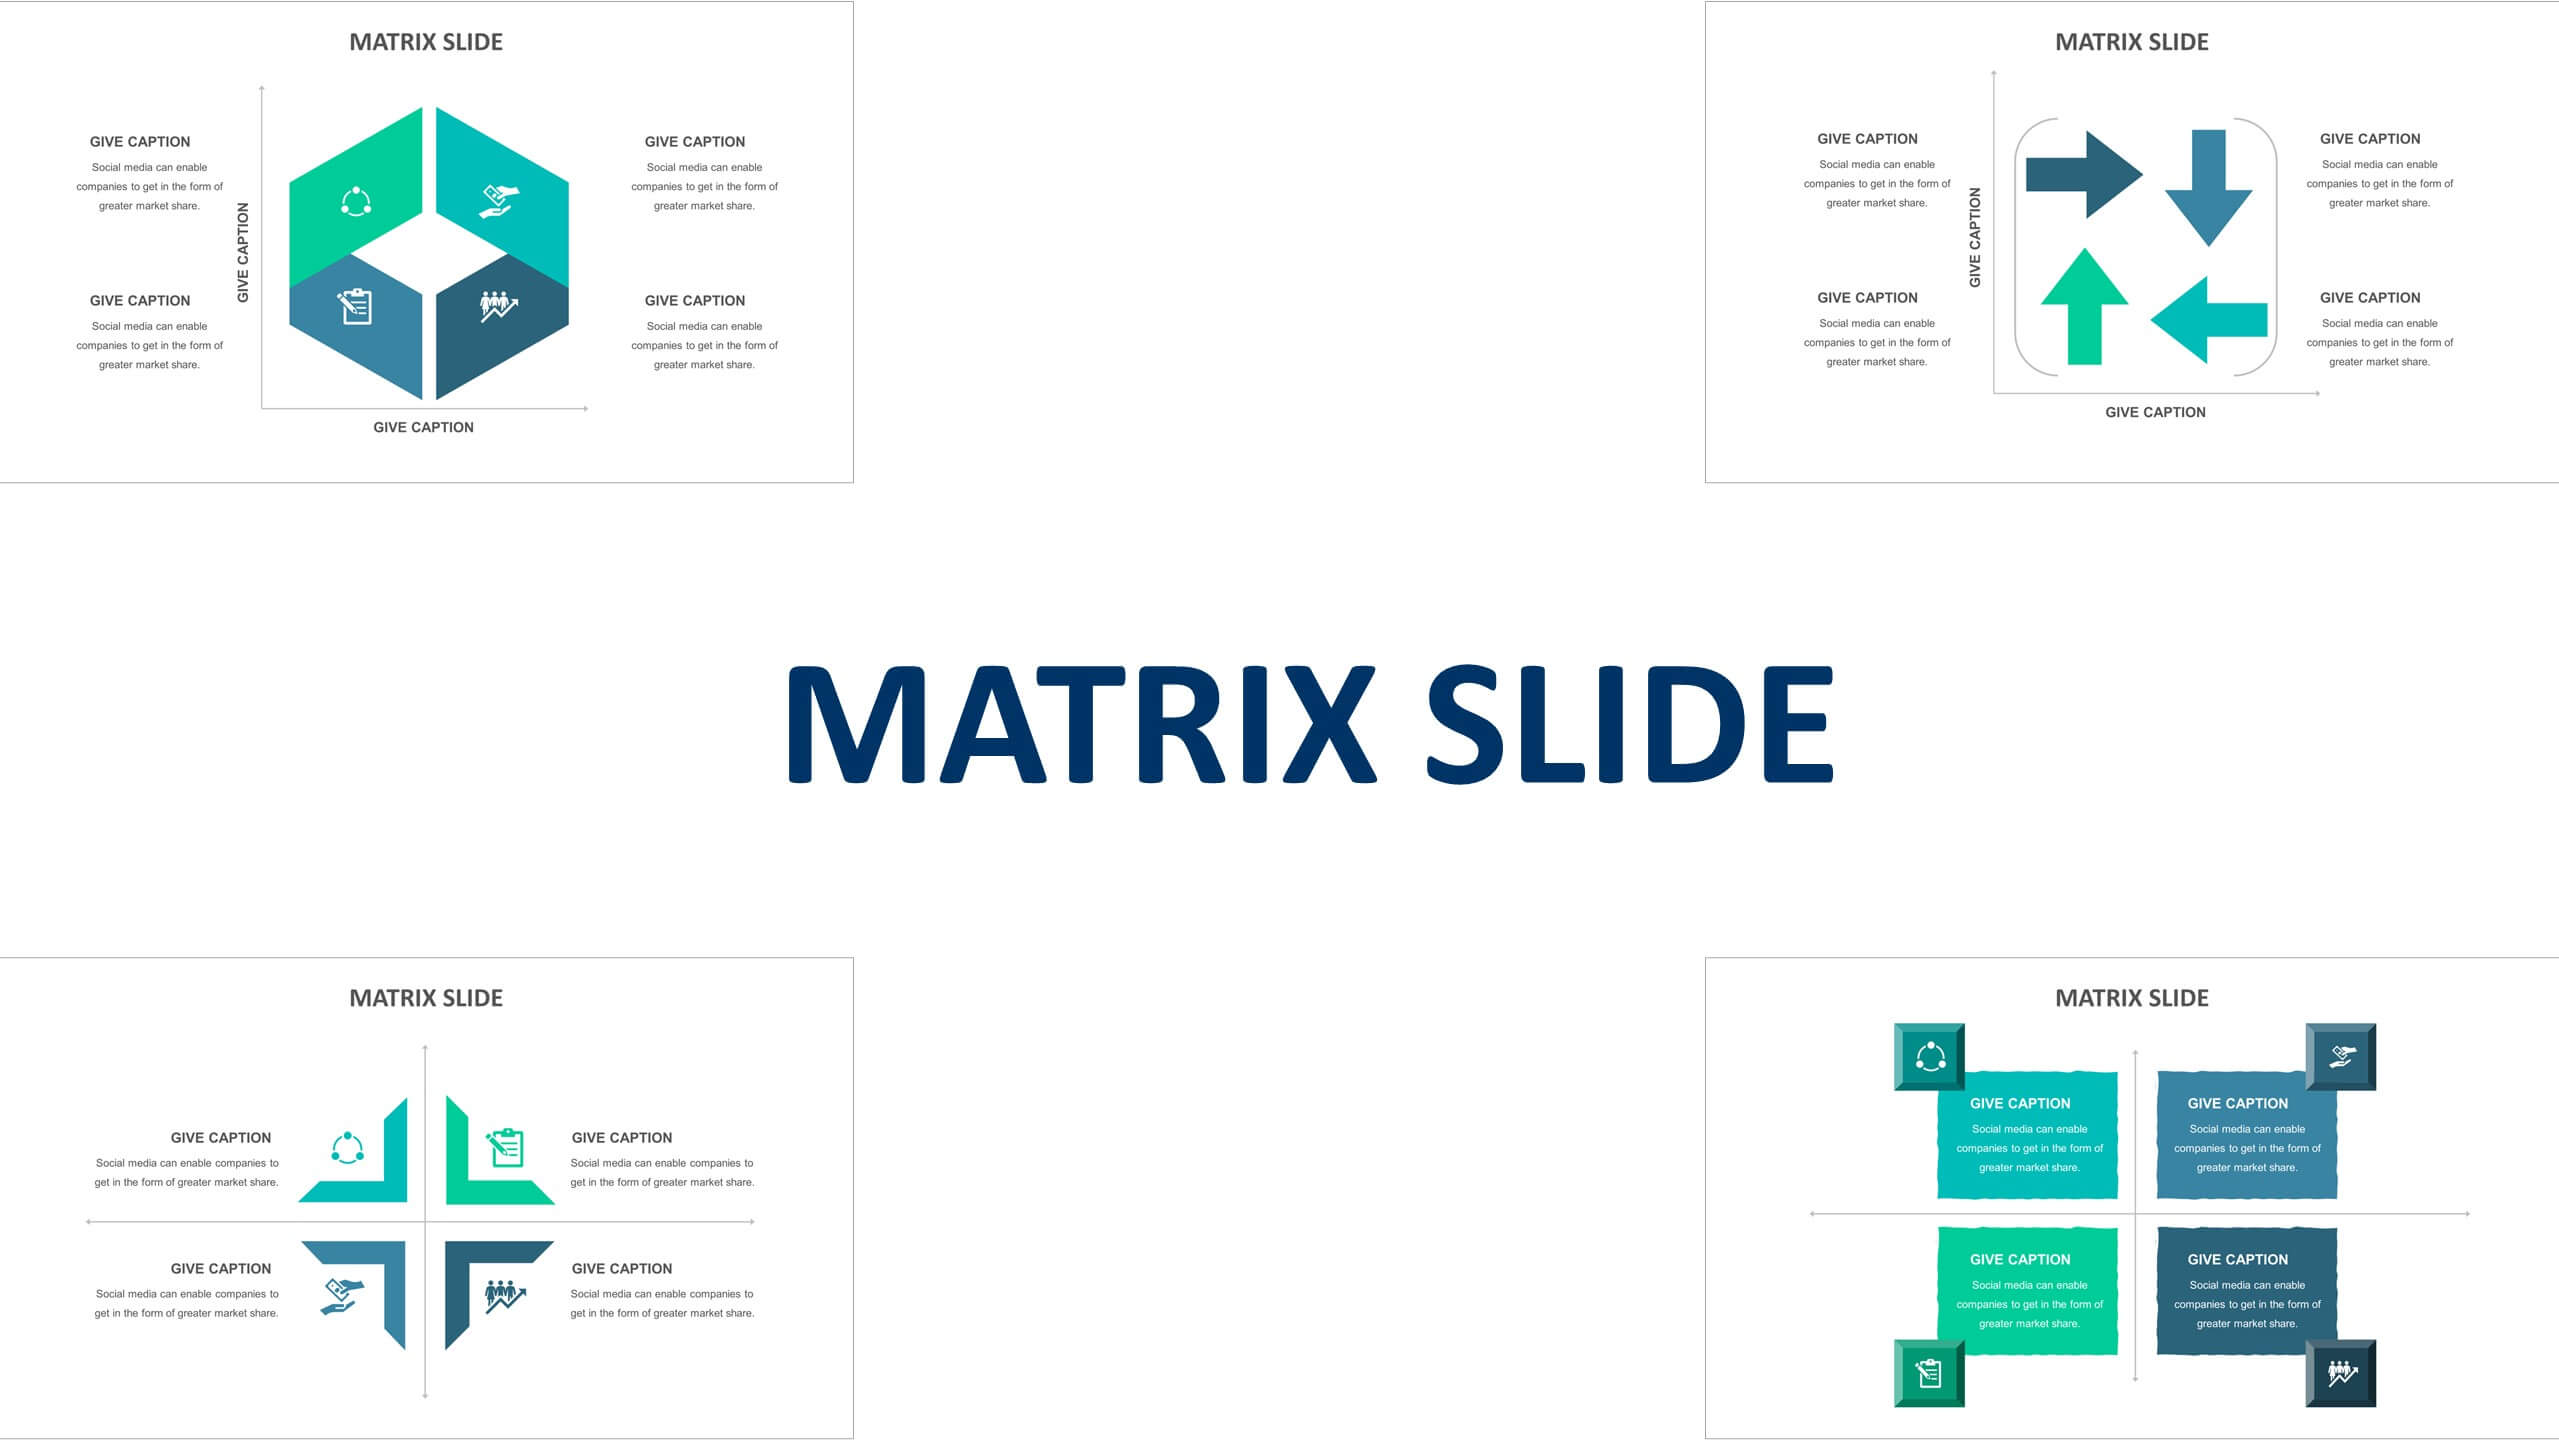
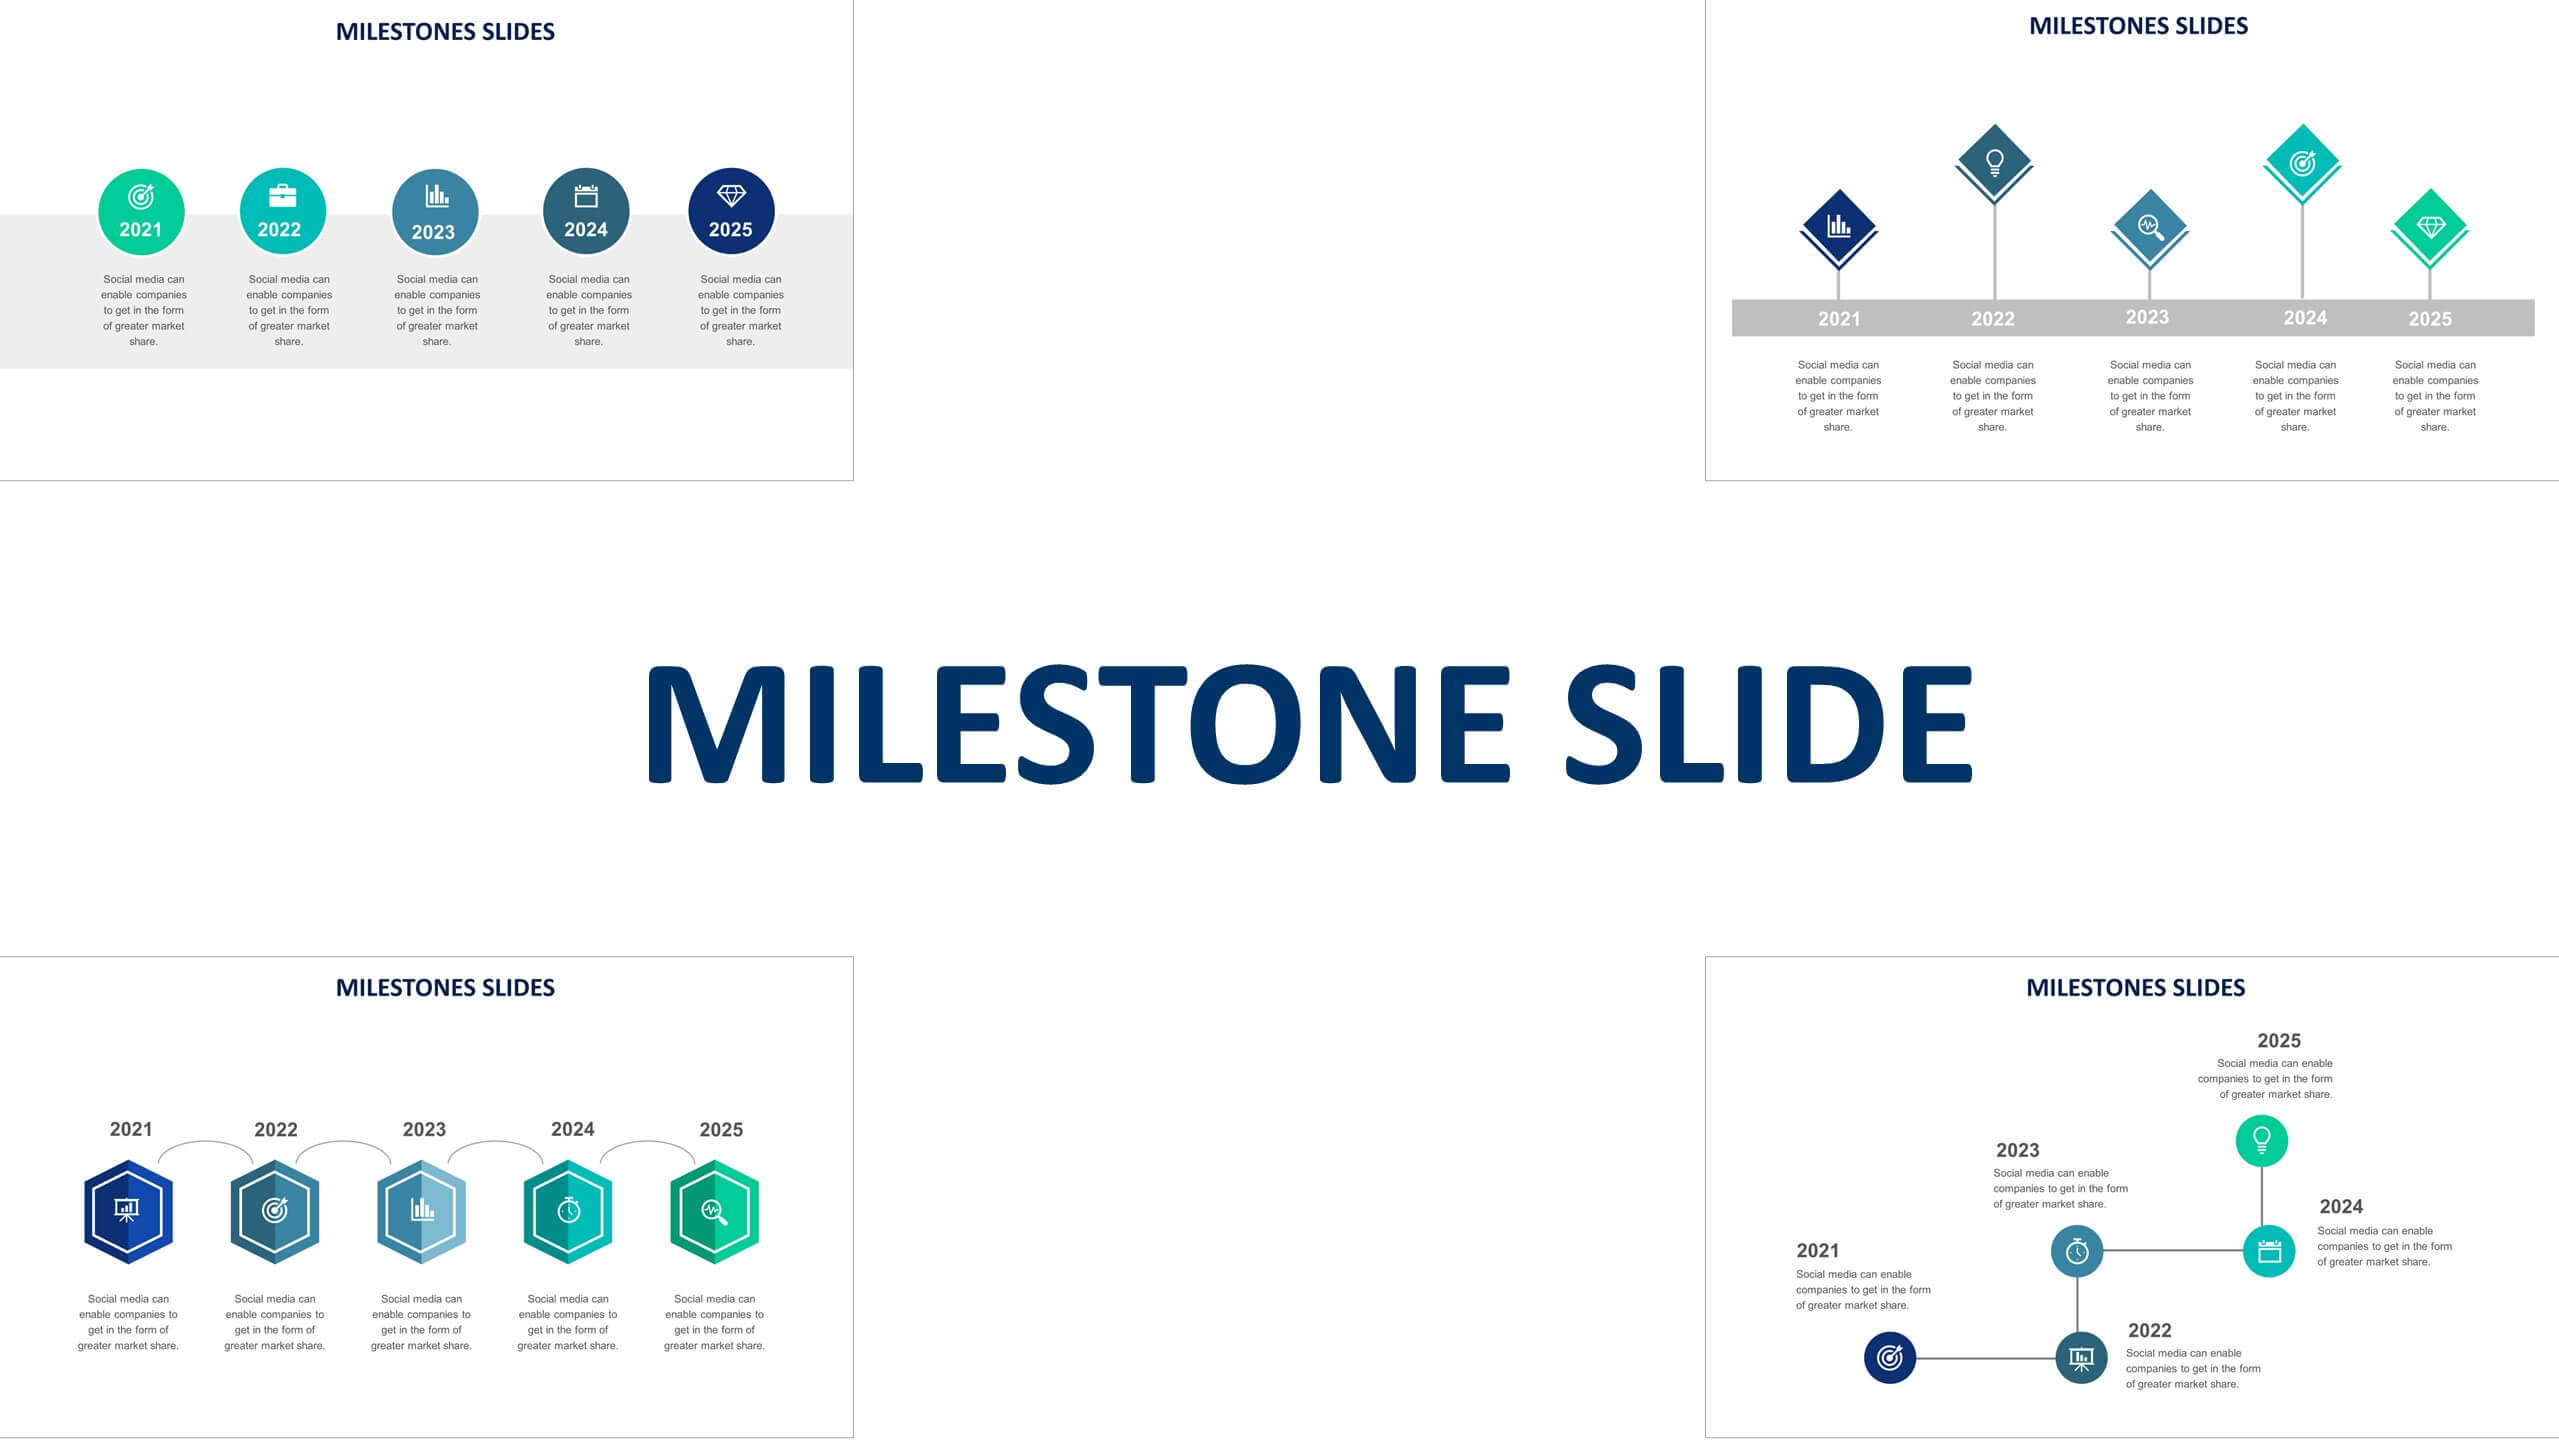
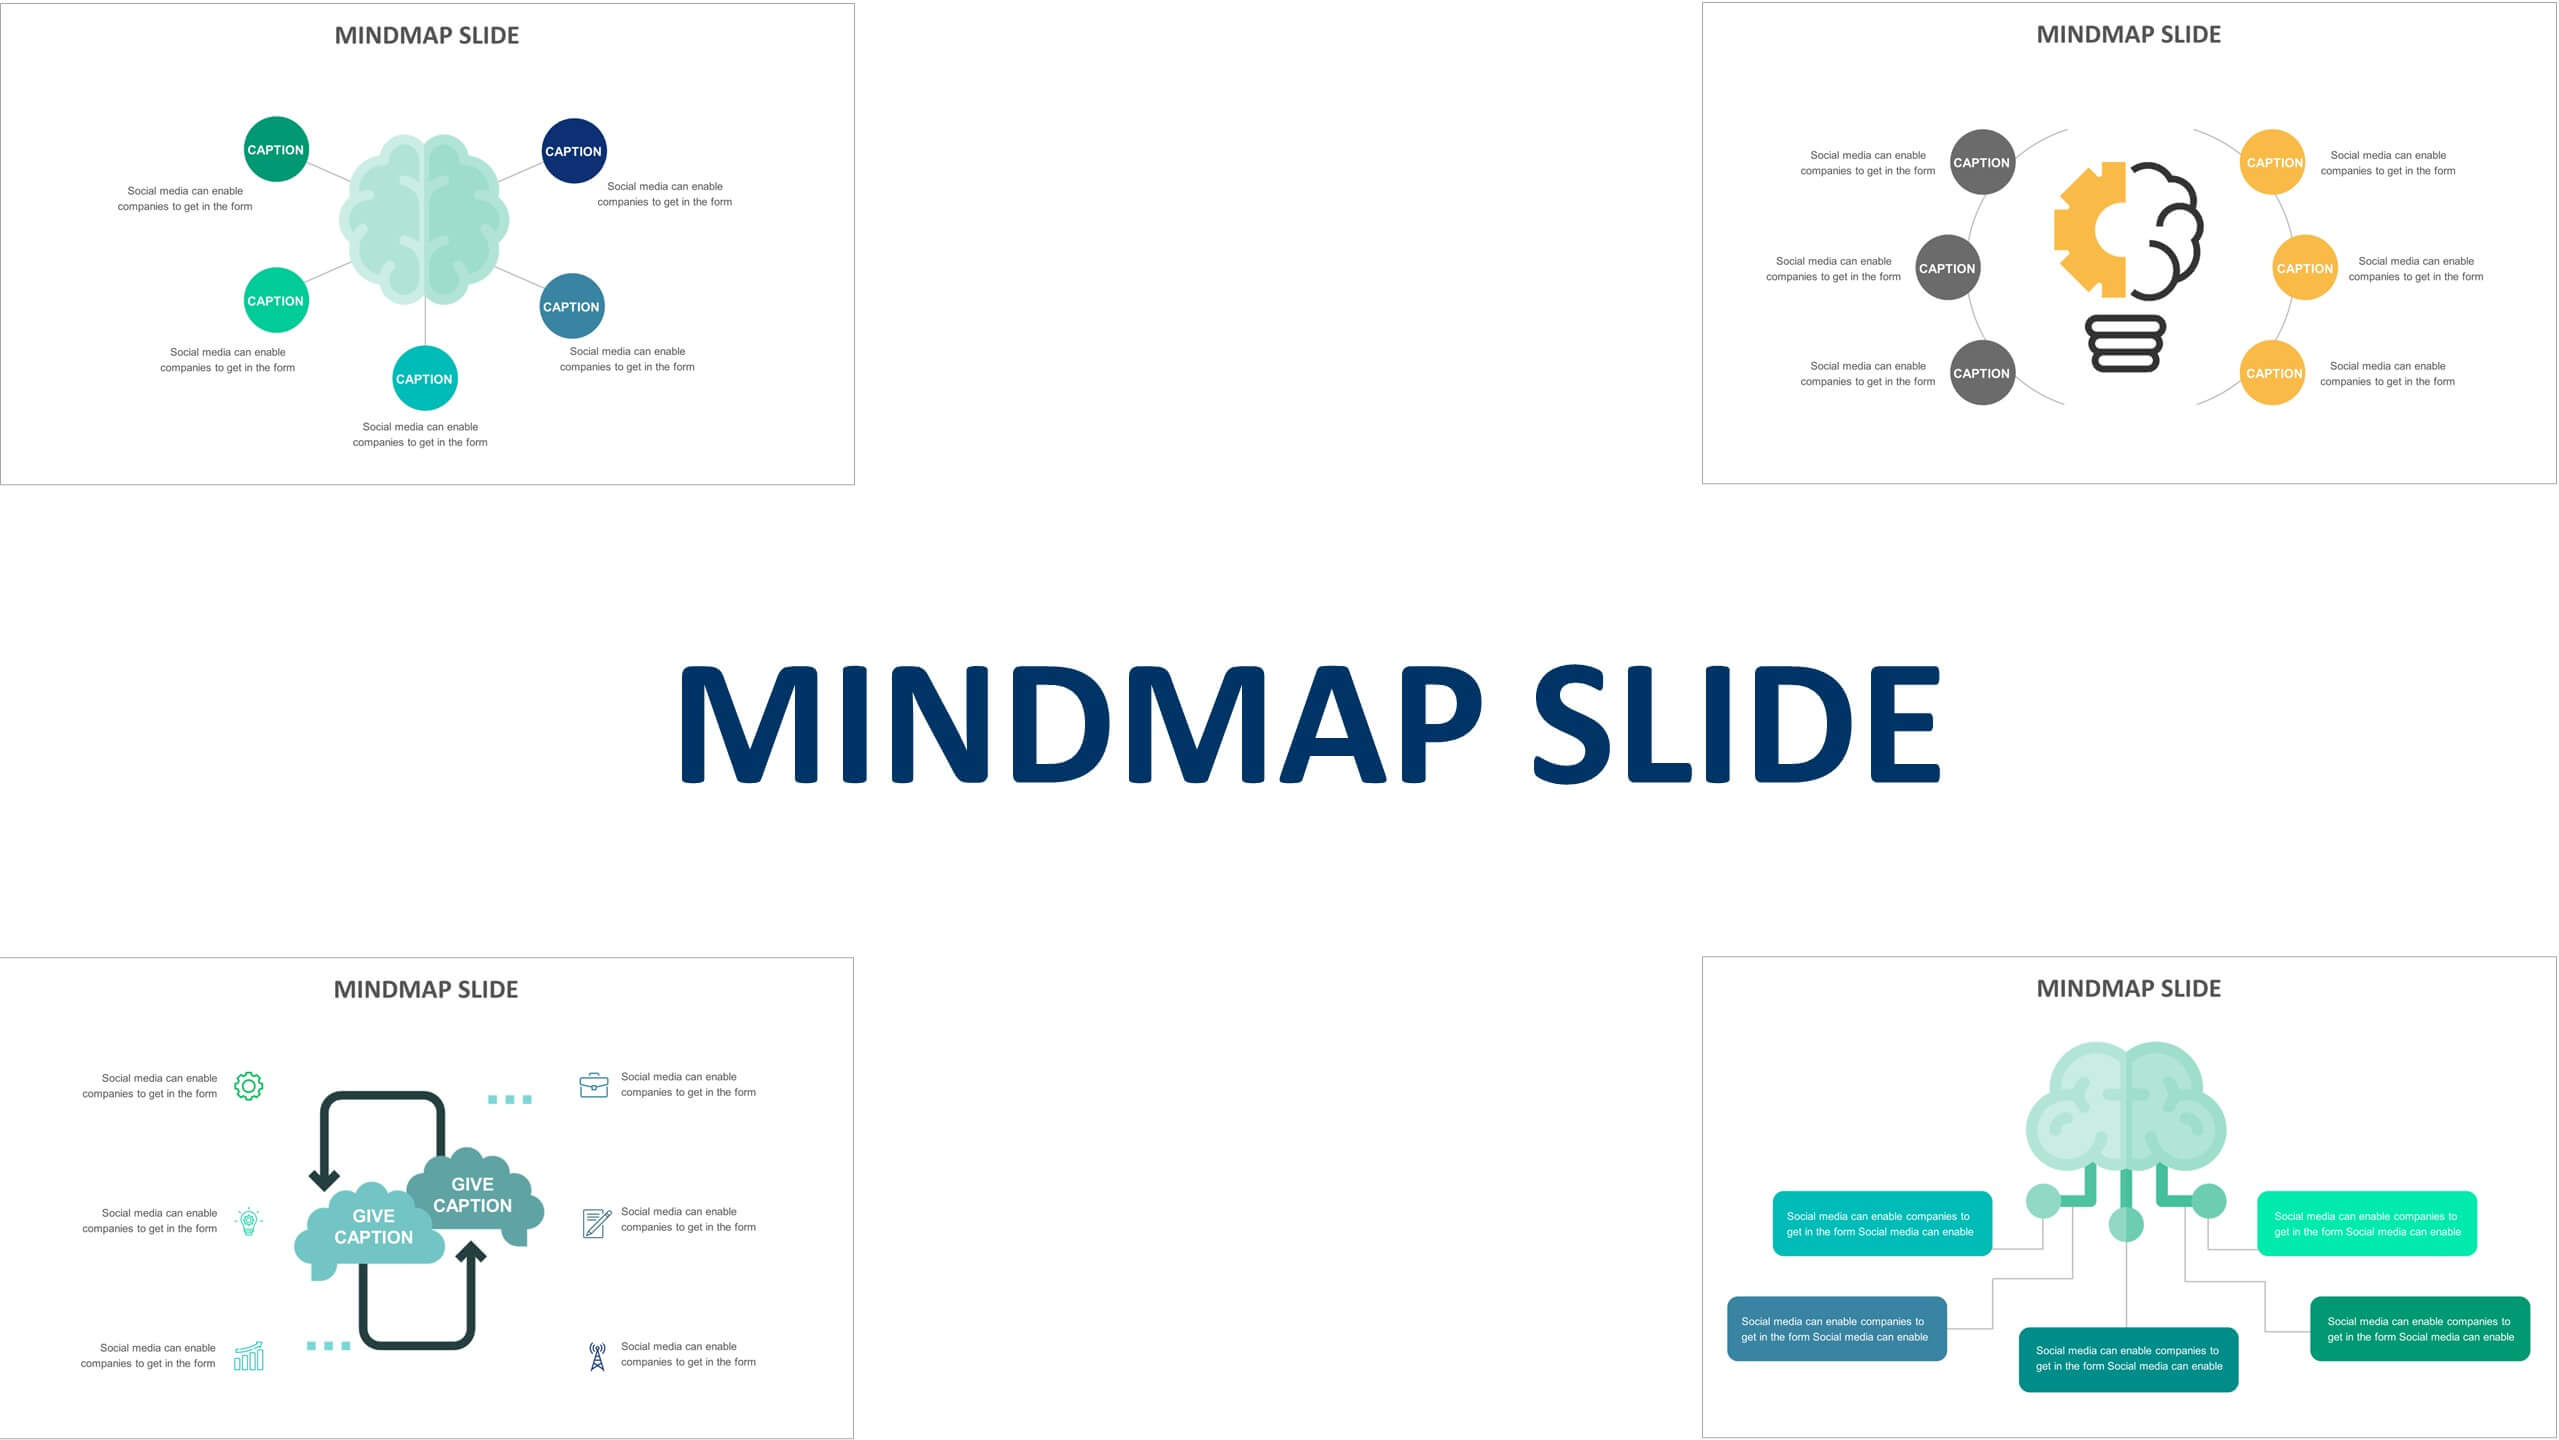
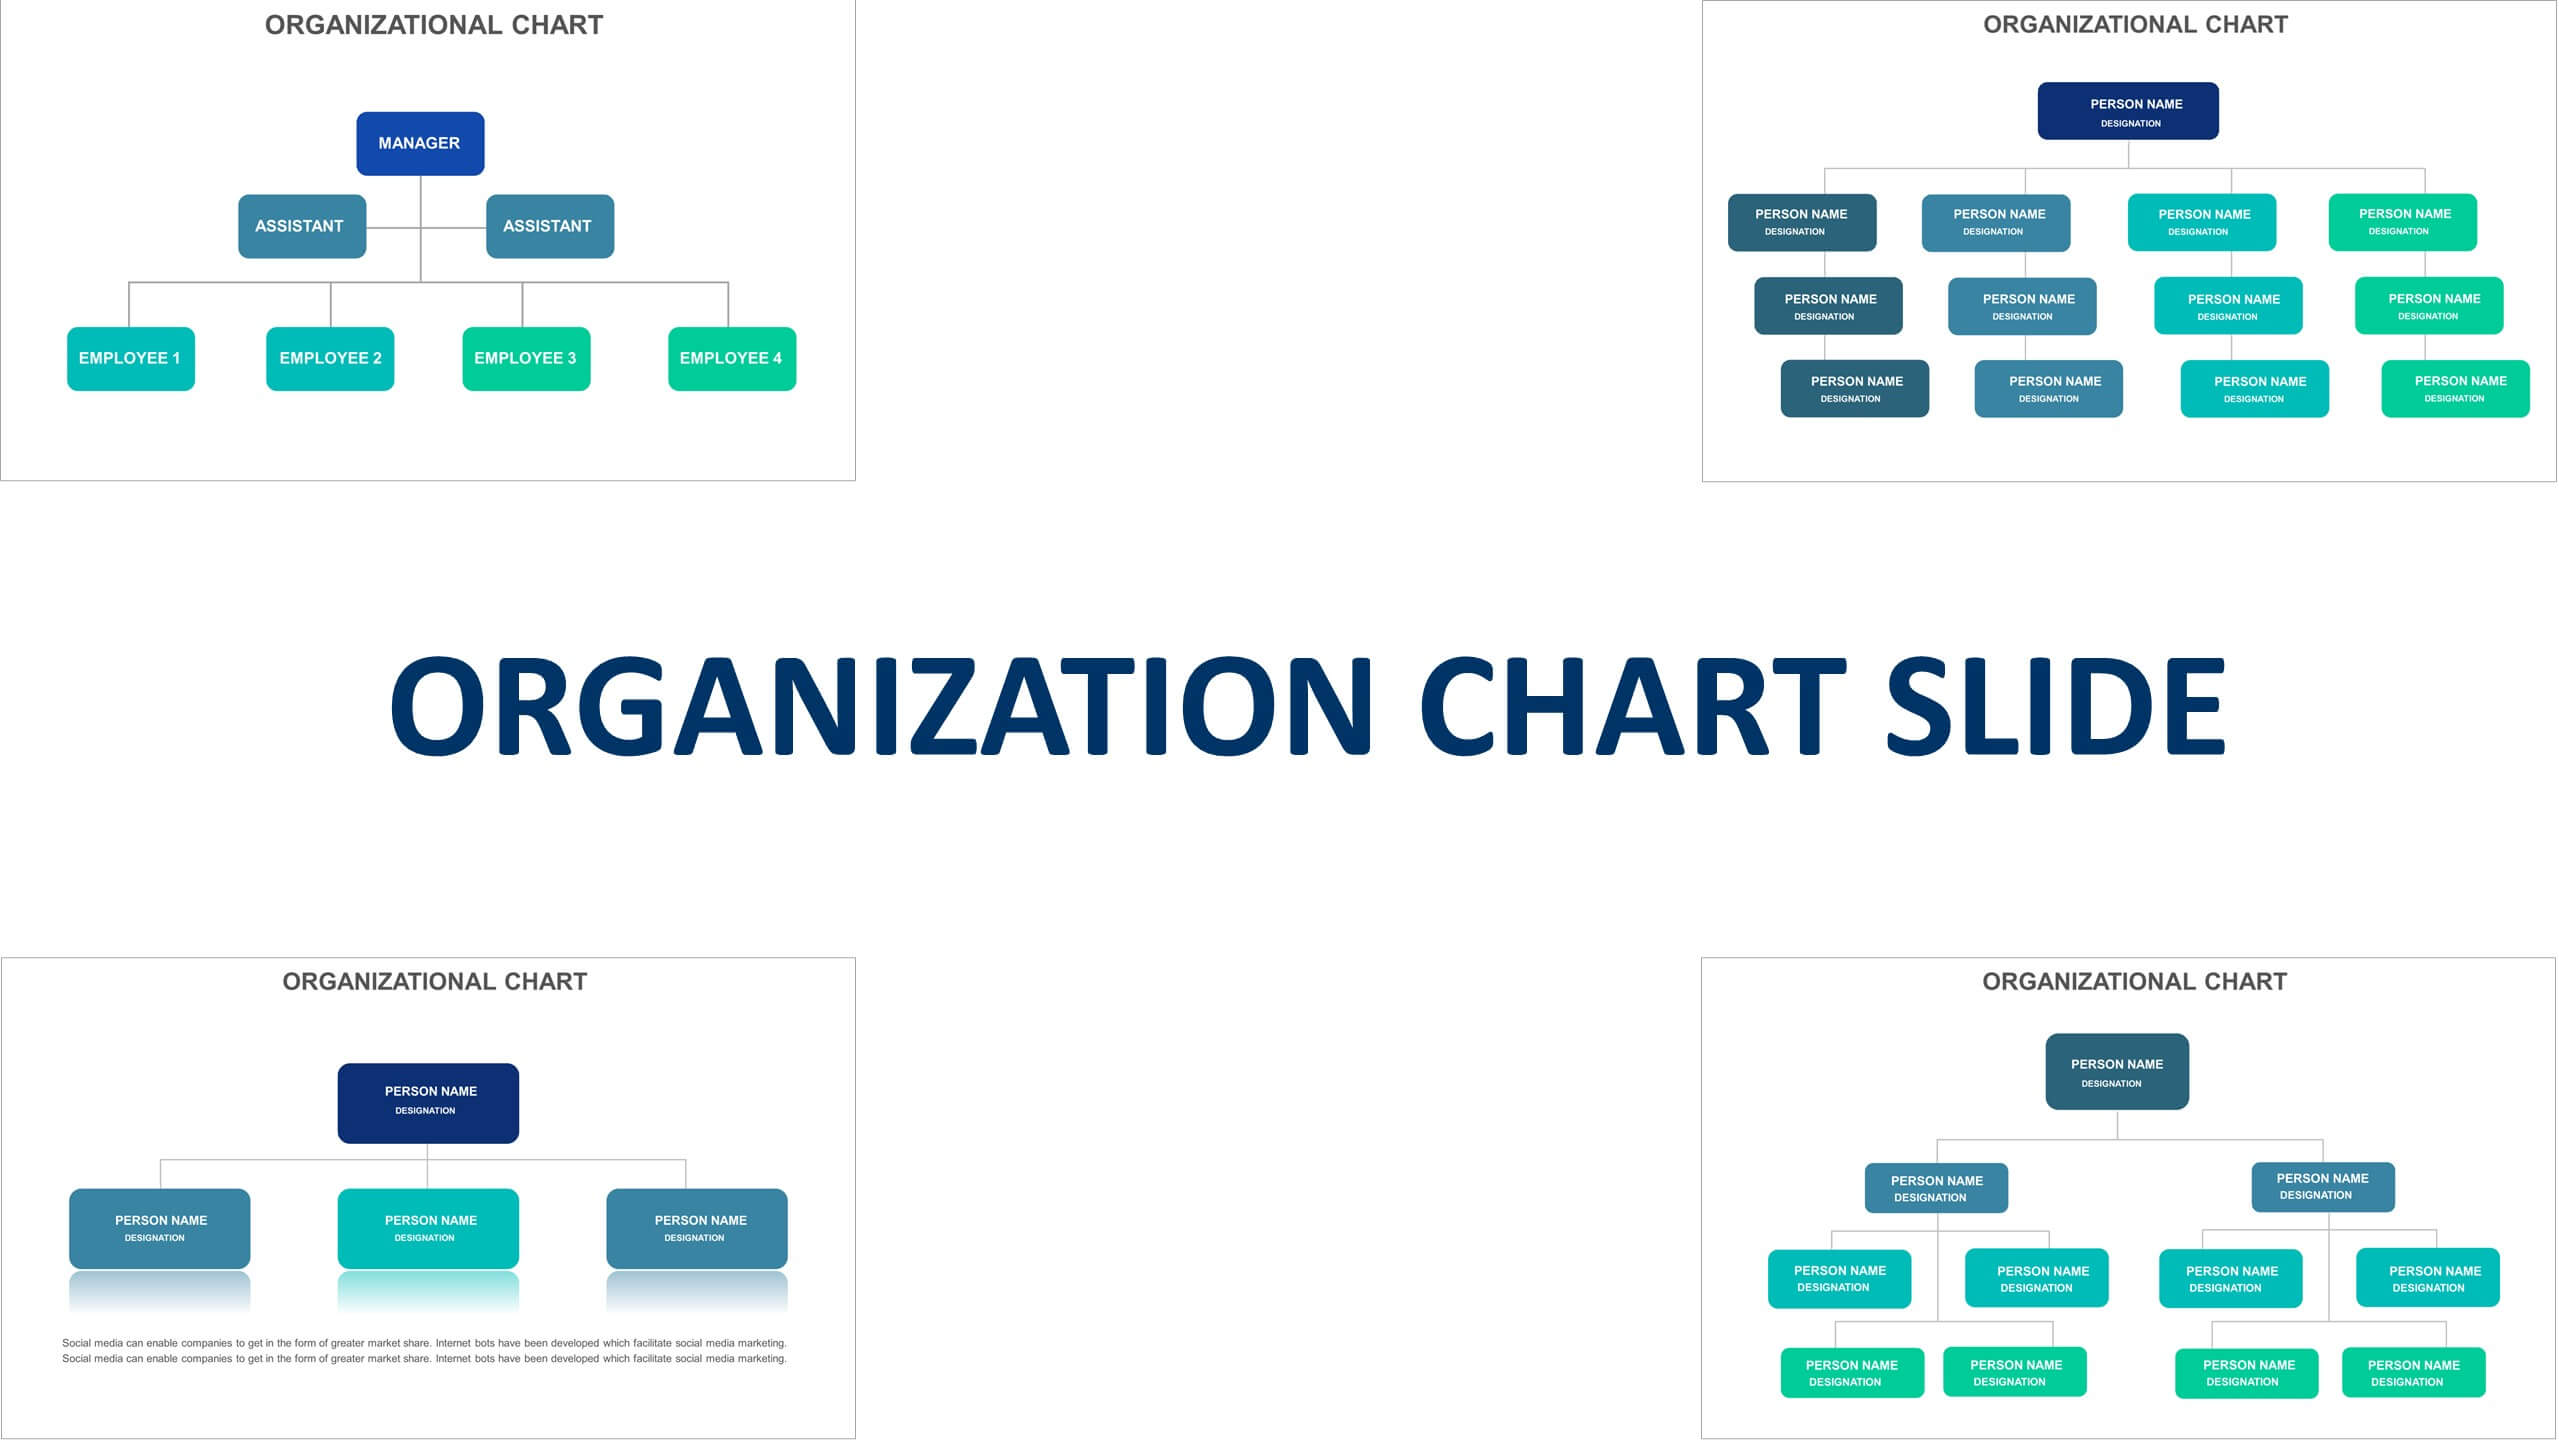
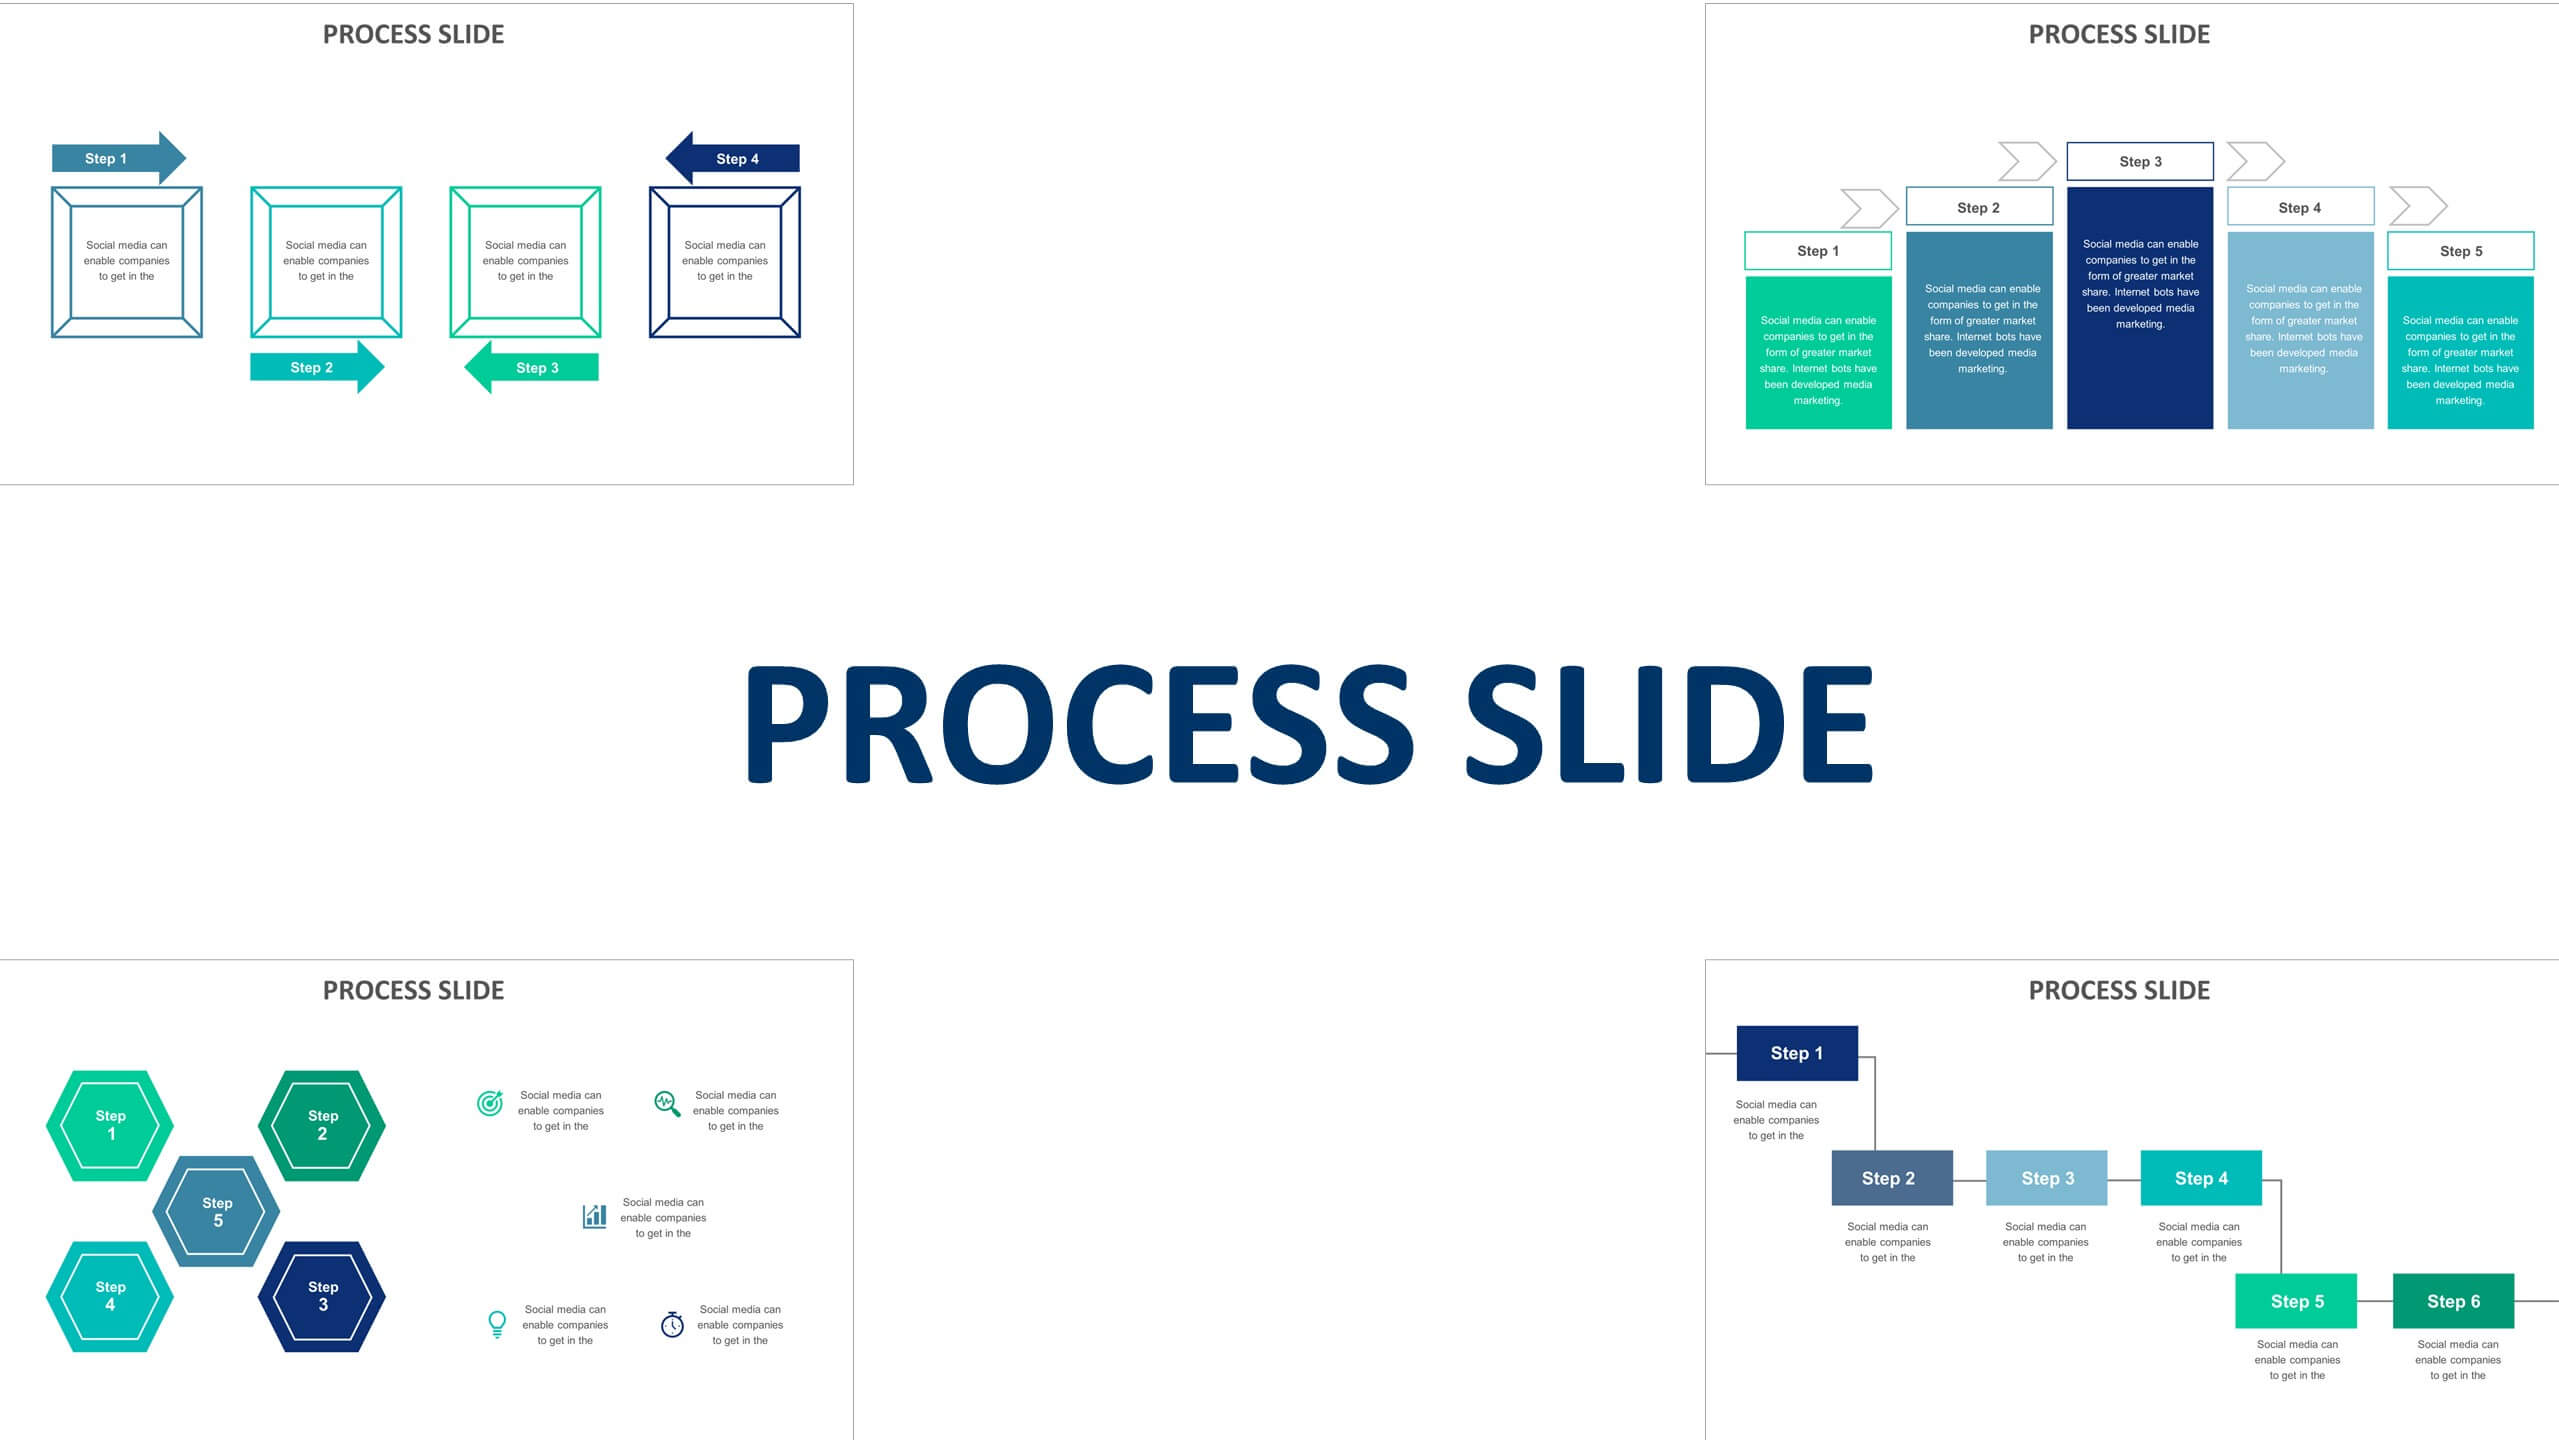
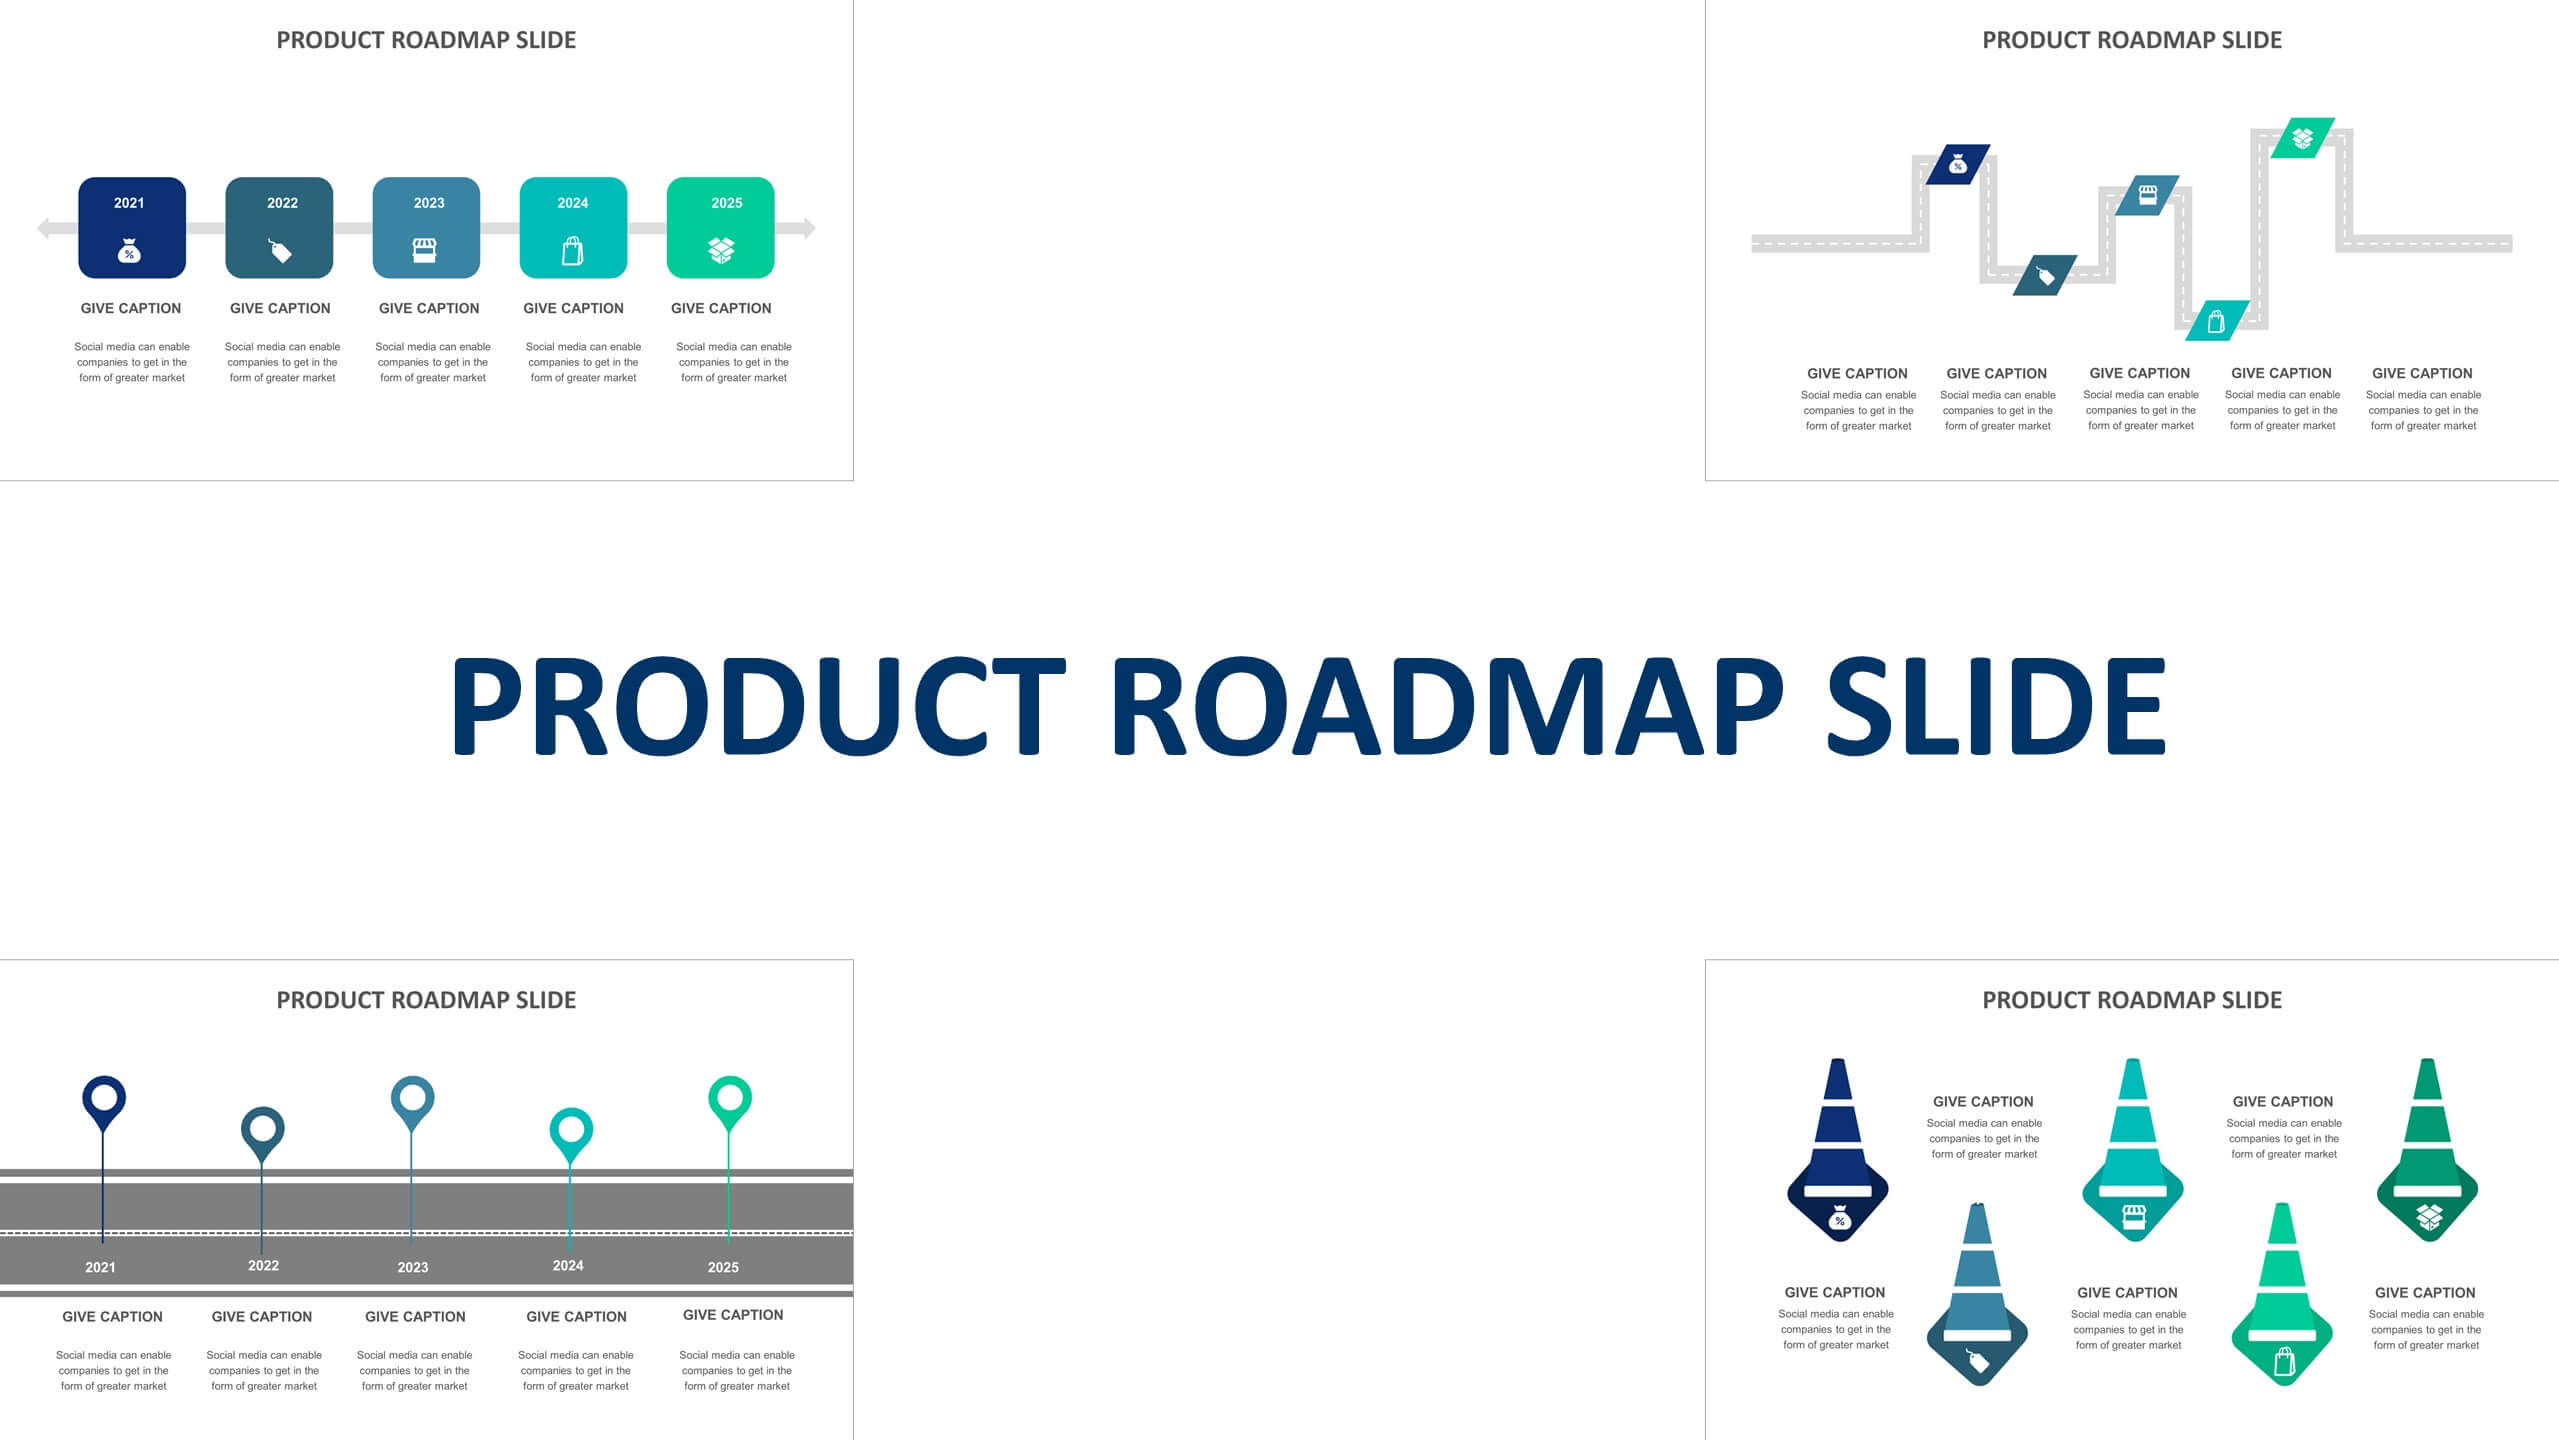
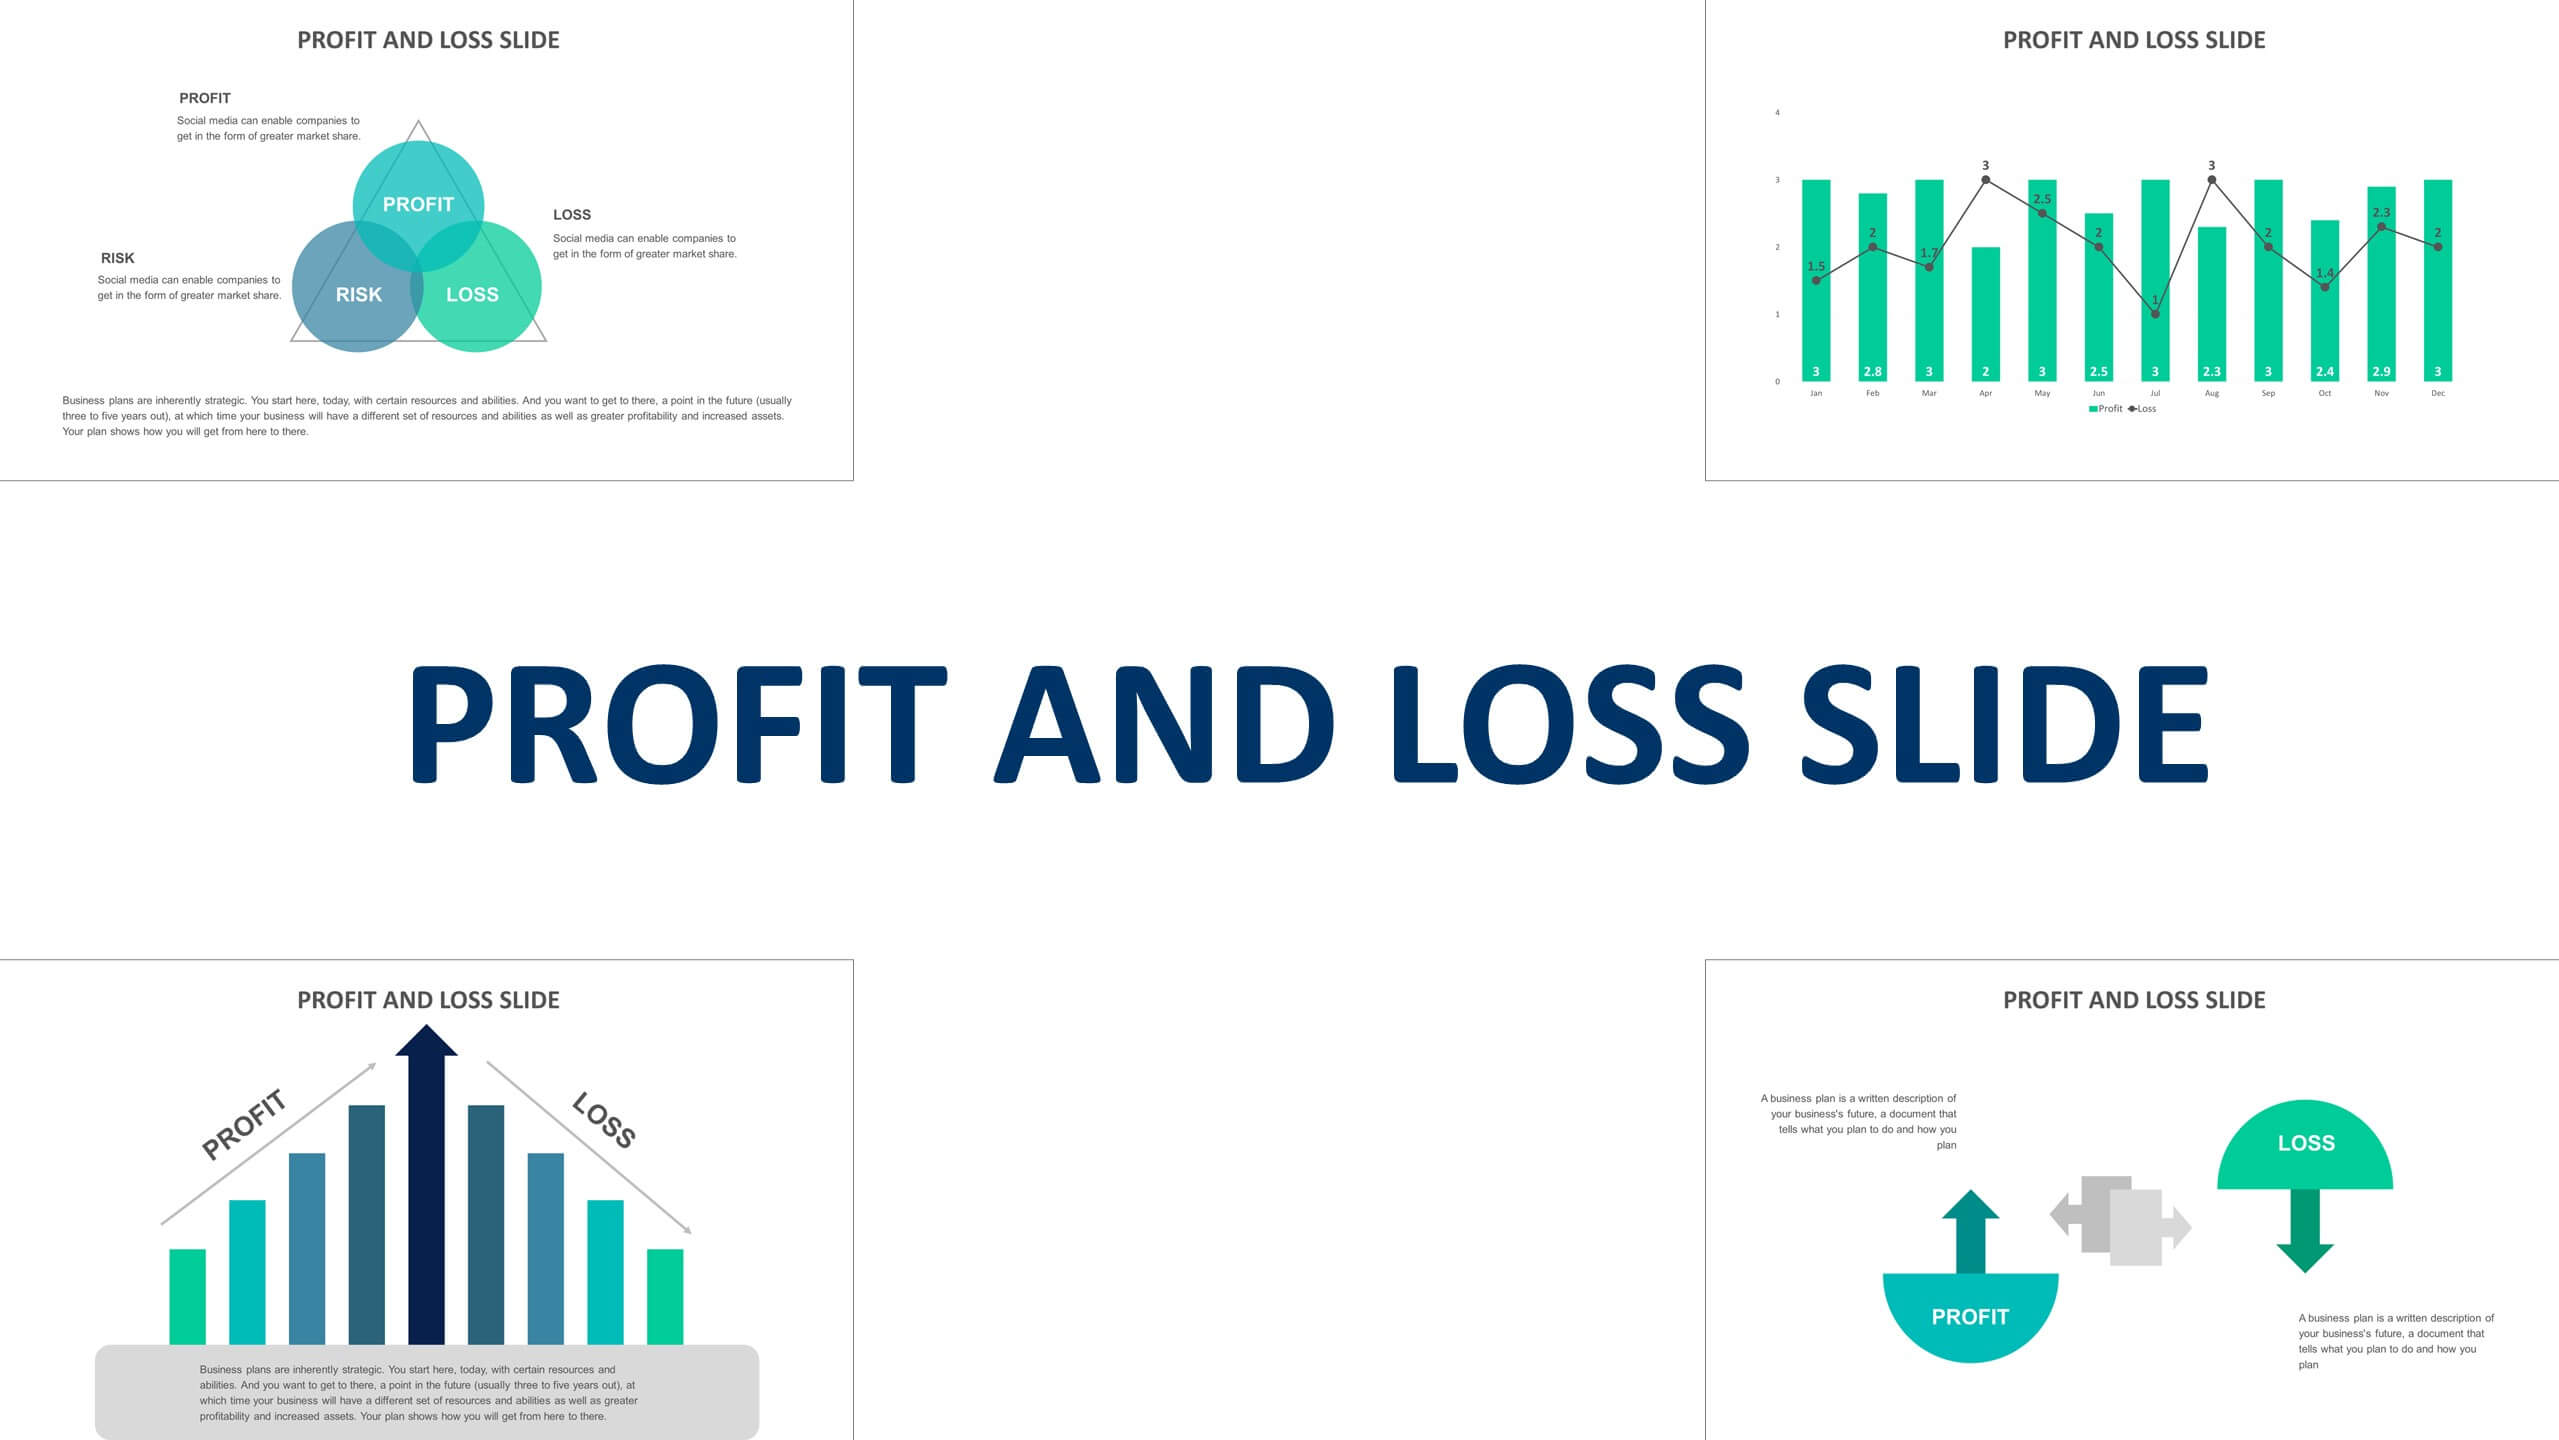
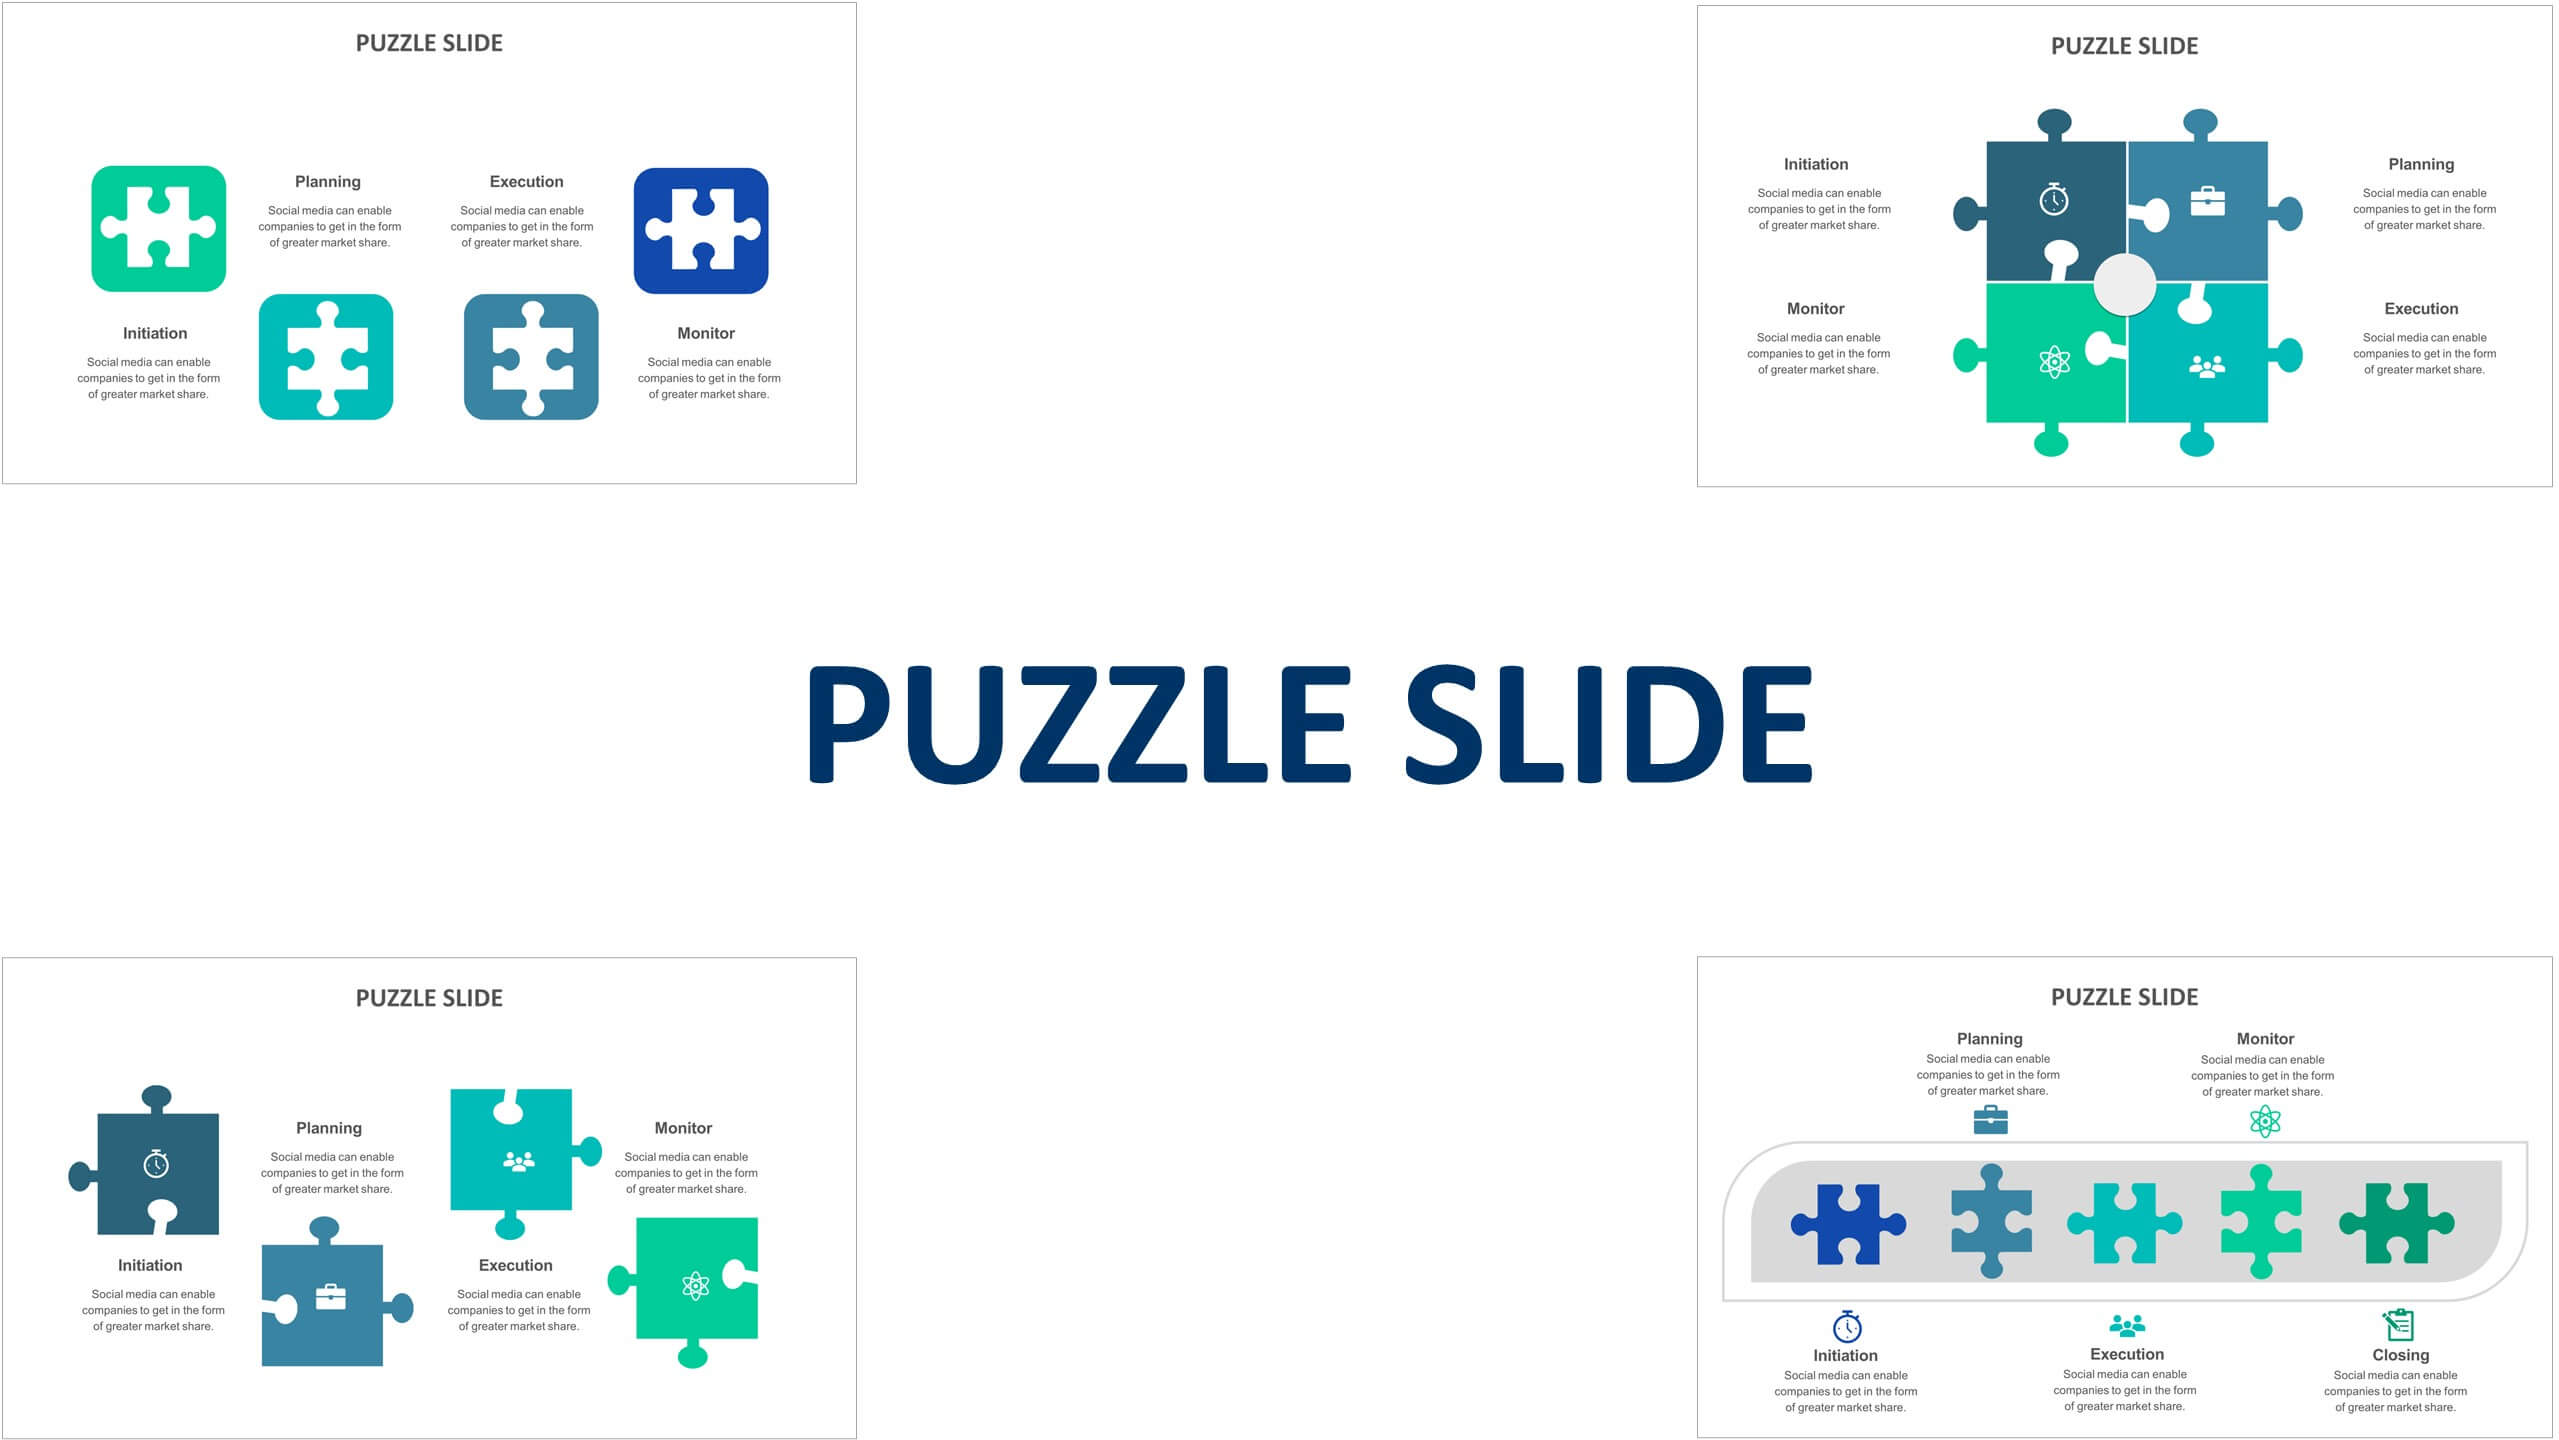
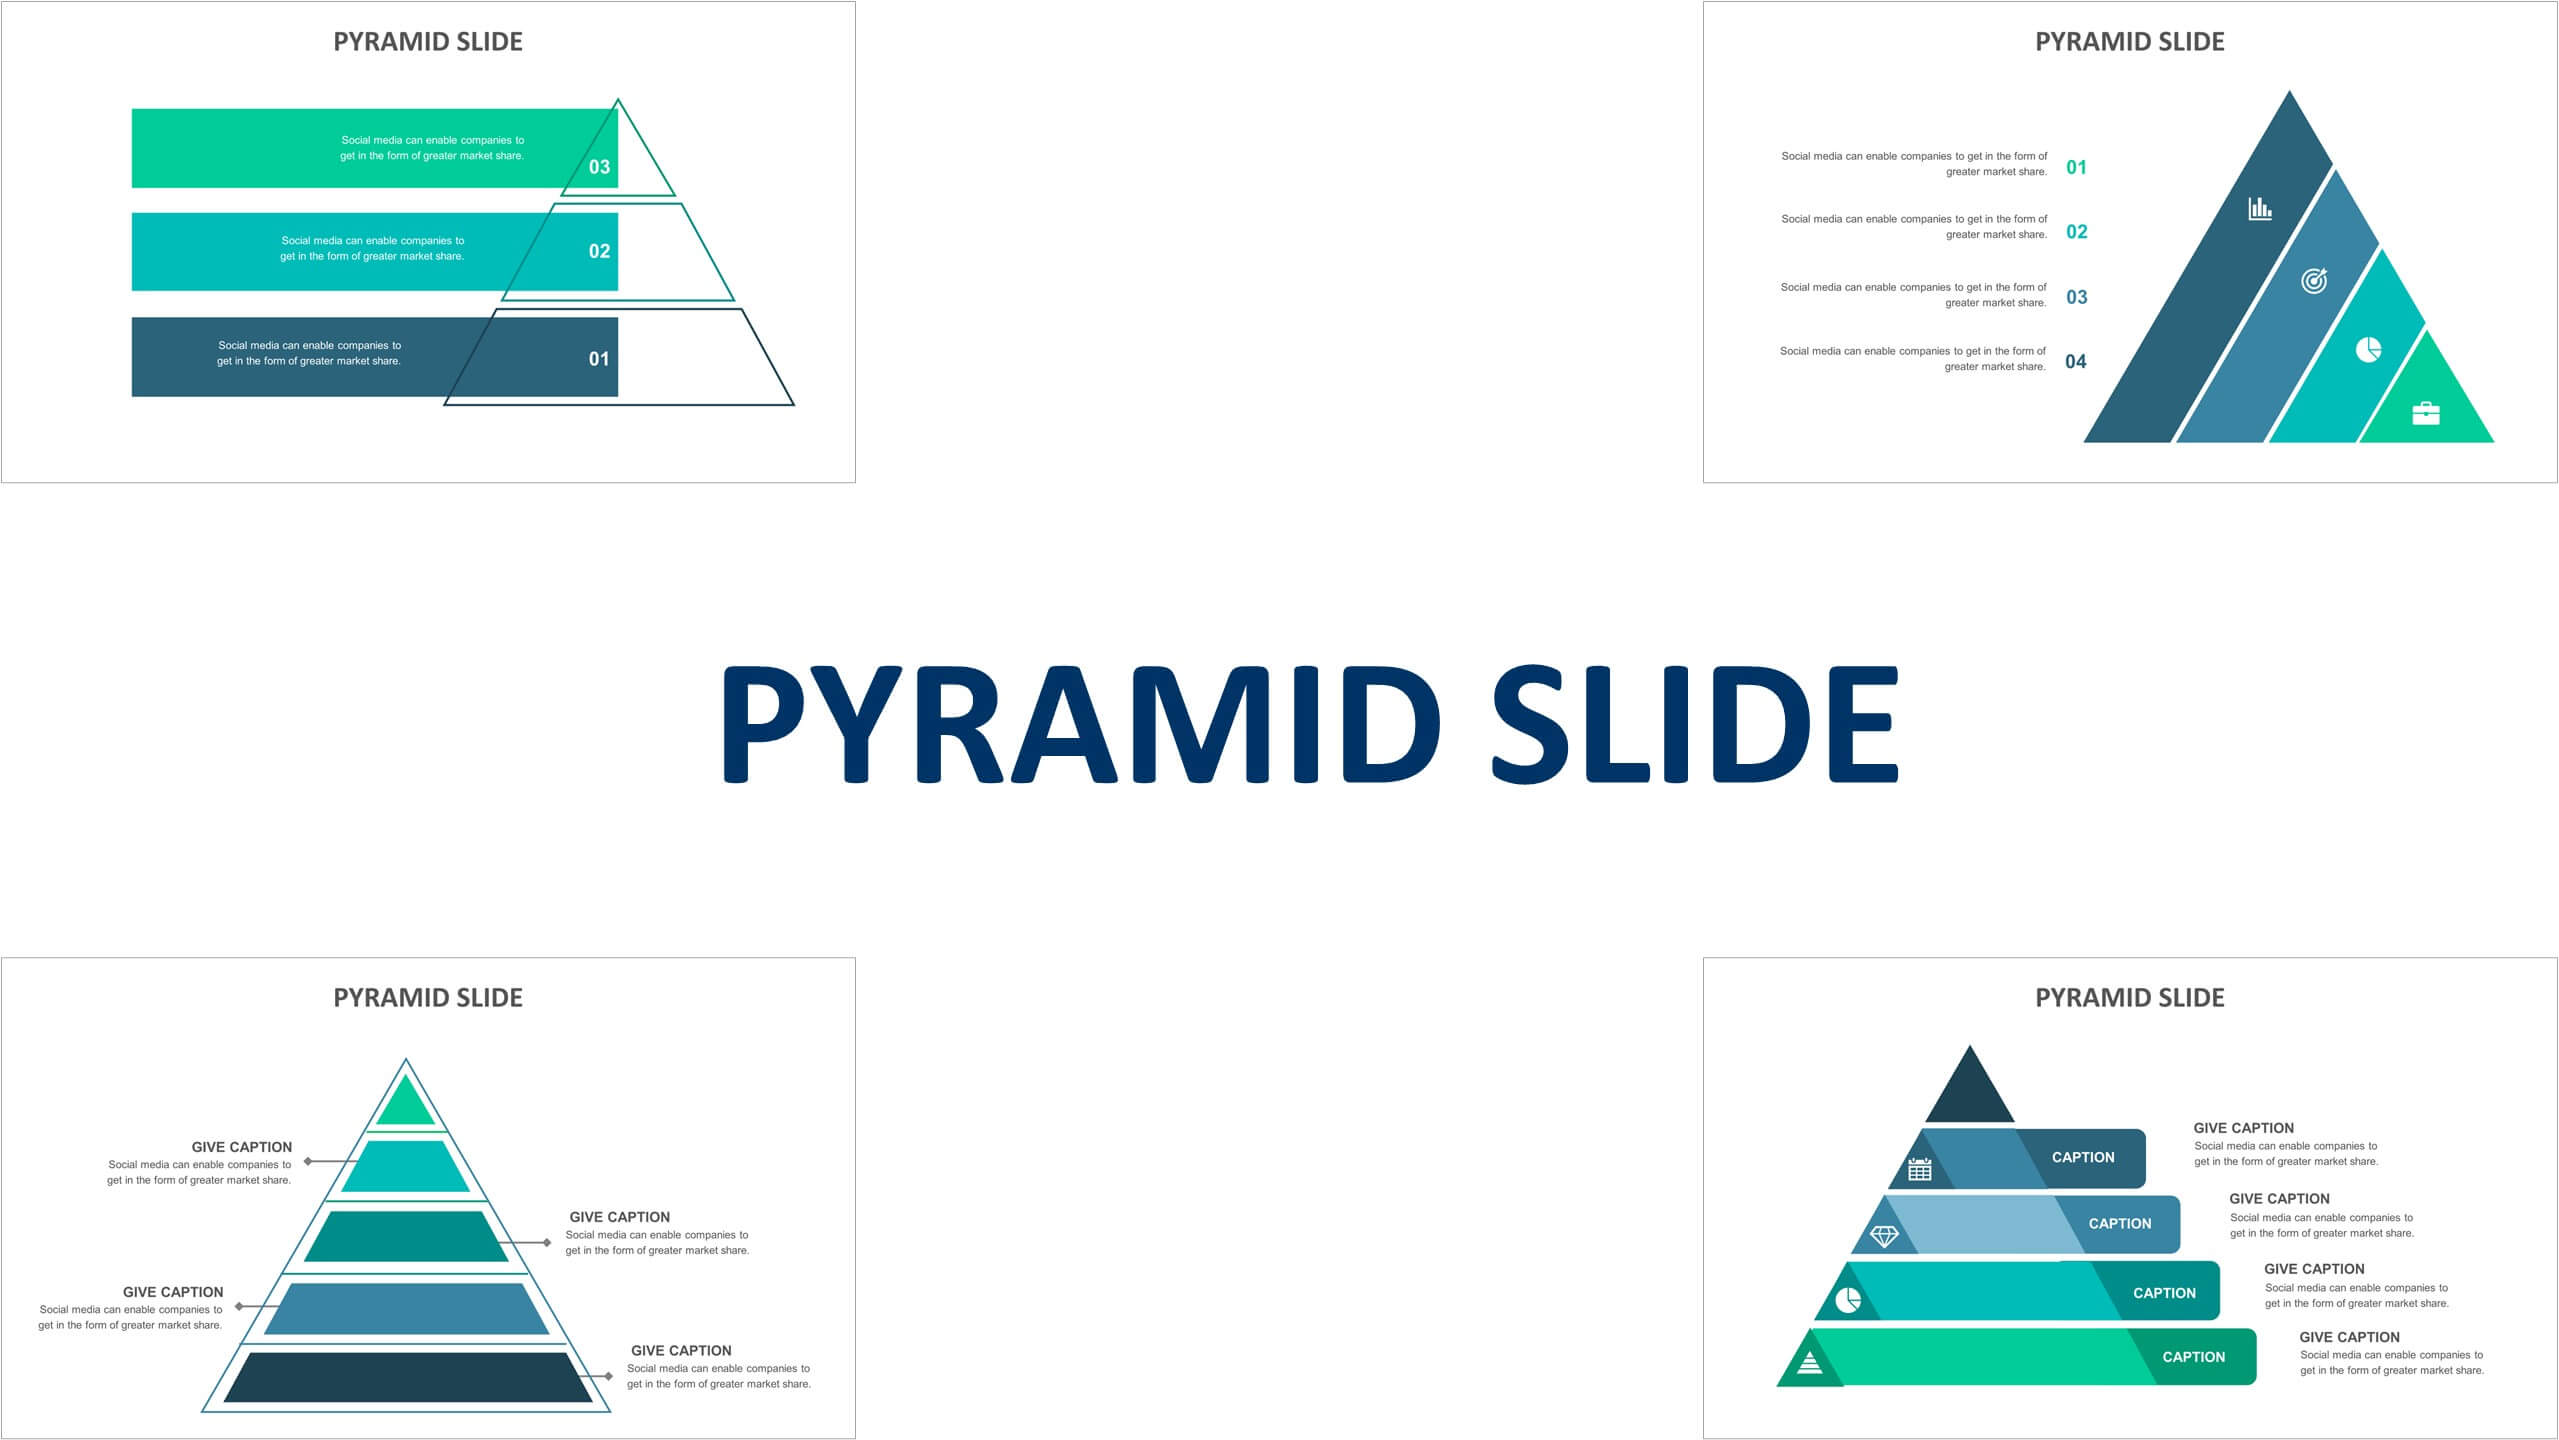
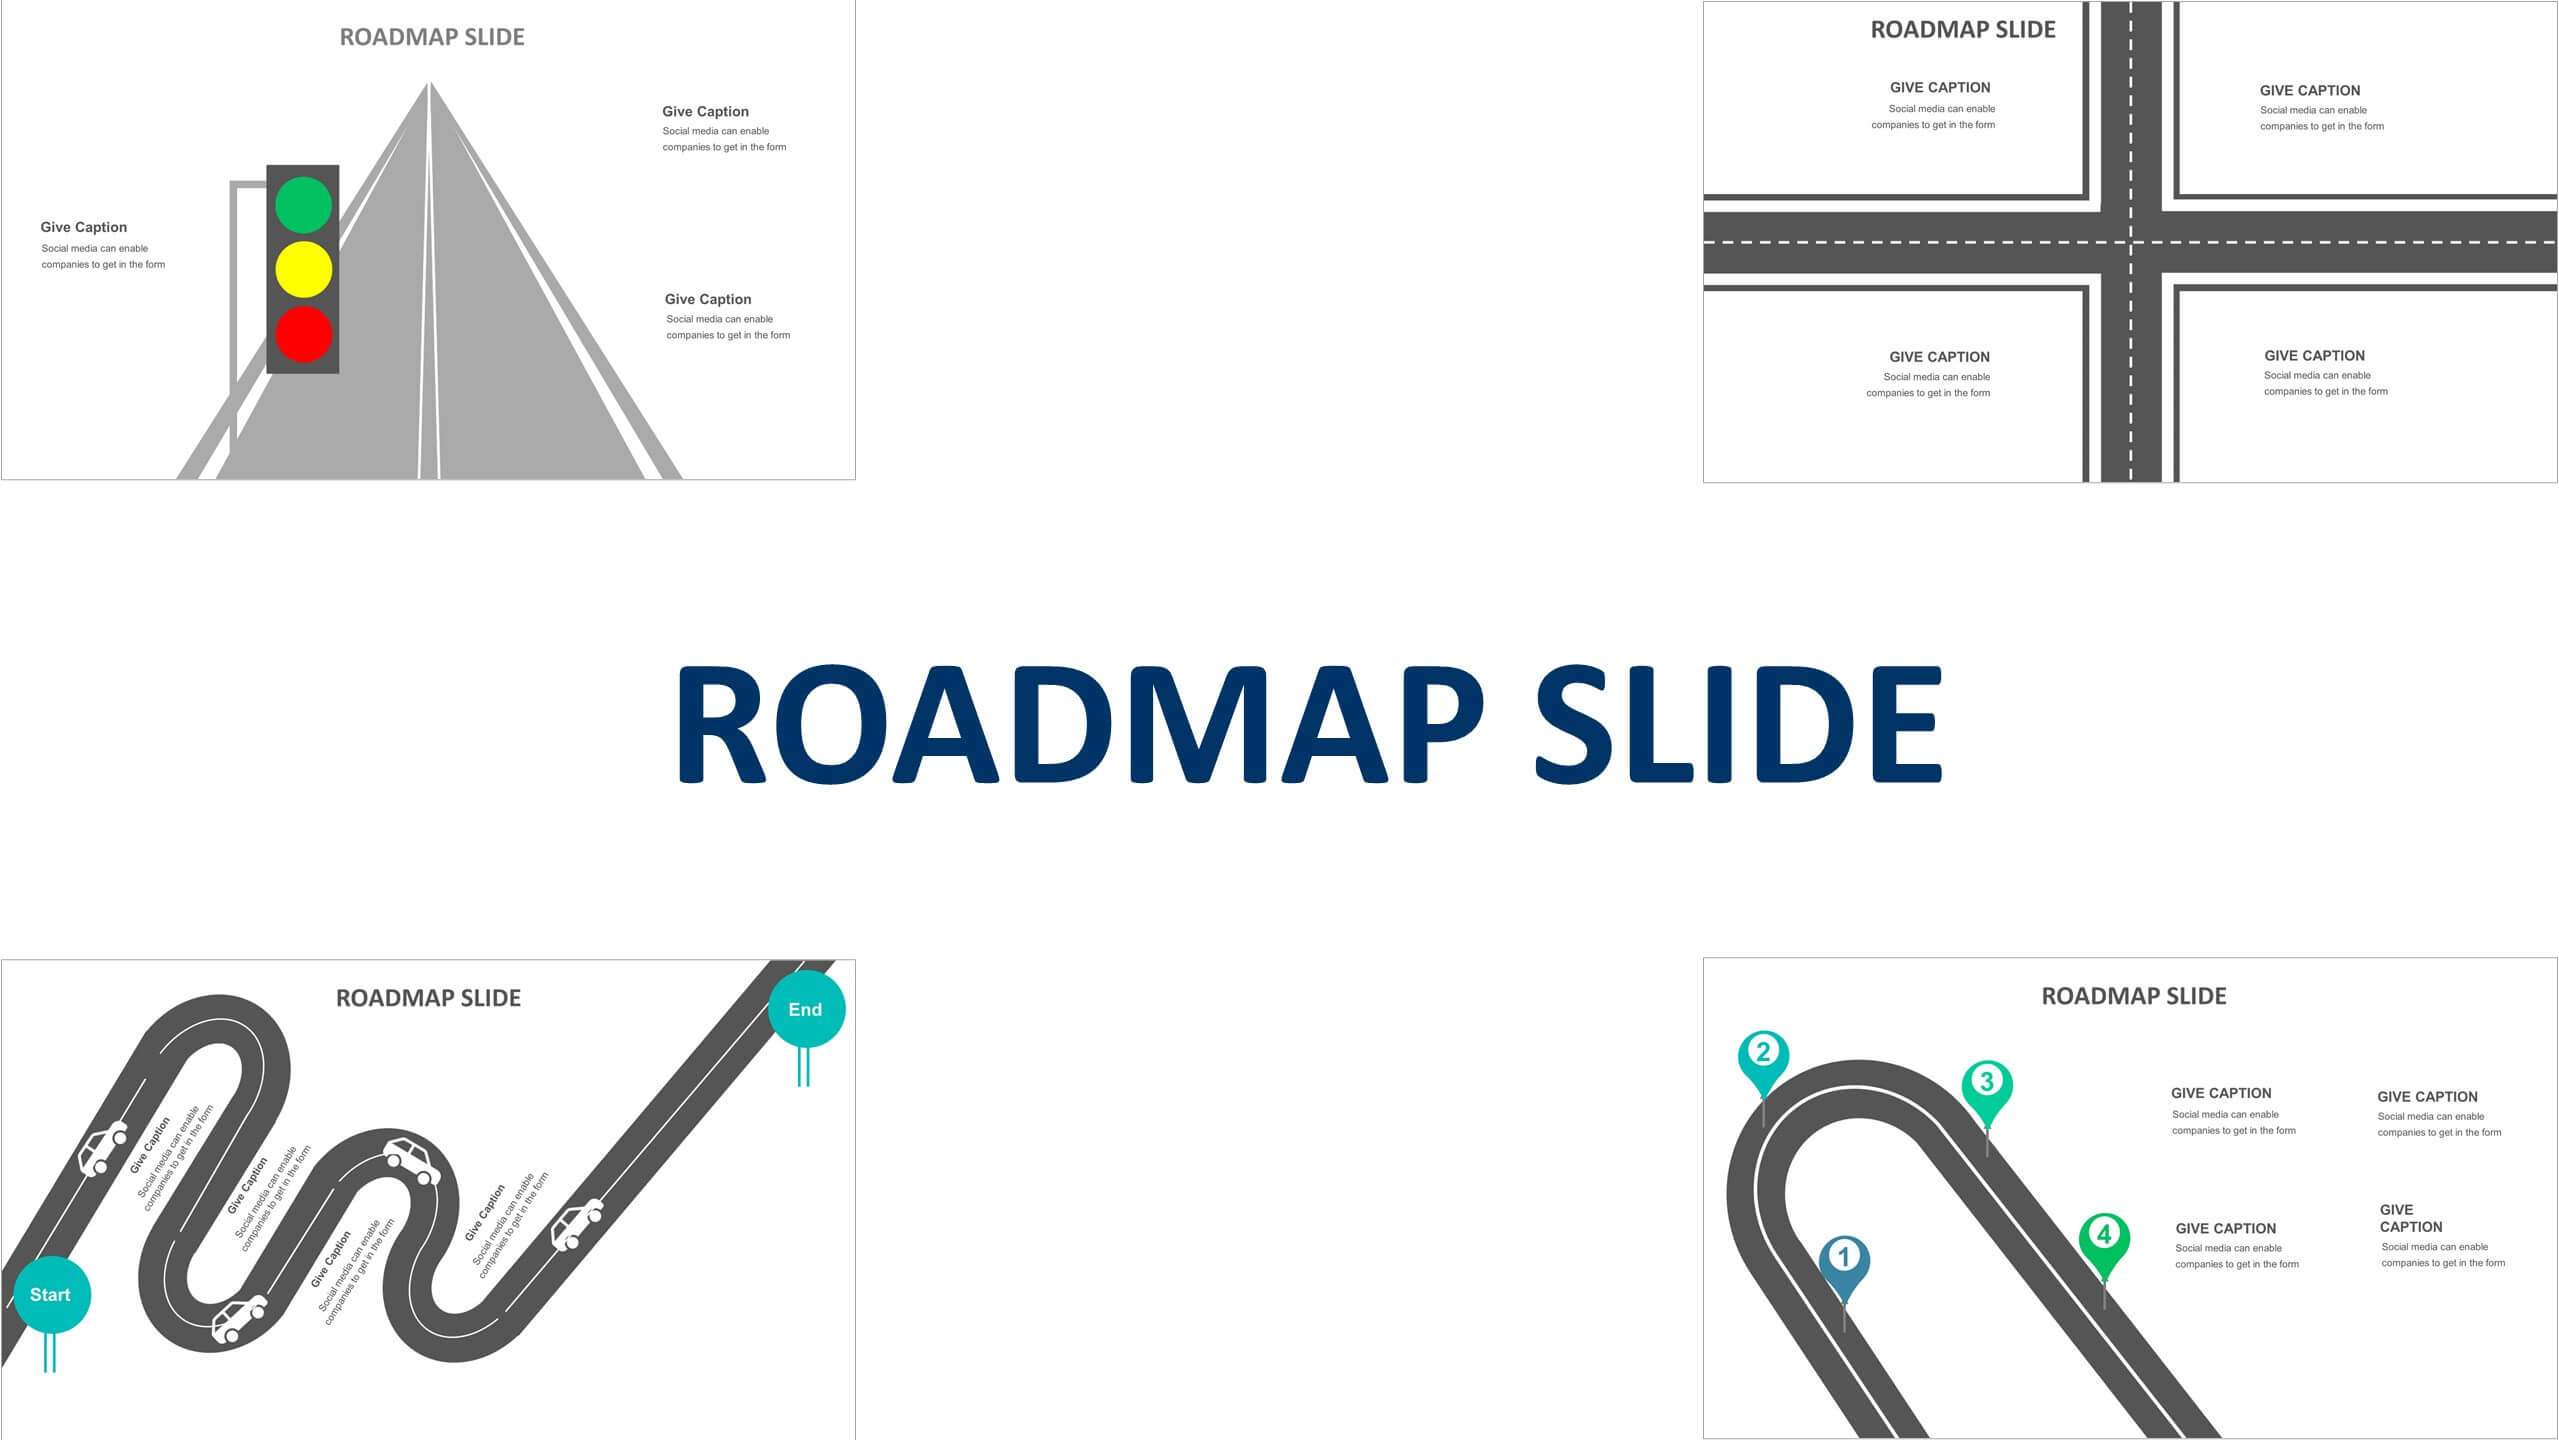
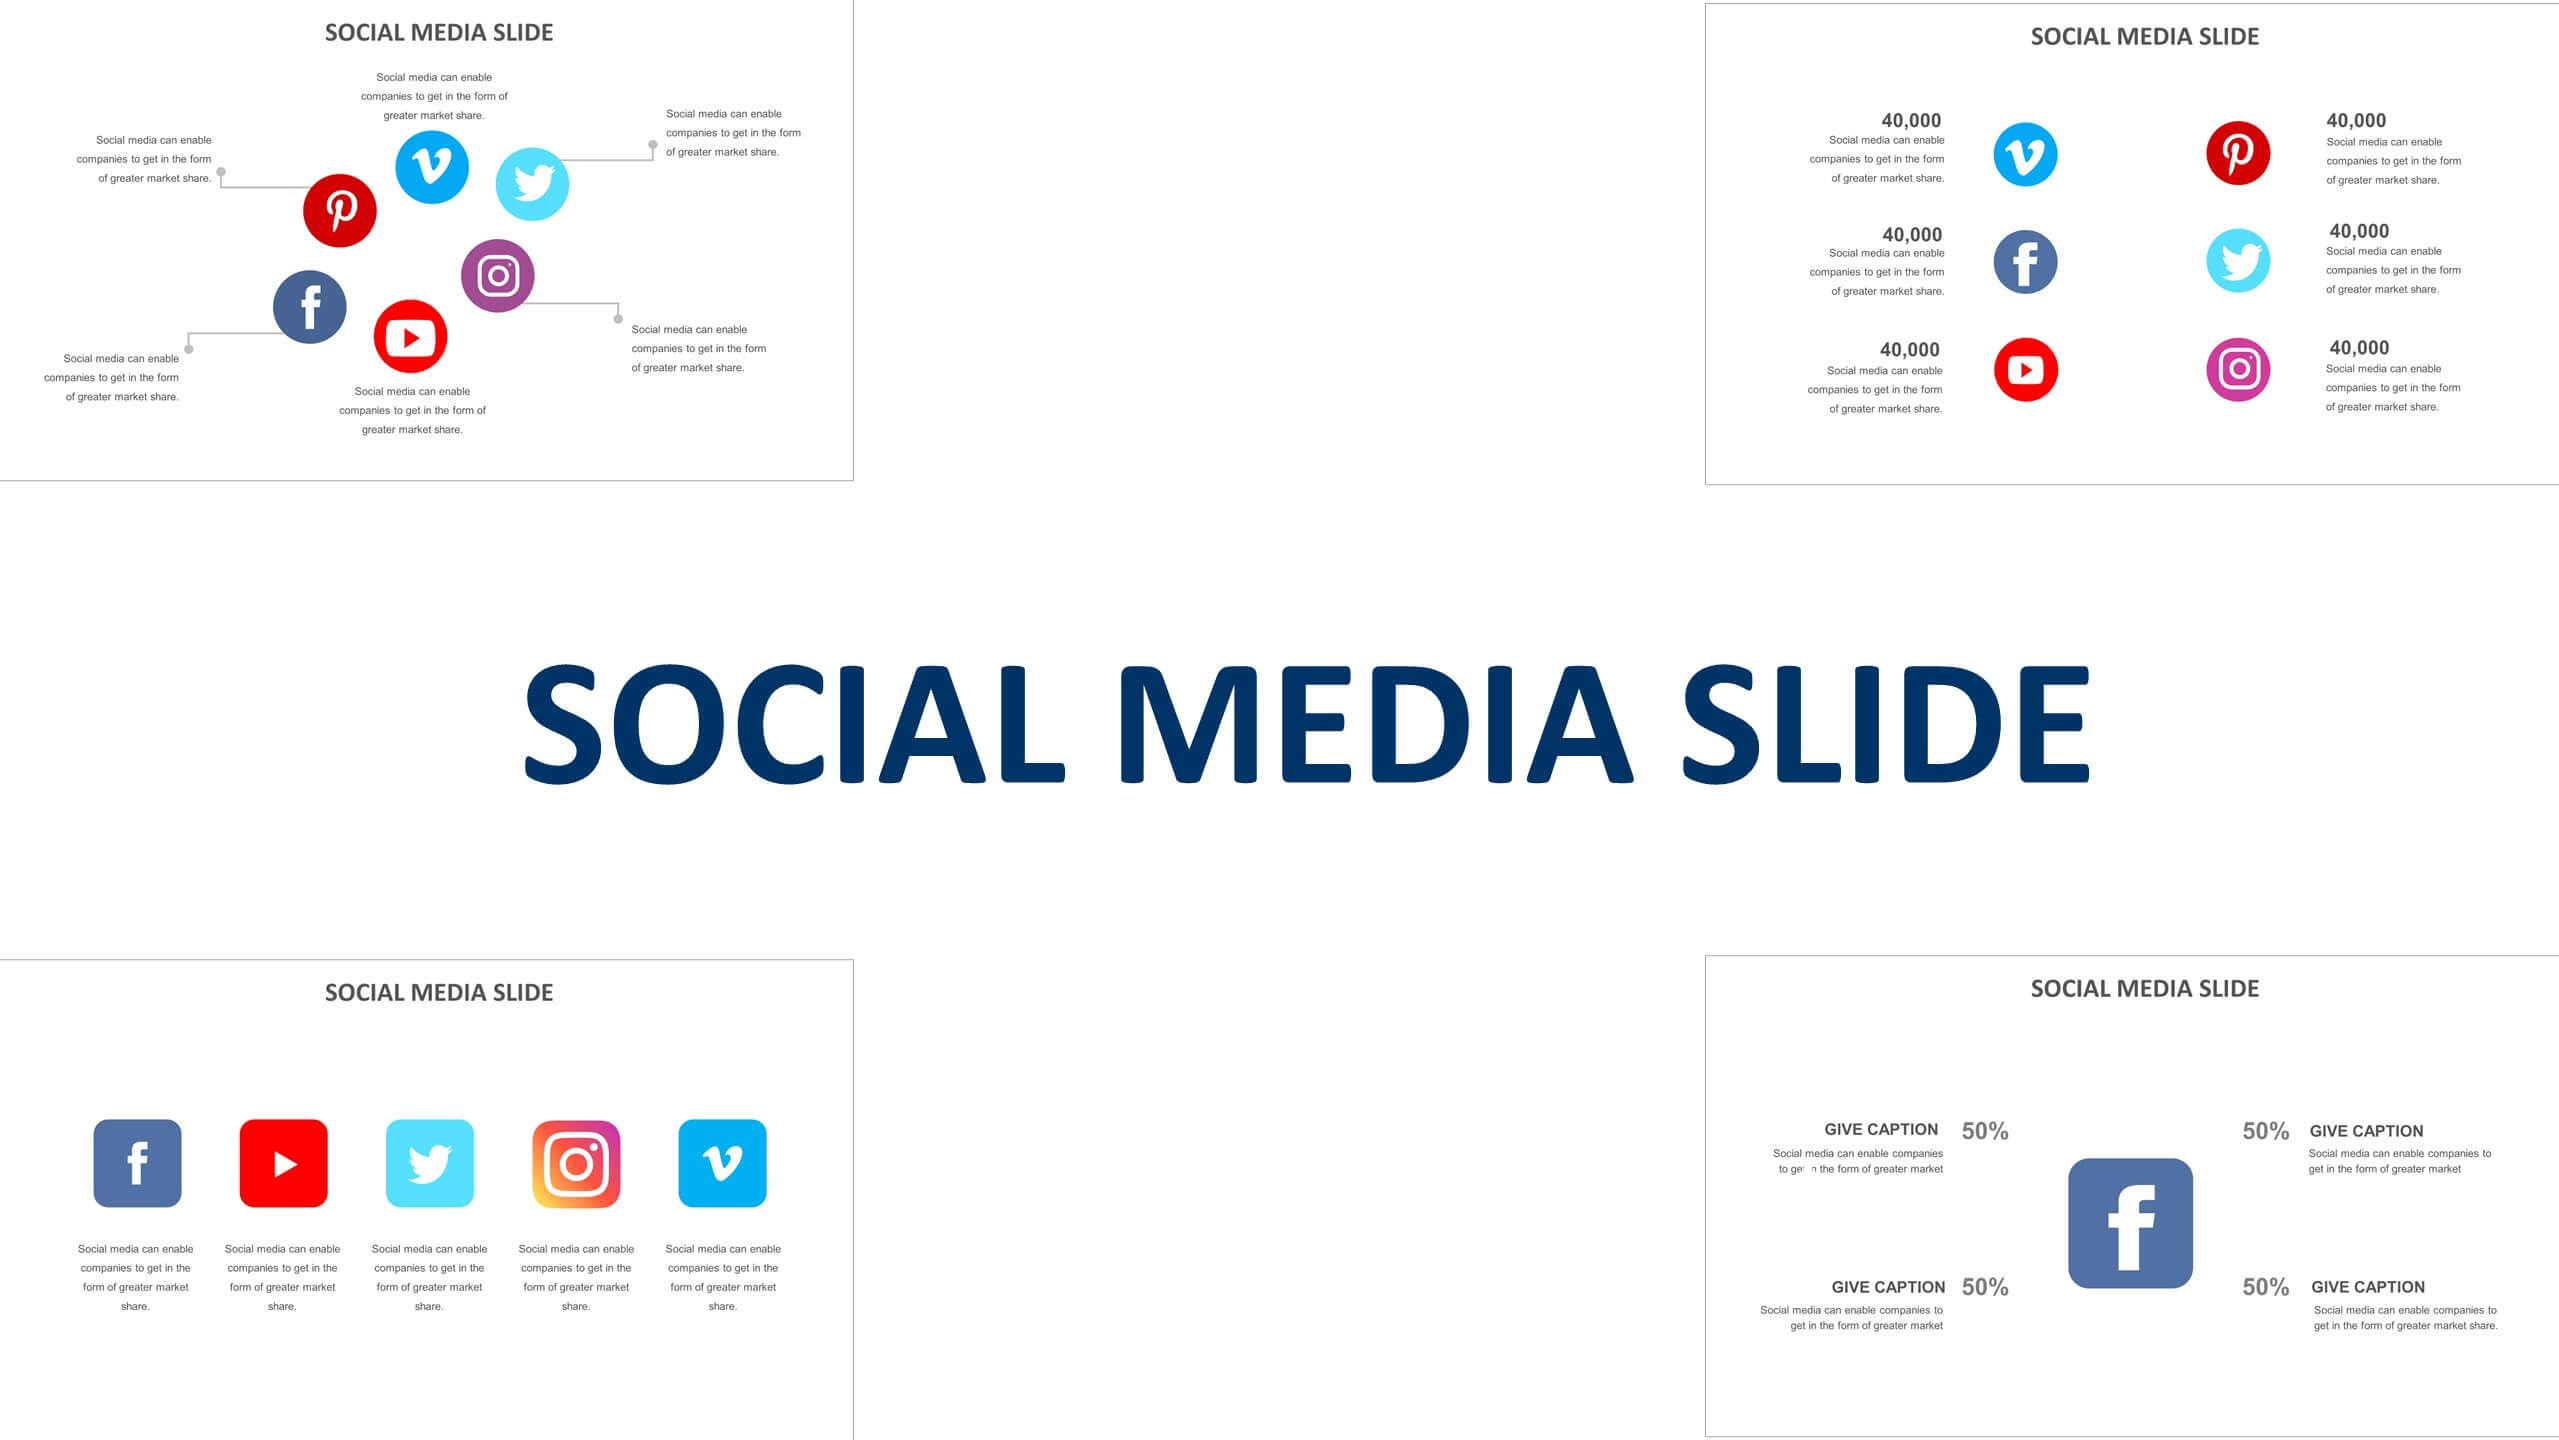
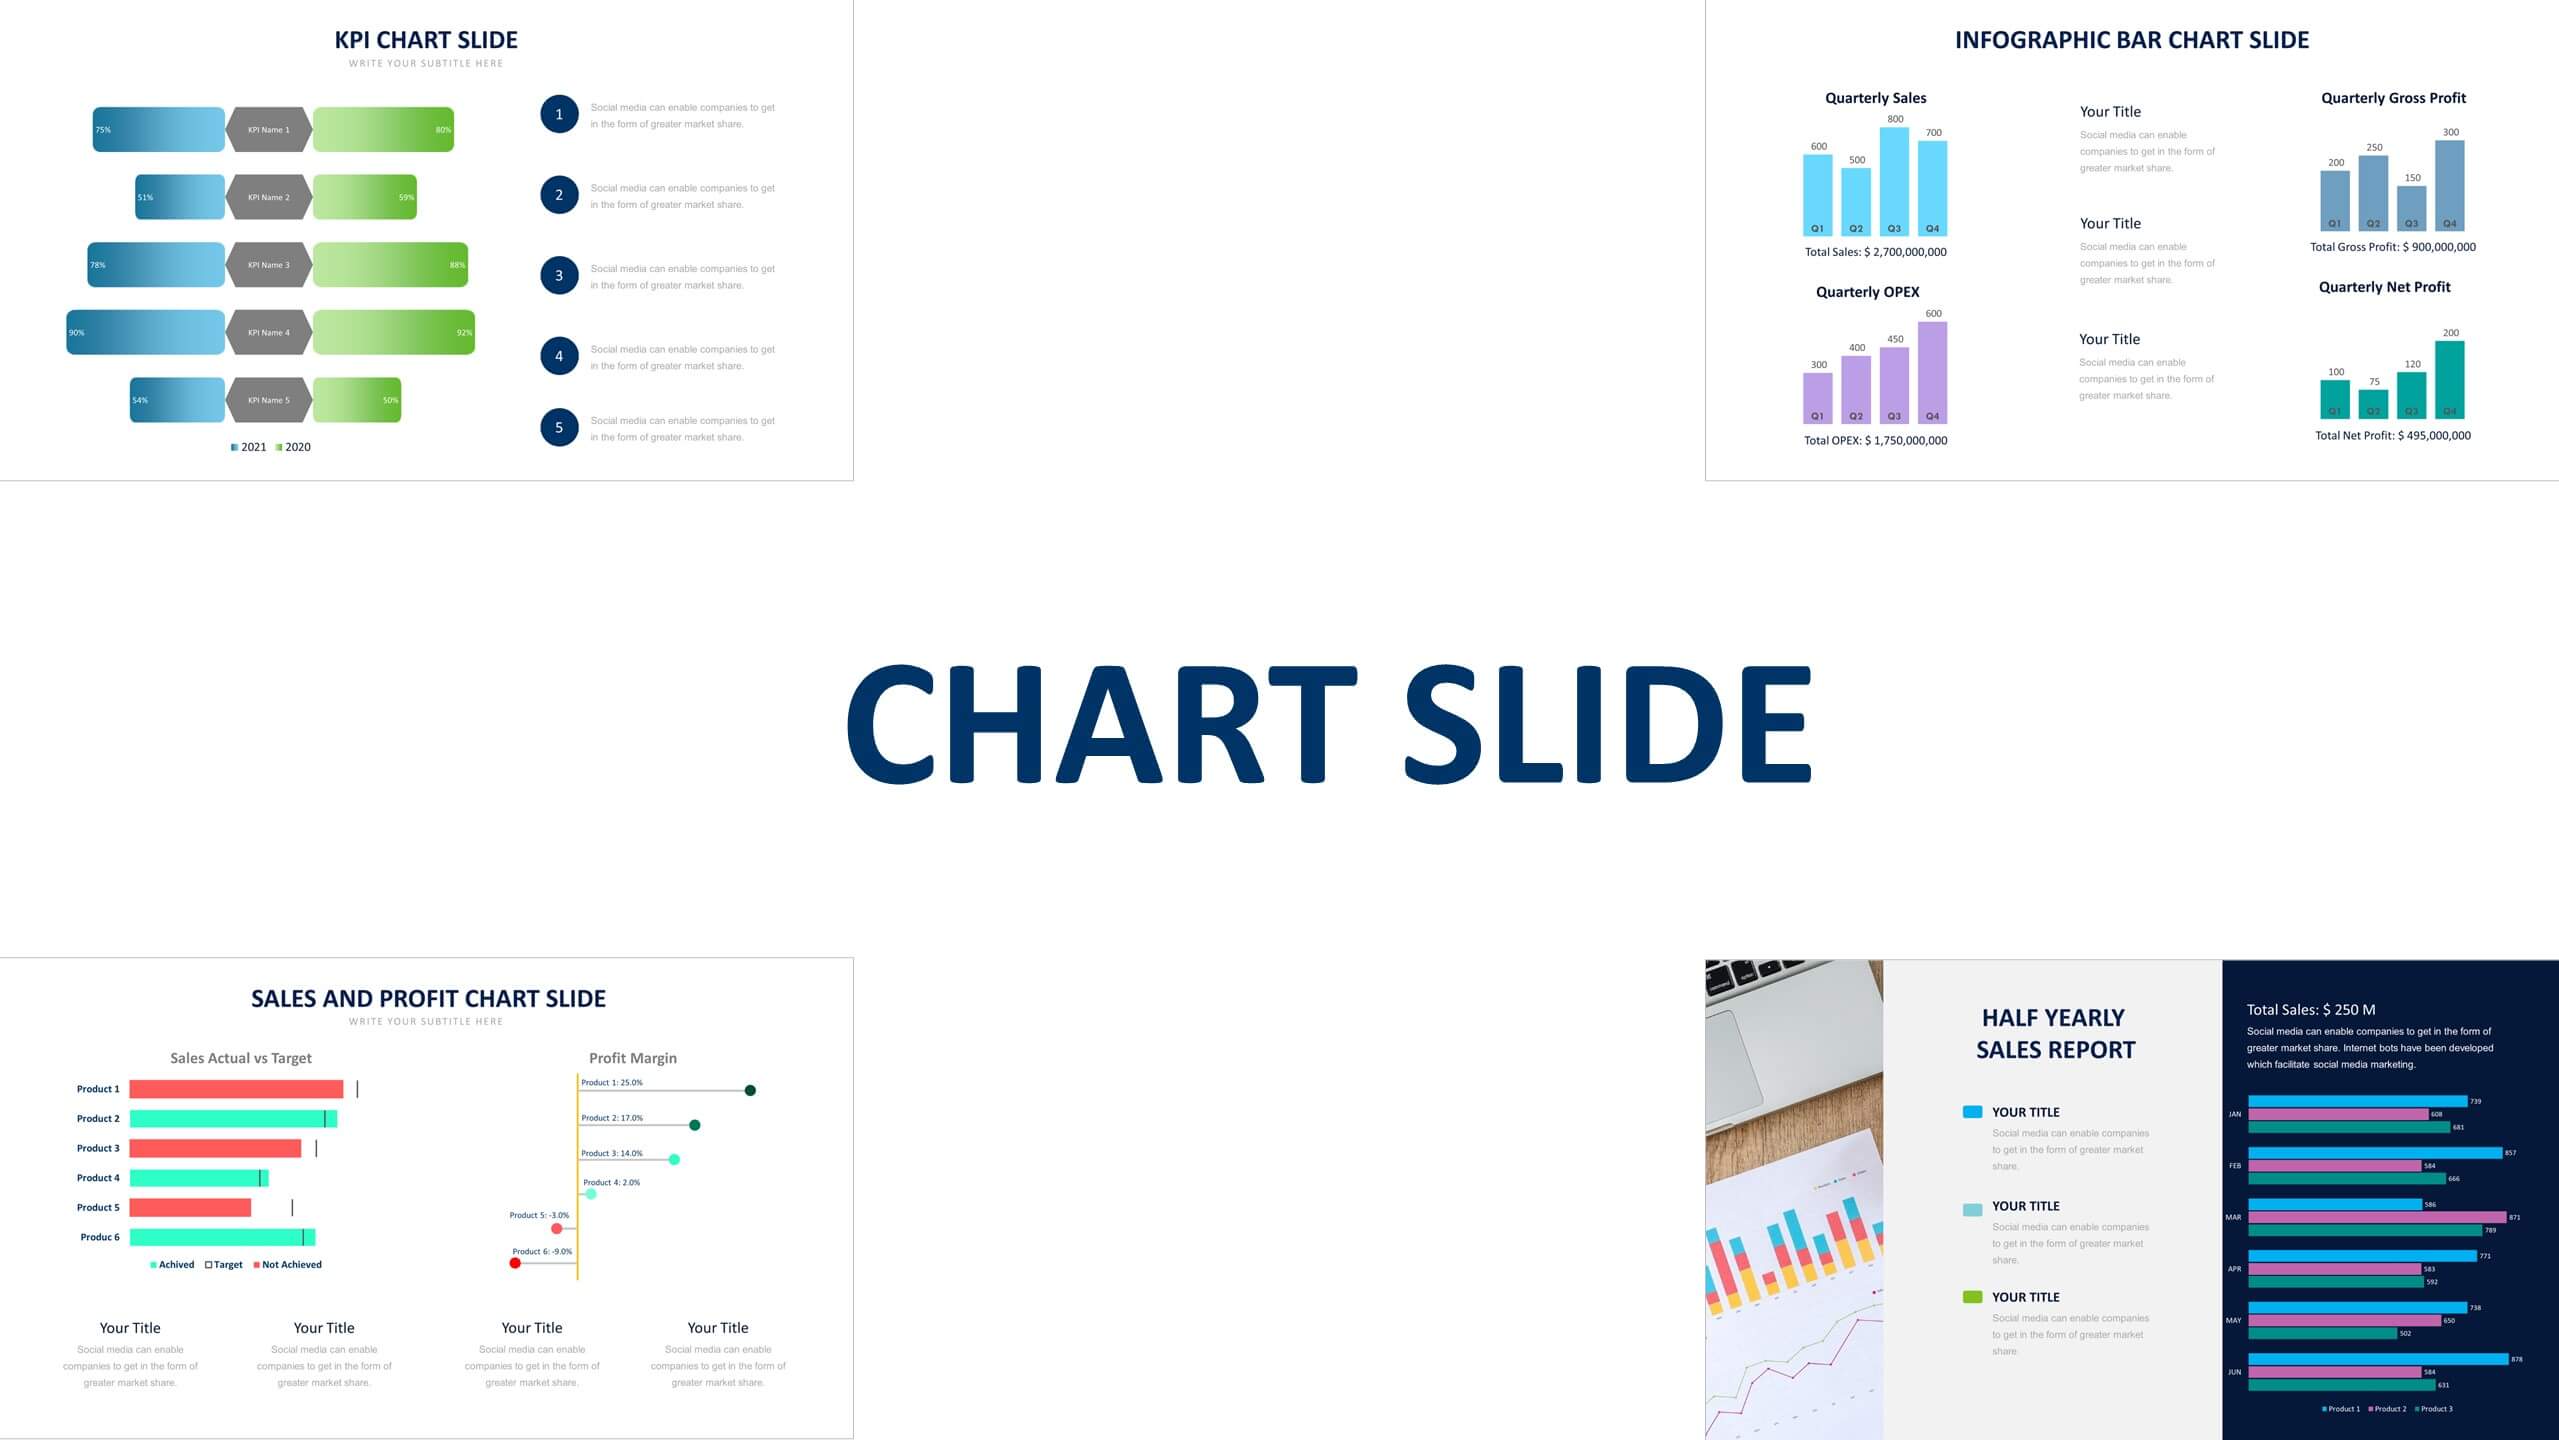
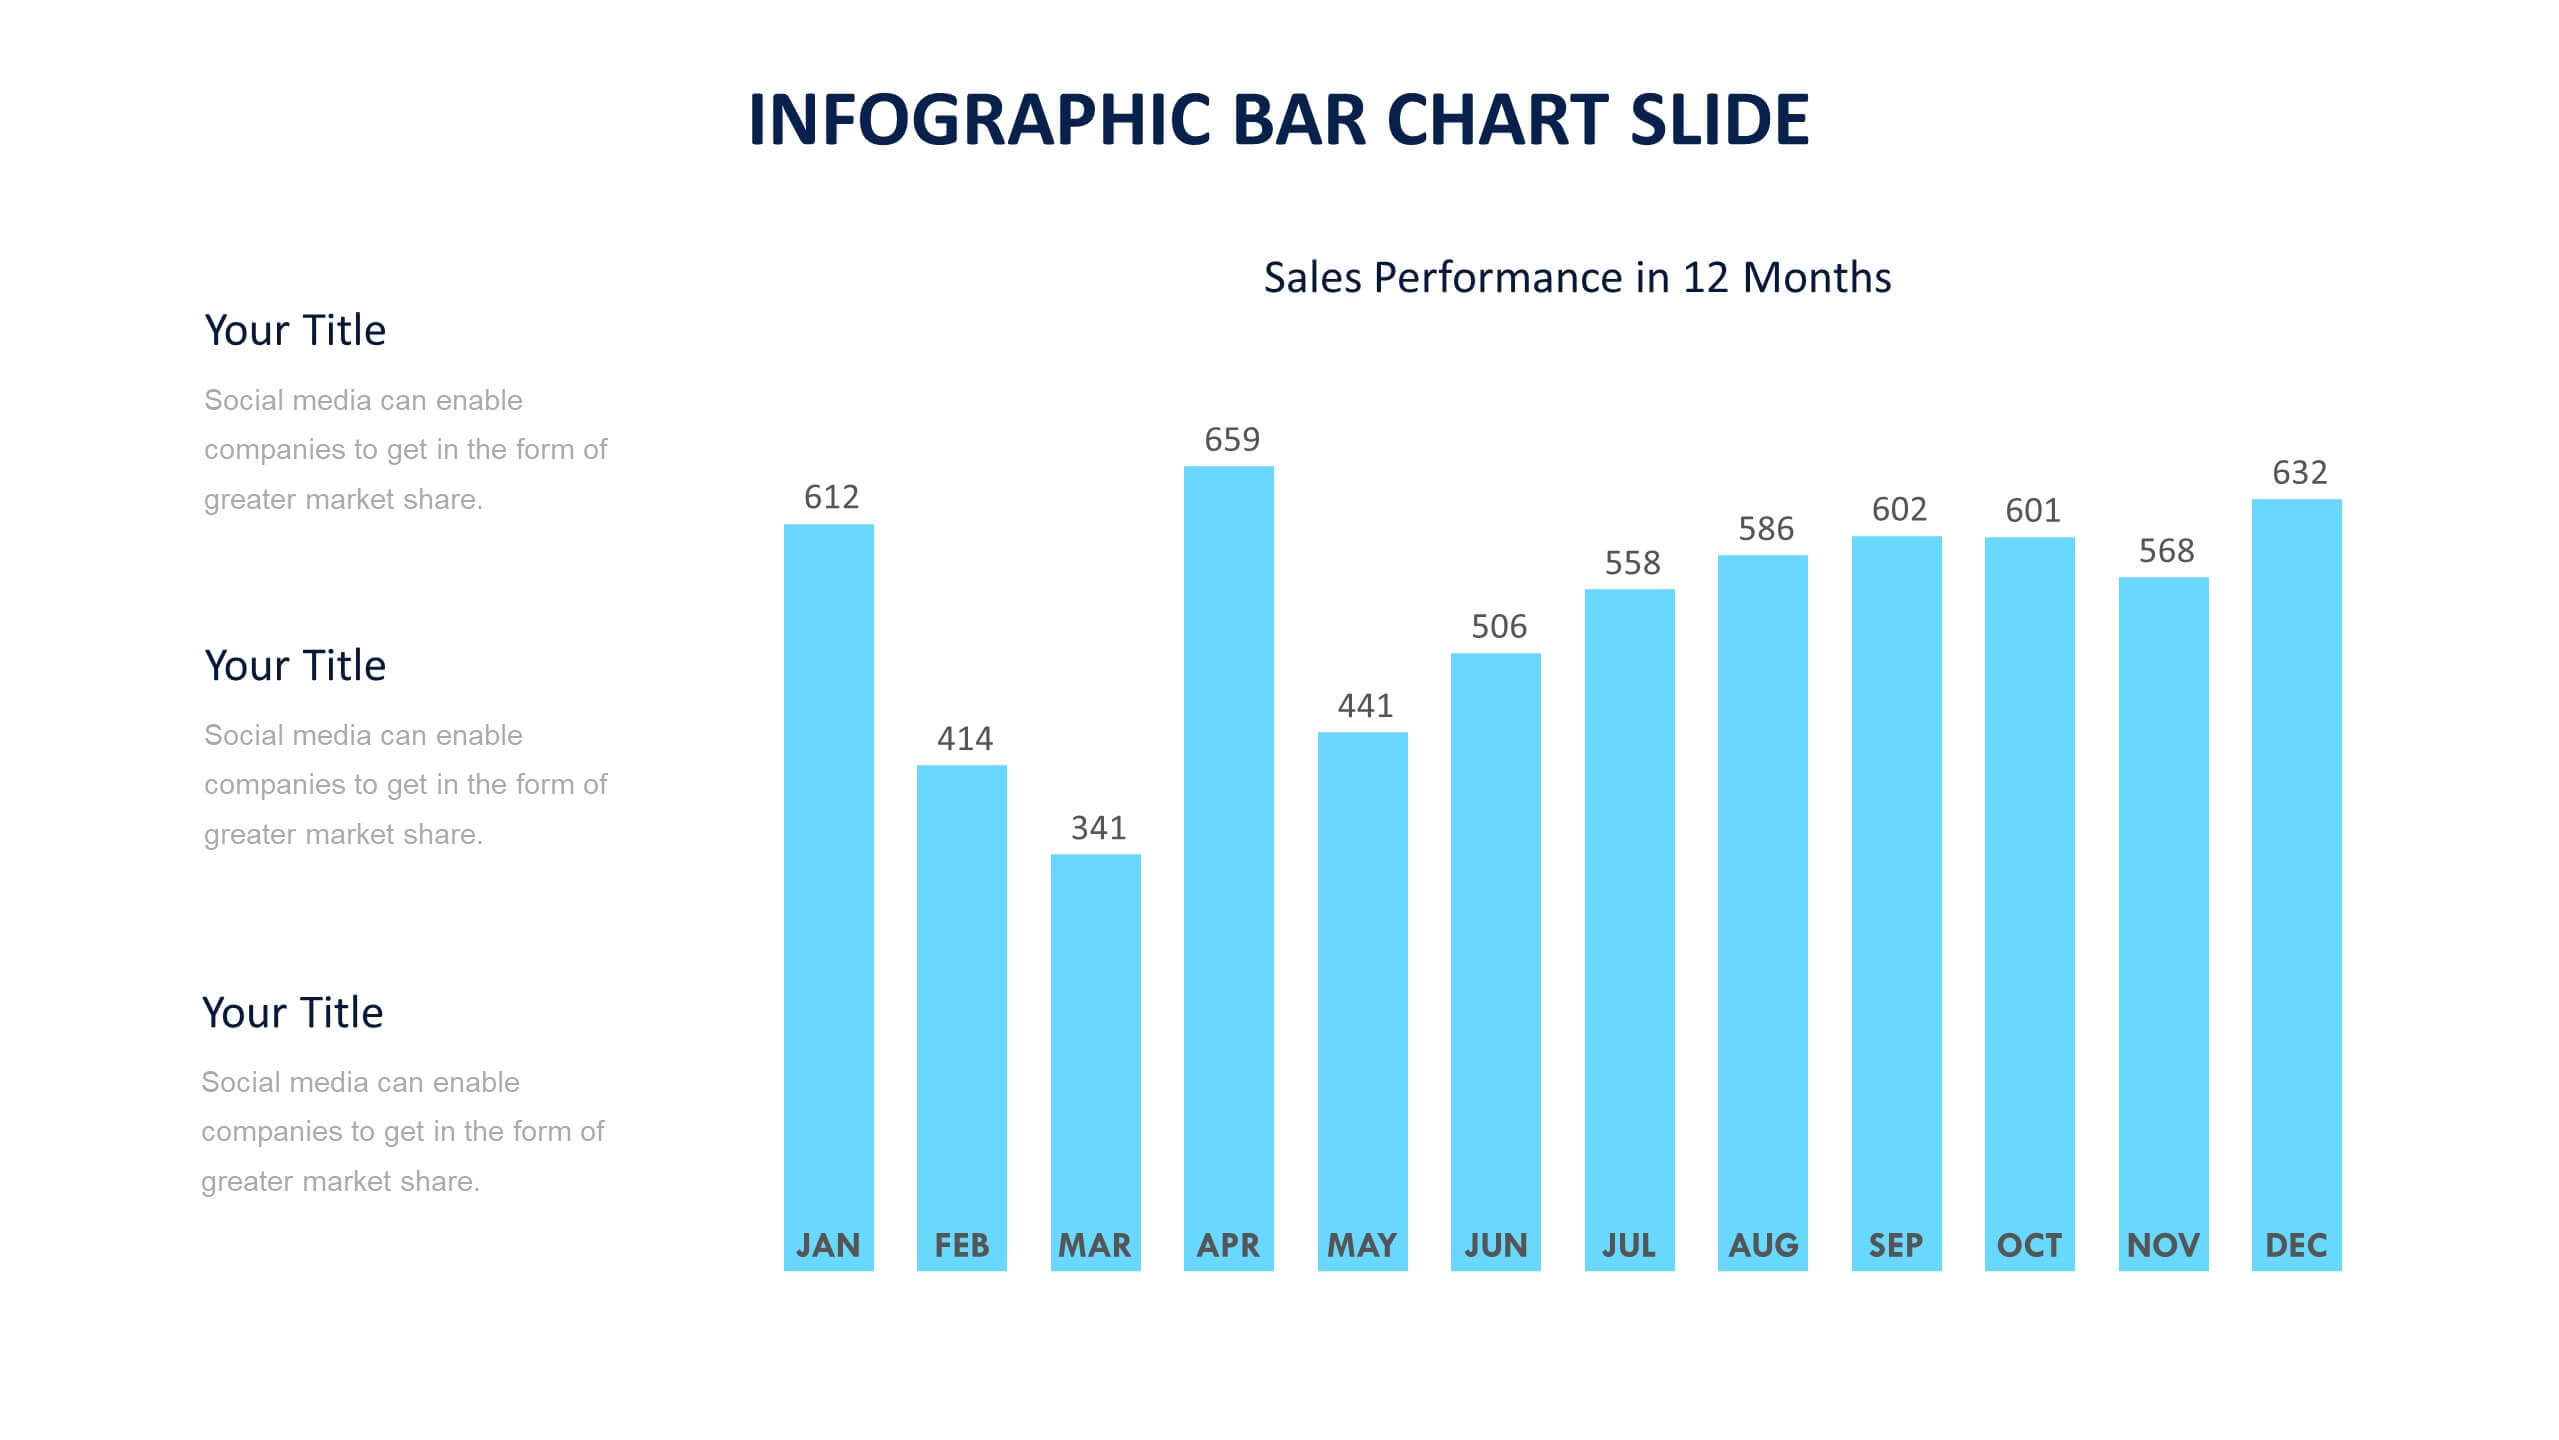
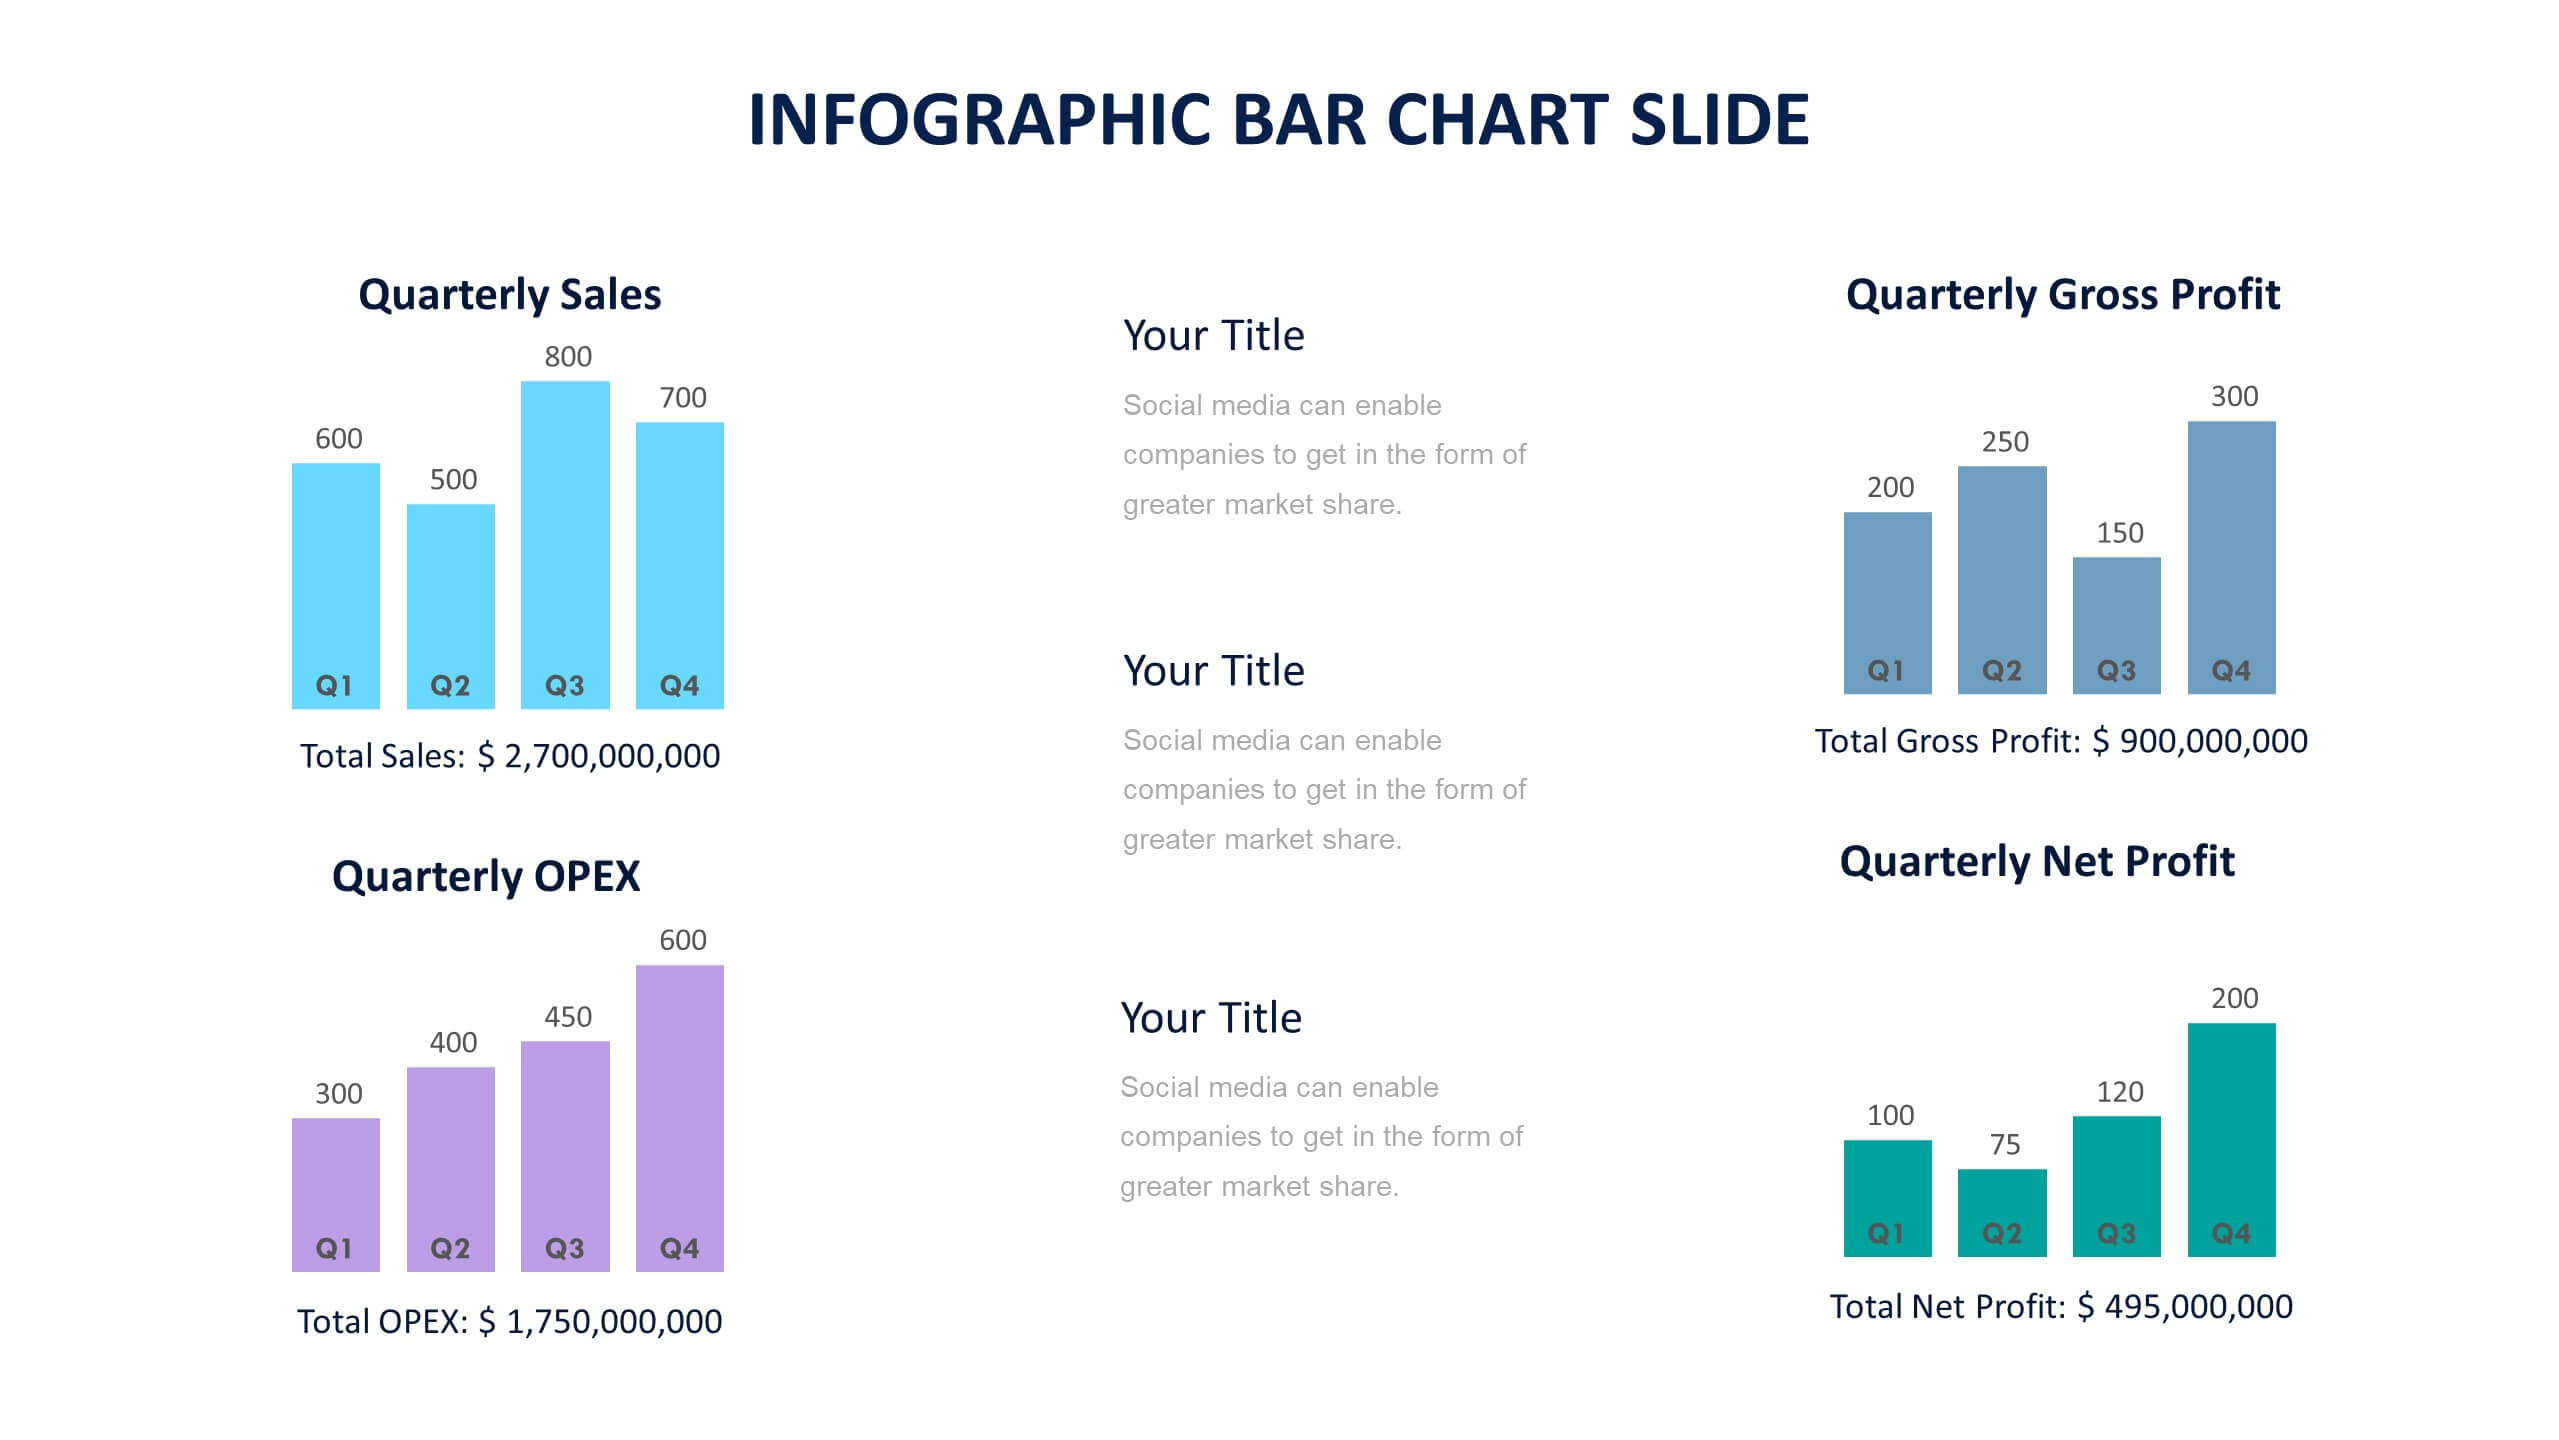
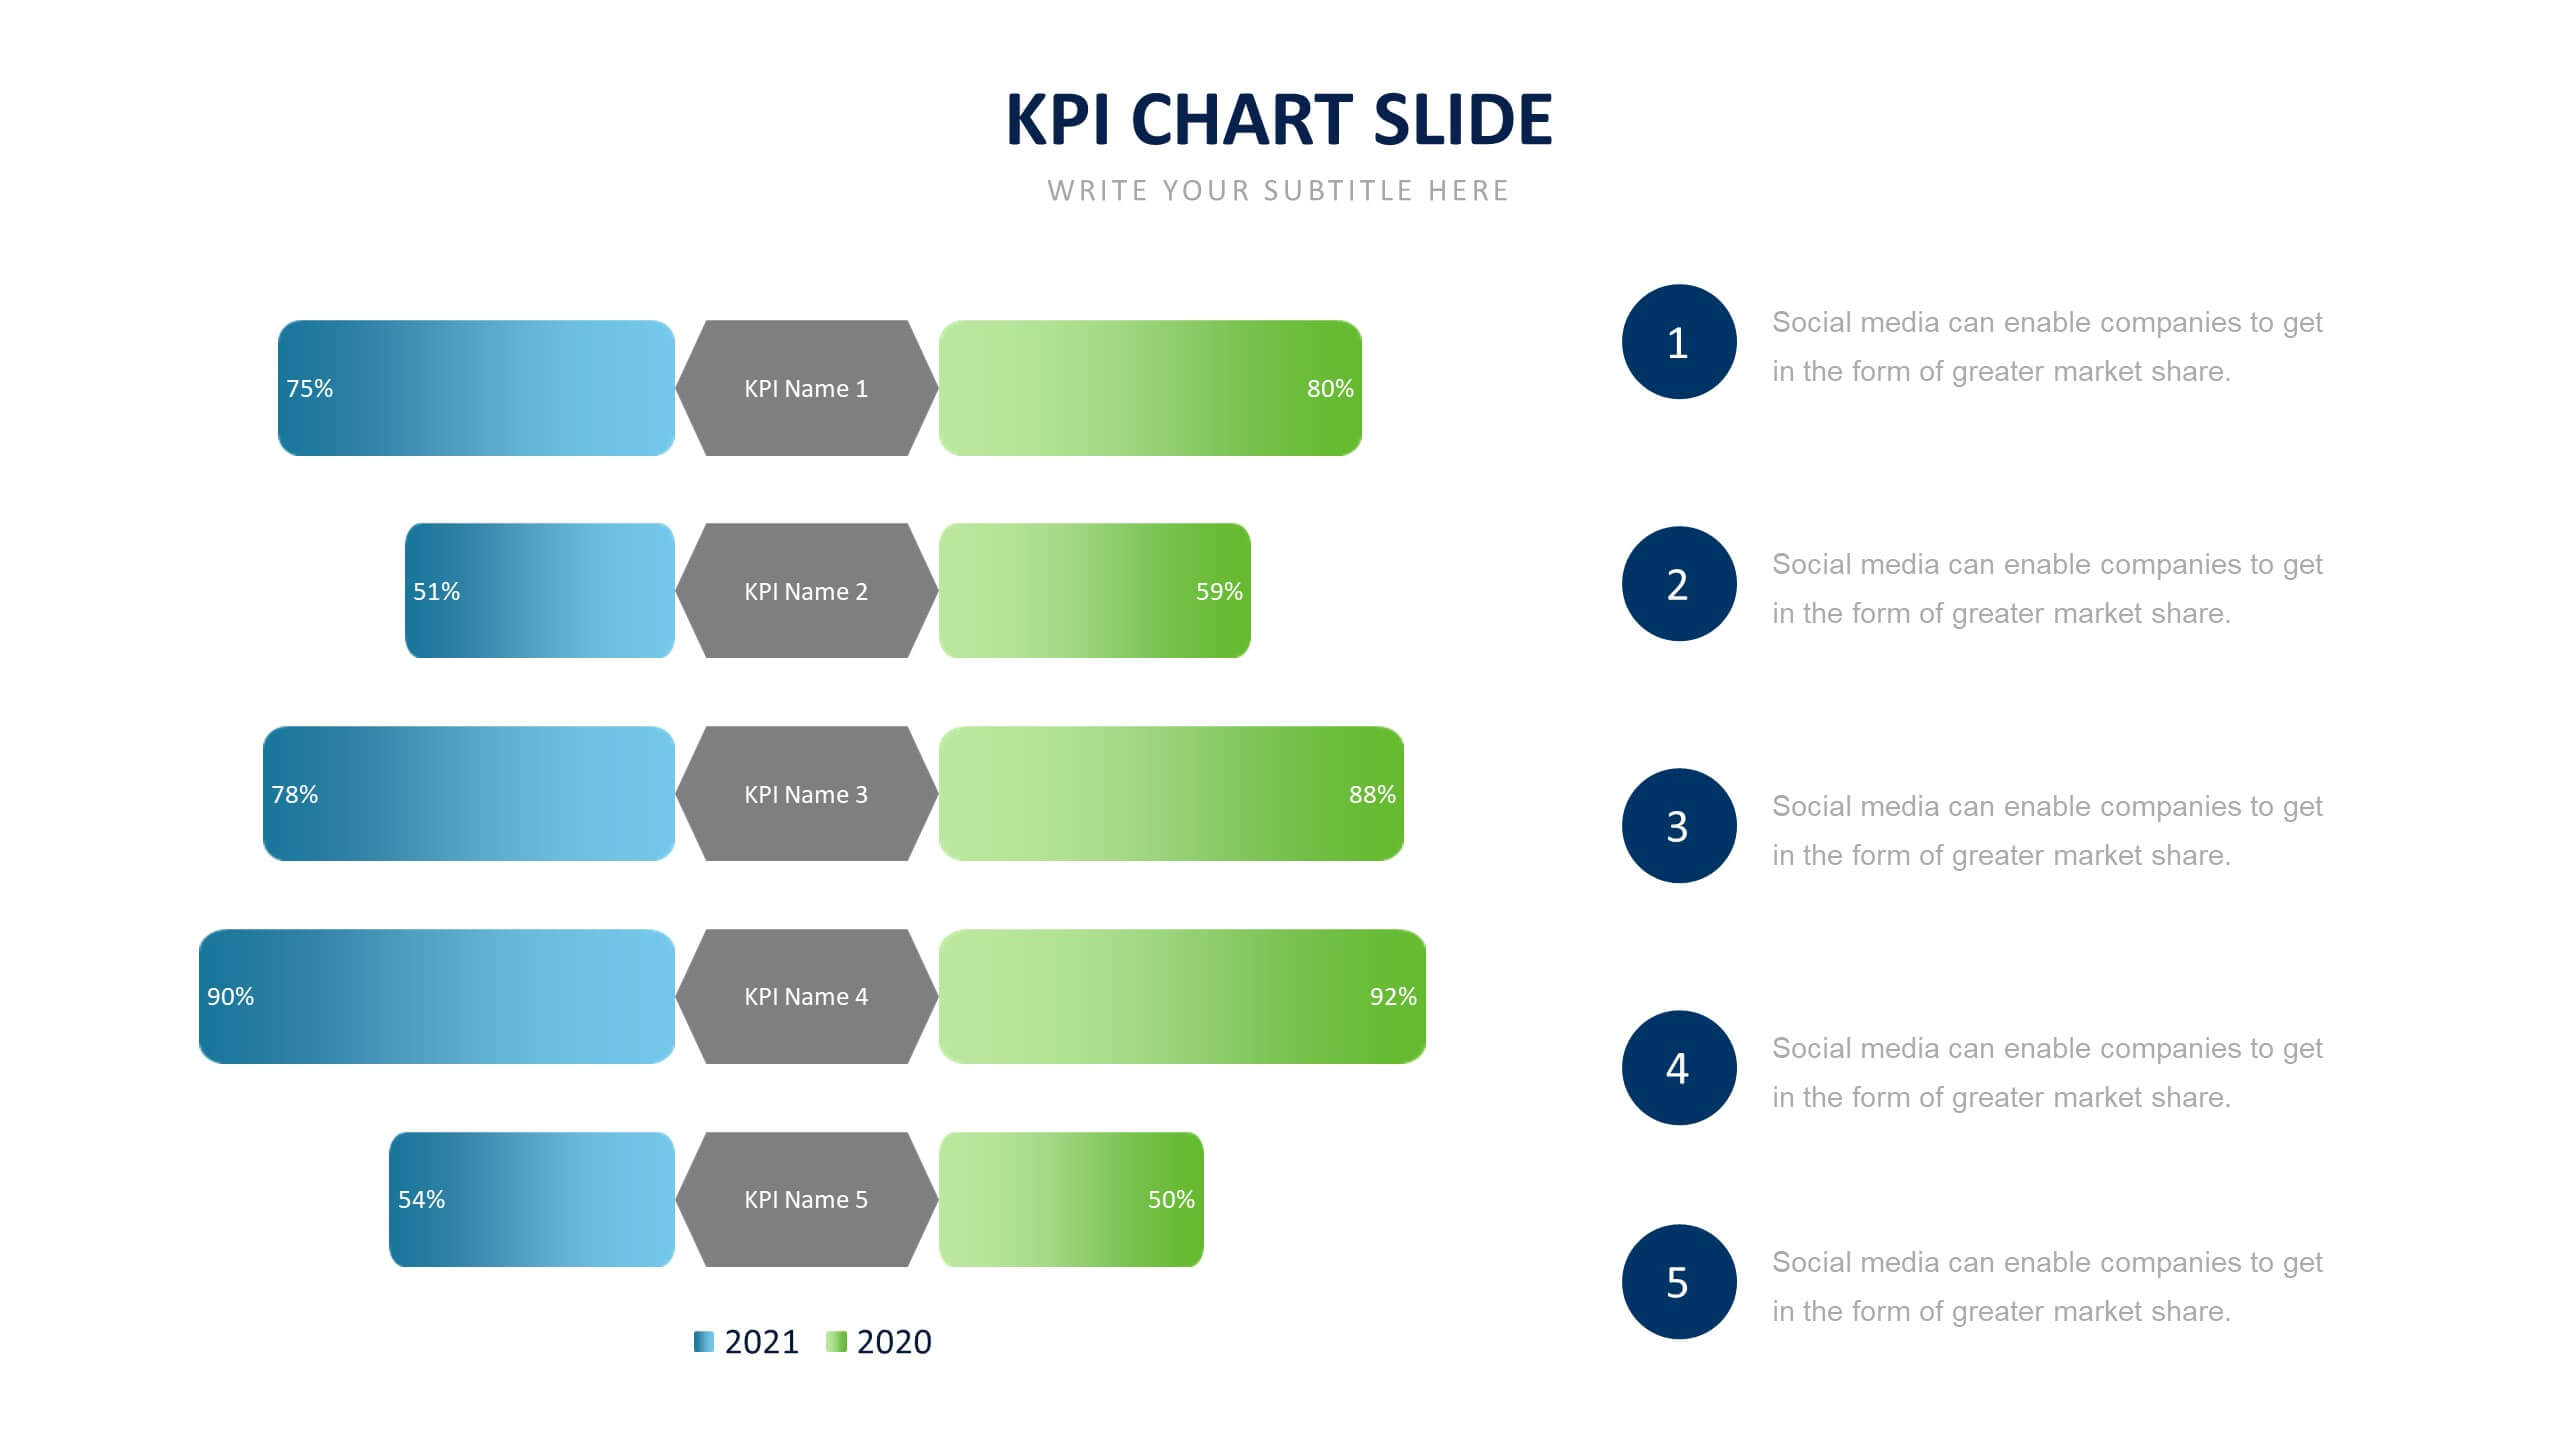
Charts are often related to Data Visualization. They are a graphical representation of data, making complex numbers more intuitive and eventually easier to read and to understand. The most common charts are column charts, bar charts, pie charts, line charts, bubble charts, gauges, radar charts, funnel charts, Gantt Charts. Diagrams also use visualization techniques to represent information. More specifically, diagrams are simplified figures or schematic illustration to show how something works or the relationships between the parts of a whole. Use the customizable presentation elements like charts and graphs that help you to articulate your data in a meaningful and articulate way for your audience.
You may also like:
We recommend getting Full Access to our presentation templates, which will give you the flexibility and more options to create an amazing and standout presentation.
Features:
- Templates are available in PowerPoint, Google Slides, and Keynote.
- PowerPoint templates are with/without animation
- Ready template, just edit your text as required
- Objects are easily editable
Download:
After successful payment, the product download link will be available in the email to download the slides.