In today’s fast-paced business landscape, data-driven decision-making is the key to success. Business dashboards have emerged as powerful tools that provide real-time insights into various aspects of a company’s performance. From financial tracking to supply chain management, these efficient business dashboards offer a holistic view of operations, enabling businesses to make informed decisions and optimize their daily processes.
In this long-form blog, we will explore some of the most effective business dashboards that can transform the way you run your operations. Let’s delve into the world of data visualization and discover how professionally designed slides and dashboards can drive efficiency and growth in your business.
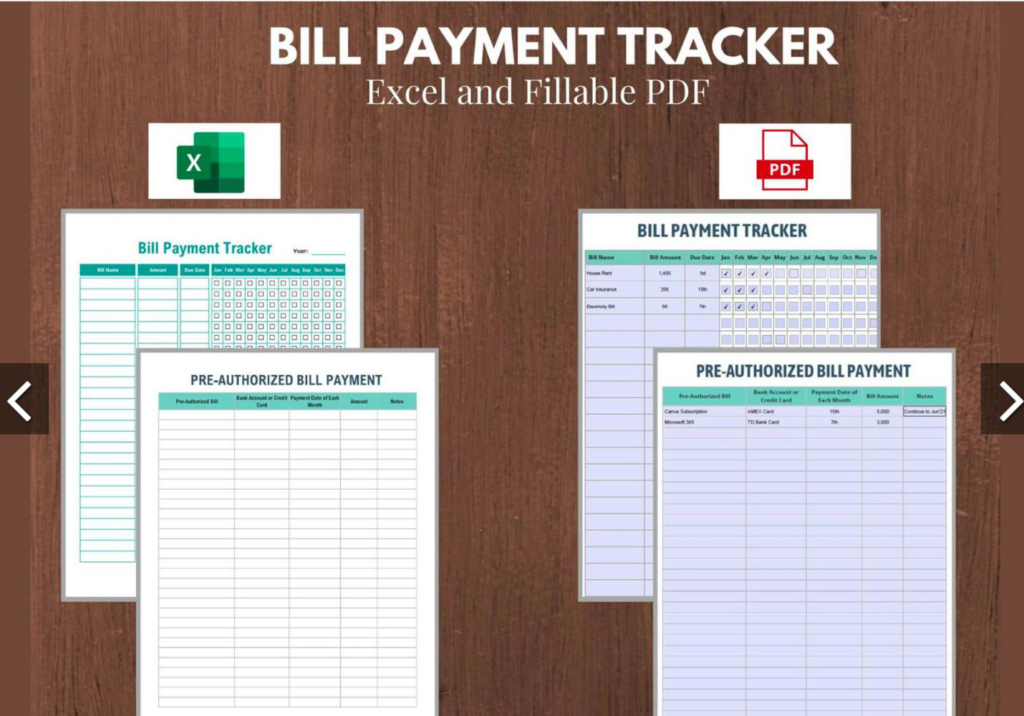
The Bill Payment Tracker Dashboard
1. Streamline Your Bill Management
For businesses of all sizes, managing bills and ensuring timely payments can be daunting. The bill payment tracker dashboard is a game-changer in simplifying this process. It centralizes tools to monitor and track all pending bills, due dates, and payment status. By visualizing this data in a clear and concise manner, the dashboard helps finance teams stay organized and ensures that no bills slip through the cracks.
2. Avoid Late Fees and Penalties
Late payment fees can have a significant impact on your company’s bottom line. With the bill payment tracker dashboard, you can set up automated reminders for upcoming due dates, minimizing the risk of missing payments and incurring unnecessary penalties. This feature helps businesses maintain a strong financial standing and ensures that cash flow remains optimized.
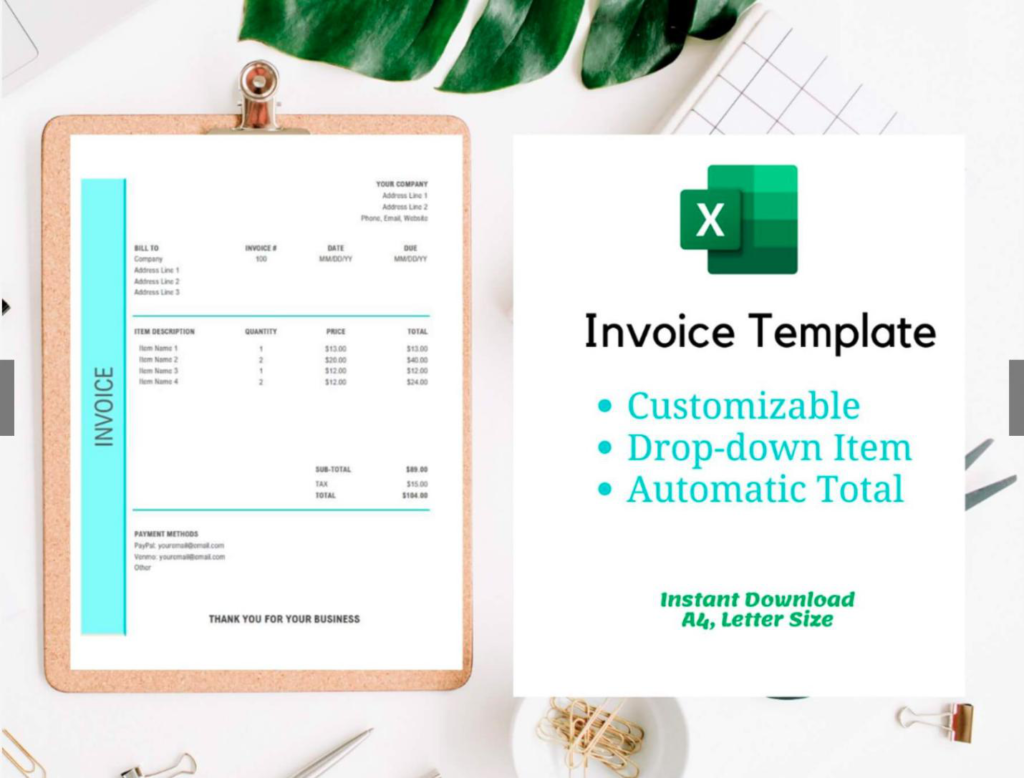
The Invoice Template Dashboard
1. Streamlined Invoicing Process
Invoicing is a critical aspect of any business, and efficiency in this process can lead to improved cash flow and customer satisfaction. The invoice template dashboard streamlines the invoicing process by providing customizable templates that are pre-designed for a professional look. This allows businesses to generate accurate and aesthetically pleasing invoices quickly.
2. Faster Payment Processing
Late payments can create cash flow gaps that hinder business operations. The invoice template dashboard facilitates faster payment processing by including payment links and options for various payment methods directly on the invoice. This convenience encourages prompt payment from customers and improves overall cash flow management.
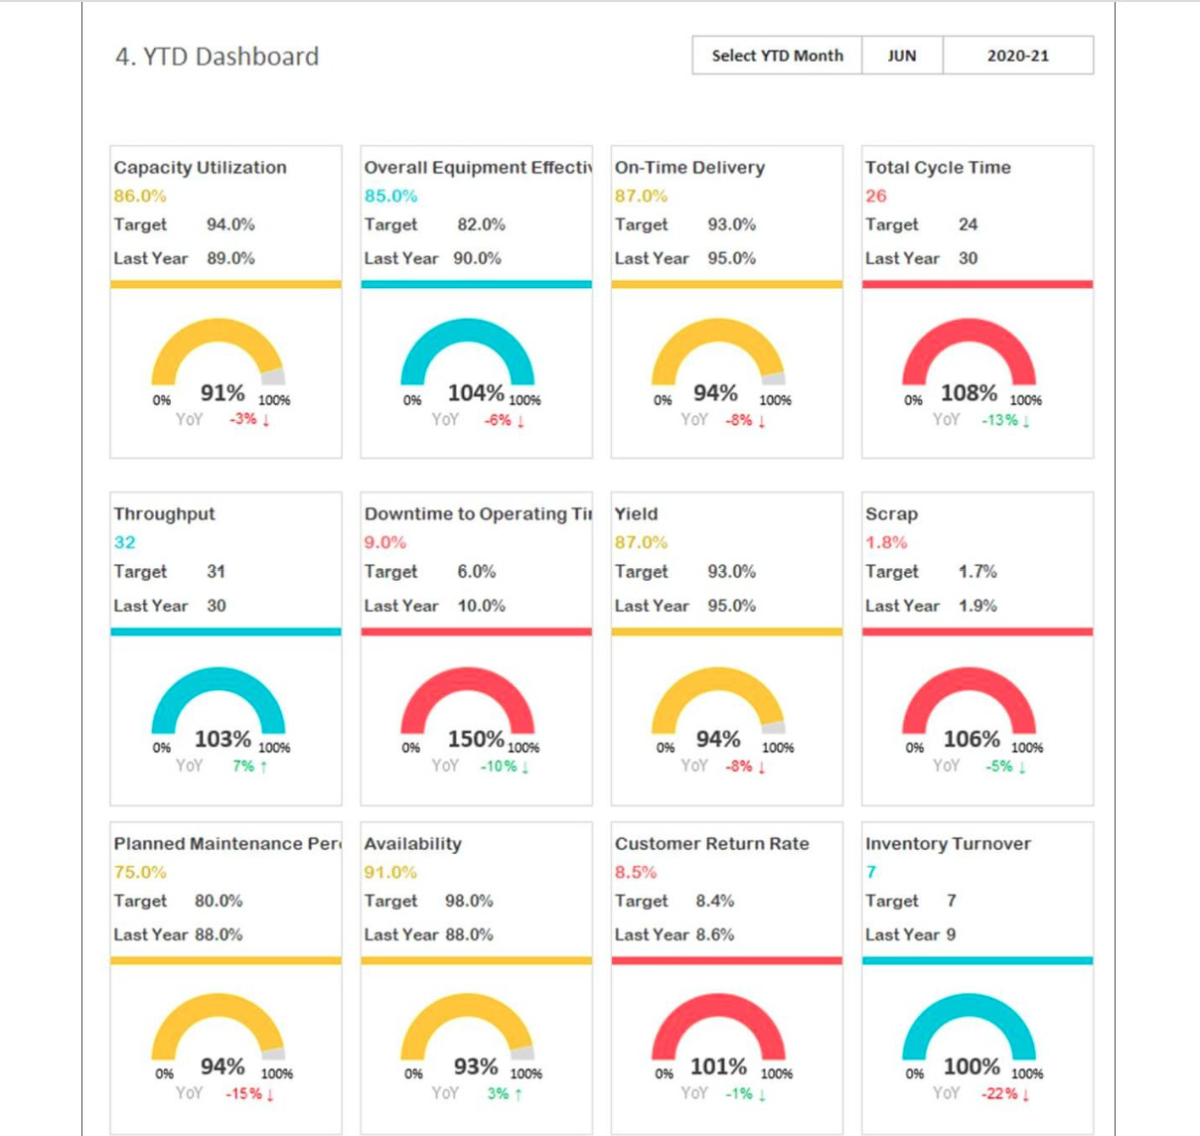
The Manufacturing KPI Dashboard
1. Optimize Production Efficiency
For manufacturing businesses, optimizing production efficiency is crucial to meeting customer demands and reducing costs. The manufacturing KPI dashboard offers real-time visibility into key performance indicators (KPIs) such as production output, machine downtime, and defect rates. By monitoring these metrics, businesses can identify bottlenecks in the production process and implement measures to enhance efficiency.
2. Improve Quality Control
Maintaining high-quality standards is paramount in manufacturing. The manufacturing KPI dashboard allows businesses to track quality-related KPIs, such as defect rates and rework percentages. With this data, manufacturers can identify areas for improvement and implement quality control initiatives to ensure that only top-notch products reach customers.
The Supply Chain KPI Dashboard
1. Optimize Inventory Management
Efficient supply chain management is essential for businesses to maintain smooth operations. The supply chain KPI dashboard offers insights into inventory levels, lead times, and stockouts. By analyzing this data, businesses can make data-driven decisions regarding inventory management, ensuring optimal stock levels and reducing carrying costs.
2. Enhance Supplier Performance
The supply chain KPI dashboard allows businesses to monitor supplier performance by tracking metrics such as on-time delivery and supplier lead times. This data enables businesses to build stronger relationships with reliable suppliers and address issues with underperforming ones.
The Sales Performance Dashboard
1. Monitor Sales Metrics
The sales performance dashboard provides a comprehensive view of sales metrics, including revenue, sales targets, and customer acquisition rates. With this data at hand, businesses can identify sales trends, forecast future revenue, and strategize sales efforts to achieve targets.
2. Enhance Sales Team Productivity
Sales teams are the driving force behind revenue generation. The sales performance dashboard helps businesses track individual sales team member’s performance, enabling managers to identify top-performing sales reps and provide support and training to underperforming ones. This fosters a culture of accountability and empowers the sales team to achieve higher productivity levels.

The Financial Performance Dashboard
1. Monitor Key Financial Metrics
The financial performance dashboard offers a comprehensive overview of a company’s financial health. It displays key financial metrics such as revenue, expenses, profit margins, and cash flow. By having these metrics readily available, businesses can make informed financial decisions, identify areas for cost-cutting, and ensure that financial goals are on track.
2. Track Budget Variance
Budget variance analysis is essential for businesses to assess their financial performance. The financial performance dashboard compares budgeted amounts with actual expenses and revenue, highlighting areas of overspending or cost-saving. This allows businesses to adjust budgets accordingly and make data-driven decisions to ensure financial stability and profitability.
The Customer Satisfaction Dashboard
1. Measure Customer Feedback
The customer satisfaction dashboard collects and analyzes customer feedback through surveys, reviews, and ratings. By understanding customer sentiments, businesses can identify areas for improvement and implement strategies to enhance customer experience.
2. Retain Loyal Customers
Tracking customer satisfaction metrics helps businesses identify loyal customers and their preferences. By engaging with loyal customers and offering personalized experiences, businesses can increase customer retention and build long-term relationships that drive repeat business and positive word-of-mouth referrals.
The Marketing Performance Dashboard
1. Monitor Marketing Campaigns
The marketing performance dashboard tracks the effectiveness of marketing campaigns and initiatives. It displays metrics like lead generation, conversion rates, and return on investment (ROI). By analyzing these metrics, businesses can identify successful marketing strategies and allocate resources to high-performing campaigns.
2. Optimize Marketing Spend
Effective marketing budget management is crucial for maximizing ROI. The marketing performance dashboard provides insights into the cost-effectiveness of various marketing channels. By identifying low-performing channels and reallocating resources to high-performing ones, businesses can optimize their marketing spend and achieve better results.
The Human Resources Dashboard
1. Employee Performance Tracking
The HR Dashboard Templates helps businesses monitor employee performance and productivity. It tracks key metrics such as attendance, task completion, and performance reviews. With this data, businesses can provide timely feedback and support to employees, fostering a culture of continuous improvement.
2. Employee Satisfaction and Engagement
Employee satisfaction and engagement are vital for a motivated and productive workforce. The human resources dashboard gathers data on employee satisfaction through surveys and feedback. By addressing concerns and implementing initiatives to improve employee engagement, businesses can boost employee morale and reduce turnover.
Efficient business dashboards have transformed the way companies manage their operations. From financial performance tracking to supply chain management, these dashboards offer real-time insights that drive data-driven decision-making and foster growth and efficiency.
Leveraging professionally designed slides and dashboards empowers businesses to unlock the full potential of their data. With customizable and visually engaging dashboards, businesses can make informed decisions, optimize processes, and achieve their goals.
Embrace the world of data-driven decision-making and stay ahead of the competition with efficient and visually engaging Professional business templates.
Visit Biz Infograph’s website today and explore the possibilities of optimized operations and increased business success with Professionally Designed Slides and Dashboards and dashboards!