Spreadsheets are the foundation of many financial processes. That’s why it pays to know how to use financial functions in Excel effectively.
Here’s a quick guide to five of the most useful Excel template functions for finance.
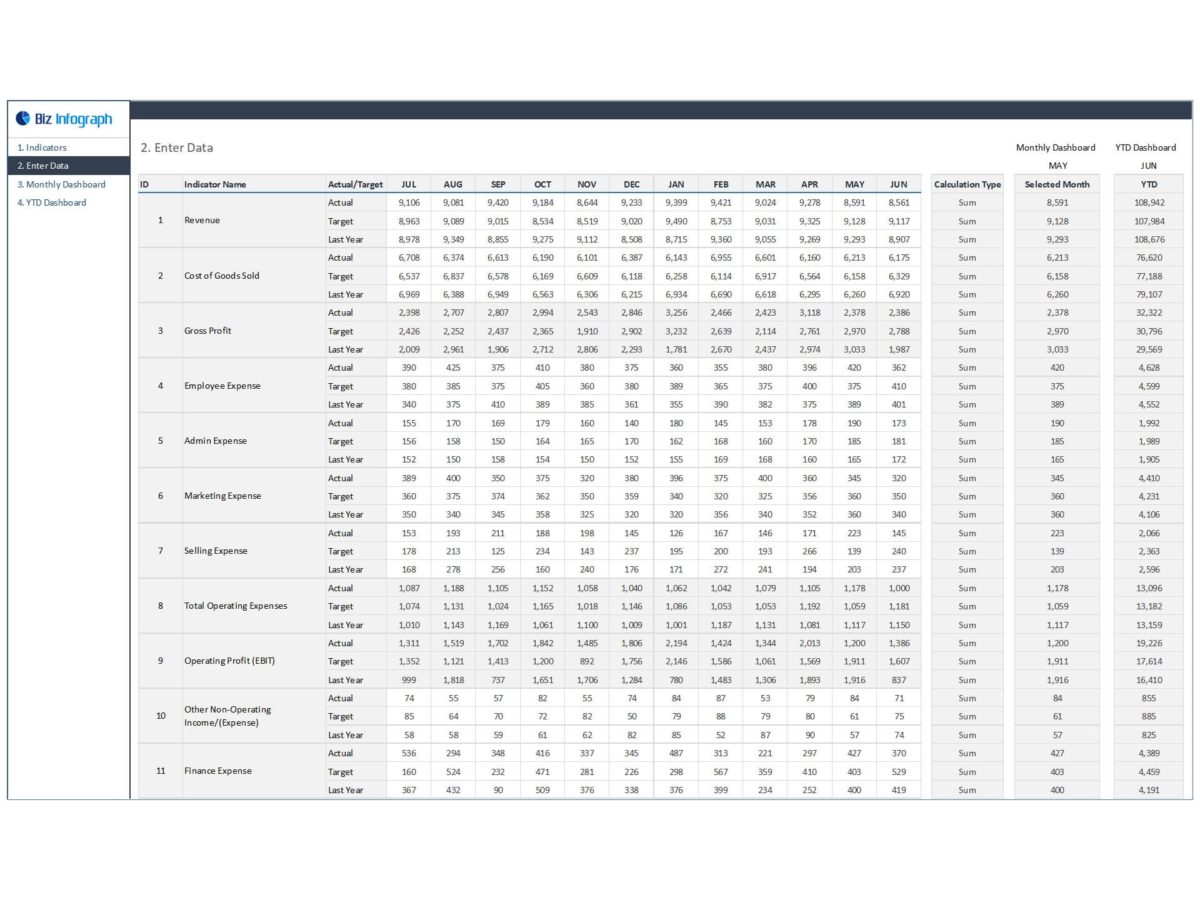
1. Sum Function
The SUM function is one of the most basic and commonly used spreadsheet functions. It allows you to quickly add up all the numbers in a range of cells with just one command.
For example, if you have a list of expenses you need to total up in the first ten cells of the first column, simply type “=SUM(A1:A10)” into an empty cell, and it will automatically calculate the sum of all the numbers in those cells. This can save you time and effort when adding up long lists of figures.
2. VLOOKUP Function
The VLOOKUP function is also incredibly useful when working with spreadsheets. It allows you to search for values within a table based on certain criteria and then return corresponding data from another column in that same table. This function can be helpful when comparing similar data sets or matching up different pieces of information.
For example, if you want to find out how many units were sold for each product, you could use VLOOKUP to look up the product name in one column and then return its corresponding sales figure from another.
3. PMT Function
The PMT function is great for calculating loans or other regular payments like rent. All you have to do is input your loan amount, interest rate, and loan period into this function, and it will give you an accurate estimate of your monthly payment over that entire period.
This financial function in Excel can help make budgeting more precise by giving you an easy way to figure out exactly how much money needs to be set aside each month for loan payments or other regular bills and expenses.
4. If Function
You can use the IF function to perform logical tests on data within a spreadsheet to take different actions depending on whether certain conditions are met or not.
For example, you can use this function in financial models where you need to make certain assumptions about future events, such as prices or exchange rates. And then, you can test those assumptions against actual results once they occur to determine whether they were accurate or not accurate predictions.
This gives financial analysts more control over their models so they can more accurately forecast outcomes based on certain true or false assumptions at any given time frame.
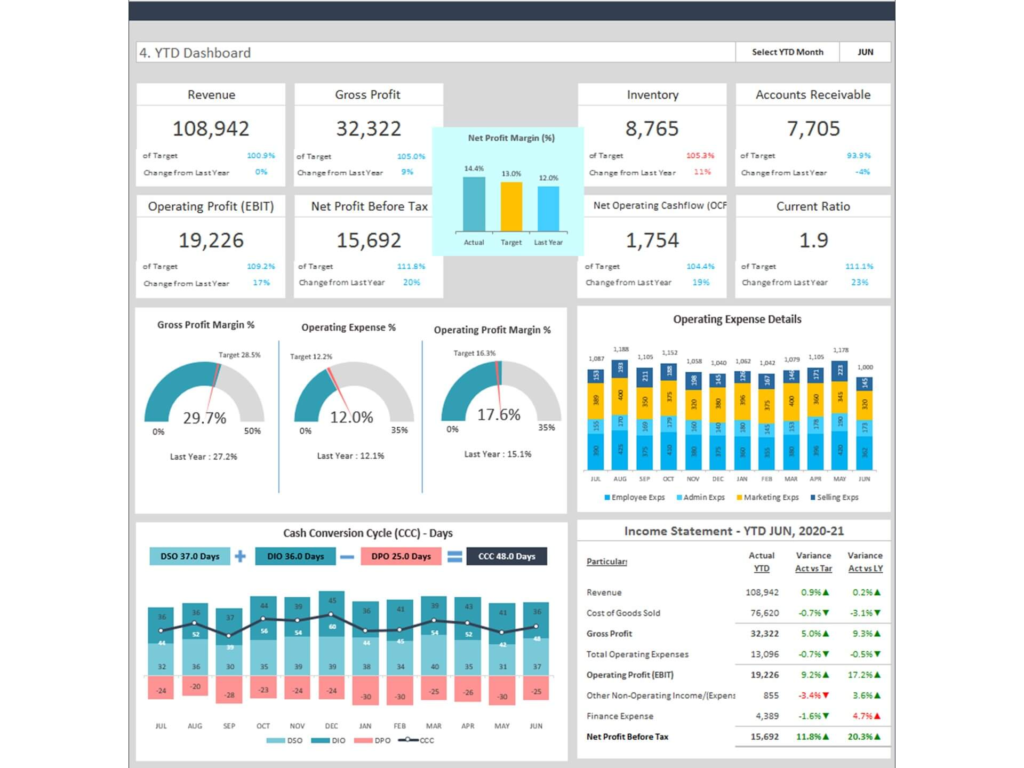
5. Pivot Tables
Pivot tables are compelling tools that allow users to quickly analyze large amounts of data without going through all of it manually line by line or cell by cell. They allow users to group similar items so that trends can easily be identified and outliers, essentially making it easier to crunch huge datasets.
Want to automate your routine tasks? Sign up for our professionally designed Excel templates today with us at Biz Infograph. We offer numerous professional business templates and Google slide themes to help you present visually appealing data interpretations.
Want to learn more about our services? Contact us today.