
Introduction to Supply Chain Dashboards
The Importance of Supply Chain Dashboards
Supply chain dashboards are crucial for modern businesses as they provide a visual representation of supply chain operations, enabling managers to monitor and analyze the flow of goods from supplier to customer effectively. By consolidating data from various supply chain stages, dashboards offer actionable insights, help in identifying bottlenecks, and support data-driven decision-making. They are instrumental in ensuring your supply chain is responsive, agile, and capable of meeting customer demand efficiently. The use of dashboards facilitates the optimization of supply chain processes, leading to improved service levels and reduced costs.
Key Elements of a Supply Chain Dashboard
A well-constructed supply chain dashboard includes key elements such as real-time data visualization, user-friendly interfaces, and customizable widgets to display vital metrics and KPIs. Essential components should cover various supply chain aspects like inventory levels, order rates, cycle times, and supplier performance. The dashboard provides a single source of truth, integrating data from multiple sources to offer a comprehensive view of the entire supply chain. Effective dashboards are designed to be intuitive, allowing supply chain professionals to easily track performance metrics and get insights into the supply chain’s efficiency.
Essential Supply Chain Metrics and KPIs – Supply Chain Dashboard Examples
Understanding Supply Chain KPIs and Metrics
Understanding supply chain KPIs and metrics is essential for measuring the effectiveness of supply chain operations. Key performance indicators (KPIs) such as cycle time, order rate, and freight cost per unit help managers assess the health and efficiency of supply chain processes. By tracking these metrics, companies can benchmark performance against historical data and industry standards, identify opportunities for improvement, and ensure that supply chain management strategies align with business objectives. A data-driven approach to supply chain KPI enables continuous optimization of the supply chain, enhancing its responsiveness and resilience to disruption.
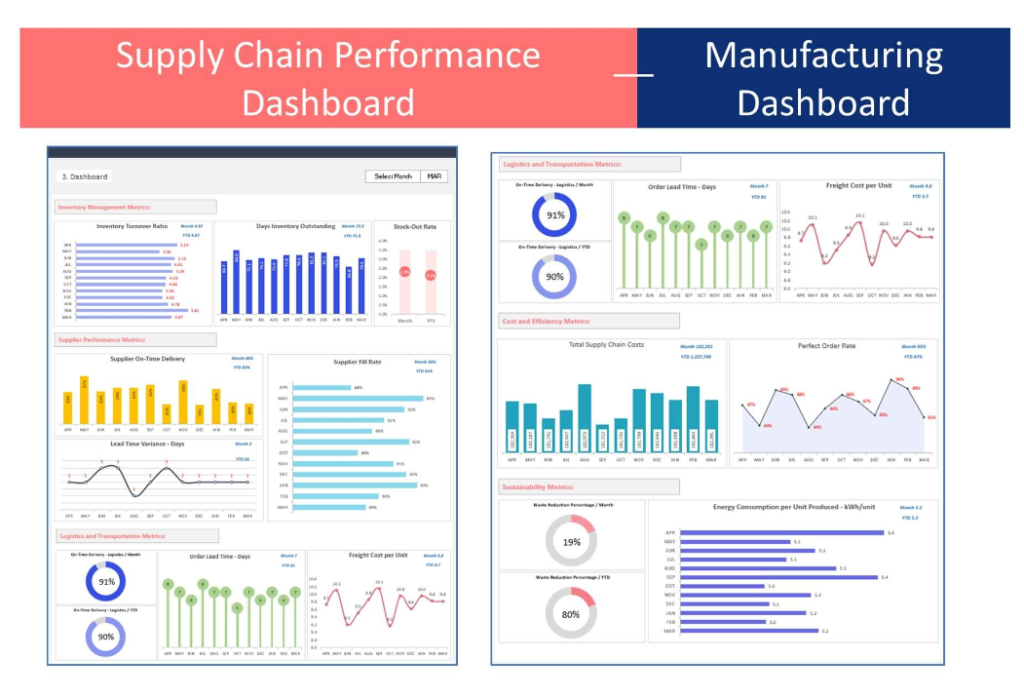
Top Metrics to Monitor: Cycle Time, Order Rate, and Days of Inventory
Top metrics to monitor in a supply chain include cycle time, which measures the total time from order placement to delivery; order rate, which assesses the frequency and volume of orders; and days of inventory, which evaluates how effectively inventory is managed. These metrics provide critical insights into supply chain performance dashboard, allowing businesses to optimize inventory, improve on-time deliveries, and meet customer demand. Monitoring these metrics helps in reducing days sales outstanding and days of payables, thereby improving cash flow and financial health.
Implementing a Supply Chain Dashboard
Data-Driven Approach to Supply Chain Management
Implementing a supply chain dashboard requires a data-driven approach to enhance supply chain management. By leveraging supply chain data and analytics, businesses can gain a deeper understanding of their operations, from logistics processes to inventory management. This approach involves collecting, analyzing, and visualizing real-time data to track key supply chain metrics and KPIs, providing supply chain leaders with the information needed to make informed decisions. A data-driven dashboard helps in monitoring supply chain performance, identifying inefficiencies, and responding quickly to market changes.
Integrating BI Tools for Enhanced Supply Chain Analytics
Integrating Business Intelligence (BI) tools into the supply chain dashboard enhances analytics capabilities, offering deeper insights into supply chain data. BI tools help in processing large volumes of data, identifying patterns, and generating predictive analytics. This integration allows for more accurate forecasting, risk assessment, and strategic planning. By utilizing BI tools, supply chain dashboards become more powerful in providing real-time, data-driven insights, enabling businesses to optimize their inventory levels, reduce cycle times, and improve overall supply chain efficiency.
Optimizing Inventory Management through Dashboards
Strategies for Reducing Days of Inventory
Reducing days of inventory is crucial for maintaining an efficient supply chain. Dashboards can assist in implementing strategies such as just-in-time (JIT) inventory, demand forecasting, and supplier collaboration to minimize stock levels without jeopardizing fulfillment. By tracking inventory metrics through dashboards, businesses can identify excess stock, streamline reorder processes, adjust safety stock levels, and inventory days of supply. This leads to lower holding costs, better cash flow management, and increased responsiveness to market demand.
Using Dashboards to Balance Stock Levels and Demand
Dashboards play a vital role in balancing stock levels with demand, ensuring that businesses maintain optimal inventory levels to meet customer needs without overstocking. By providing real-time data and analytics, dashboards help supply chain managers adjust inventory based on sales forecasts, seasonal trends, and market conditions. Effective inventory management through dashboards minimizes stockouts and excess inventory, leading to improved customer satisfaction and financial performance.
Analytics and Data Management in Supply Chains
Leveraging Supply Chain Analytics for Better Decision-Making
Leveraging supply chain analytics through dashboards empowers businesses with better decision-making capabilities. By analyzing performance metrics, shipment data, and supplier information, companies can uncover inefficiencies, predict future trends, and implement strategic changes. Supply chain metrics dashboard provides actionable insights, enabling supply chain managers to optimize processes, reduce costs, and enhance service levels. Data-driven decisions foster a more agile, efficient, and competitive supply chain.
Role of Data-Driven Insights in Supply Chain Optimization
Data-driven insights play a critical role in supply chain optimization. They allow companies to understand the complexities of their supply chain, from procurement to distribution. By utilizing data analysis and visualization, dashboards highlight key areas for improvement and enable targeted actions. This focus on data and analytics ensures that supply chain operations are aligned with business goals, enhancing performance, reducing risks, and driving sustainable growth.
Measuring Supplier Performance and Costs
Key Supplier Metrics: Performance and Reliability
Measuring supplier performance and reliability through dashboards helps businesses maintain strong supplier relationships and ensure a stable supply chain. Key metrics include lead times, quality levels, on-time delivery rates, and responsiveness to disruptions. Monitoring these metrics enables companies to evaluate supplier contributions to the supply chain, negotiate better terms, and make informed sourcing decisions. Effective supplier management enhances the entire supply chain’s performance and resilience.
Analyzing Freight Cost Per Unit and Other Cost-Related KPIs
Analyzing freight cost per unit and other cost-related KPIs through dashboards provides businesses with insights into logistics expenses and their impact on overall supply chain costs. By tracking these costs in real-time, companies can identify areas for savings, negotiate better shipping rates, and optimize route planning. Cost analysis helps in maintaining a balance between service quality and expense, contributing to a more profitable and competitive supply chain.
Enhancing Supply Chain Efficiency through KPIs
Improving Cycle Time and Perfect Order Rates
Improving cycle time and perfect order rates are crucial for enhancing supply chain efficiency. Dashboards that monitor these KPIs help businesses identify delays, assess the accuracy of order fulfillment, and implement corrective measures. Shorter cycle times and higher perfect order rates lead to greater customer satisfaction and loyalty, while also reducing operational costs. By focusing on these KPIs, companies can achieve a more streamlined, effective supply chain.
Using KPIs to Measure Supply Chain Health and Efficiency
Using KPIs to measure the health and efficiency of the supply chain is essential for continuous improvement. Dashboards that track metrics such as average inventory, on-time delivery rates, and perfect order rates provide a comprehensive view of supply chain performance. By regularly reviewing these KPIs, businesses can benchmark against industry standards, identify areas for enhancement, and implement best practices. Effective KPI tracking ensures a more responsive and efficient supply chain.
Building a Management Dashboard for Supply Chain
Features of an Effective Management Dashboard
An effective management dashboard for supply chains should include features like customizable views, real-time data updates, and easy-to-interpret visualizations. It should provide a holistic view of supply chain operations, enabling managers to quickly assess performance, identify trends, and make strategic decisions. The dashboard should also allow for seamless integration with existing systems and data sources, ensuring accurate and comprehensive data analysis.
Incorporating Real-Time Data and Analytics into Supply Chain Decisions
Incorporating real-time data and analytics into supply chain decisions via dashboards enables businesses to respond swiftly to changes and challenges. Real-time visibility into inventory levels, order status, and supplier activities helps managers make informed decisions to optimize supply chain operations. This immediacy is key to maintaining a flexible and resilient supply chain, capable of adapting to market dynamics and customer demands.
The Future of Supply Chain Management Dashboards
Trends and Innovations in Supply Chain Dashboard Technology
The future of supply chain management dashboards is shaped by trends and innovations such as AI, machine learning, and IoT integration. These technologies enhance data analysis capabilities, improve forecast accuracy, and provide deeper insights into supply chain dynamics. As dashboards evolve, they will offer more predictive analytics, automated decision-making, and enhanced collaboration features, driving further improvements in supply chain efficiency and effectiveness.
Preparing for a Data-Driven Supply Chain Future
Preparing for a data-driven supply chain future involves embracing digital transformation and investing in the right technologies and skills. Companies should focus on enhancing their data collection and analysis capabilities, adopting advanced analytics tools, and training staff to interpret and act on data insights. By fostering a culture of data-driven decision-making, businesses can ensure they remain competitive in the evolving supply chain landscape.
Conclusion: Leveraging Your Supply Chain Dashboard
Best Practices for Continuous Improvement
To leverage supply chain dashboards effectively, businesses should adopt best practices for continuous improvement, such as regularly updating data sources, reviewing metrics for relevance, and soliciting feedback from users. Continuous monitoring and analysis of dashboard data help in identifying improvement opportunities, refining supply chain strategies, and driving operational excellence.
How to Use Supply Chain Dashboards to Drive Business Success
Using supply chain dashboards to drive business success involves integrating them into daily operations, making data-driven decisions, and aligning supply chain goals with business objectives. Dashboards should be used to track performance, identify trends, and anticipate market changes. By effectively utilizing supply chain dashboards, businesses can improve efficiency, reduce costs, and enhance customer satisfaction, leading to greater overall success.
You may be interested: