Introduction to HR Headcount Dashboard Power BI
What Is an HR Headcount Dashboard Power BI and Why It Matters
An HR Headcount Dashboard Power BI solution is a reporting system that helps organizations monitor workforce size, employee movement, and staffing structure in one visual environment. A strong hr headcount dashboard turns people data into meaningful workforce reporting that leaders can review quickly. In modern human resources work, teams need more than spreadsheets to understand staffing changes. A well-built hr dashboard in power bi helps users track headcount, review trends, and identify patterns that influence planning. This matters because workforce decisions affect hiring, retention, payroll, and the overall strength of the organization.
How an HR Dashboard Supports Headcount Reporting and Workforce Insights
A good HR Dashboard supports reporting by giving users a clear picture of current and historical headcount. It helps hr leaders and hr professionals review staffing trends, hiring growth, turnover, and departmental changes through a central report. Because the dashboard presents visuals instead of only tables, it becomes easier to understand workforce insights and react to changes. A strong dashboard in power bi also improves visibility into workforce metrics such as employee counts, movement, and role mix. This helps the human resources department manage reporting more effectively and communicate workforce trends more clearly to decision-makers.
Why Businesses Use an HR Headcount Dashboard Power BI Template
Many organizations choose an HR Headcount Dashboard Power BI template because it gives them a ready-made structure for headcount reporting and workforce analysis. A reusable template helps teams standardize how they monitor employee numbers, movements, and related metrics. It also reduces reporting effort because users do not need to rebuild the same visuals every cycle. For businesses handling frequent updates, a template makes dashboard reporting faster and more reliable. This is especially useful when the organization wants consistent reporting for leadership and wants a practical format for ongoing dashboard development without starting from zero each time.
Core Benefits of HR Headcount Dashboard Power BI
Improving Workforce Visibility with Power BI HR Dashboards
Power bi hr dashboards improve workforce visibility by summarizing staffing patterns, hiring changes, and role distribution in one place. Instead of relying on multiple spreadsheets and separate HR files, organizations can use one report to understand headcount clearly. This helps leadership teams make better decisions because the report shows current counts, workforce movement, and trends over time. Better visibility also supports workforce management, since teams can monitor staffing shifts early. A strong dashboard provides not only totals but also deeper workforce insights into the structure and movement of the organization’s people.
How HR Analytics Supports Better Headcount Decisions
Hr analytics helps organizations make stronger headcount decisions because it connects staffing data with business questions. Instead of reviewing only raw totals, teams can study employee trends, hiring movement, role mix, and attrition trends to understand how the workforce is changing. A thoughtful hr analytics dashboard helps leaders decide when to hire, where to reduce gaps, and how to improve staffing strategy. It also supports retention strategies by highlighting workforce areas where exits are increasing. By using analytics to uncover insights, organizations make better staffing choices and improve long-term workforce planning.
Using Microsoft Power BI for Interactive HR Reporting
Microsoft Power BI is useful for HR because it supports visual, flexible, and interactive reporting. A dashboard built in microsoft power bi can allow users to filter by department, period, employee category, or role to understand changes more deeply. This makes reporting more practical than static spreadsheets. Since dashboard is an interactive power environment, users can move from summary to detail quickly during meetings or planning sessions. For HR teams, this means easier communication and better use of workforce data. Interactive power bi reporting helps organizations review staffing information in a clearer and more dynamic way.
Key Metrics in an HR Headcount Dashboard Power BI
Essential Headcount Metrics and HR Metrics to Track
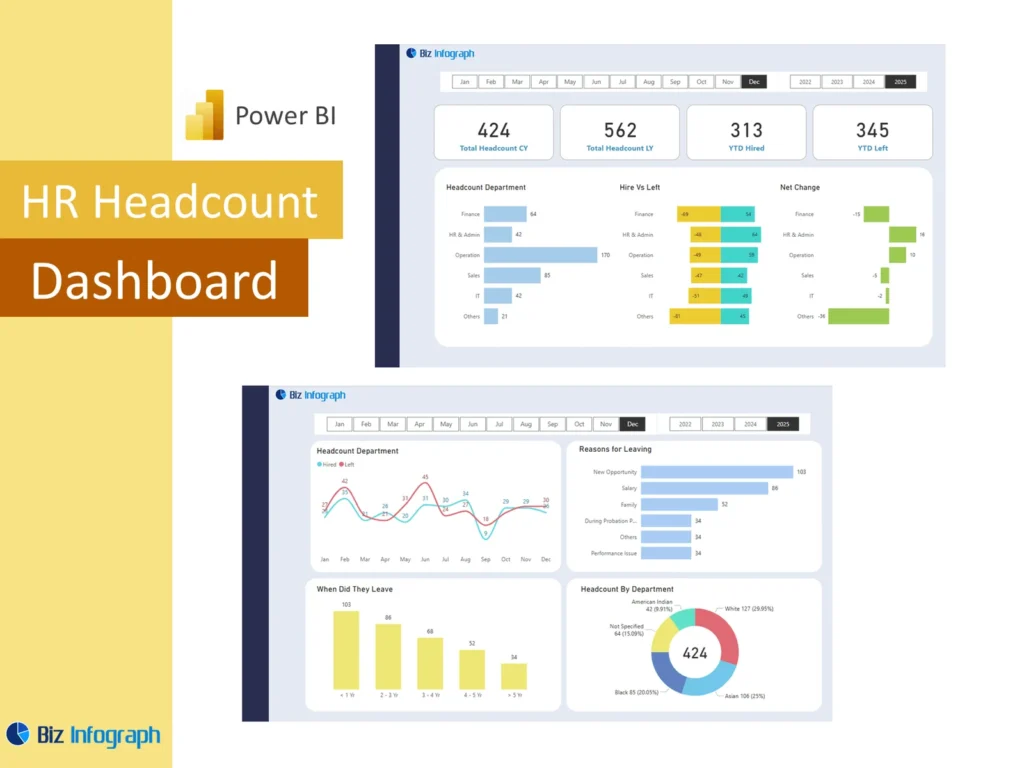
Every HR Headcount Dashboard Power BI report should include the most important hr metric and headcount measures. These usually include total employees, average headcount, number of exits, new hires, net workforce change, and role-based employee counts. These key hr metrics help organizations understand staffing levels and identify changes over time. A strong dashboard can also compare current counts with earlier periods so trends become easier to interpret. When teams focus on the right workforce metrics, the dashboard becomes a useful management tool rather than just a basic employee count report.
Using HR KPI and KPI Views for Better Workforce Monitoring
A strong headcount report should include clear hr kpi views that help users monitor workforce condition at a glance. These views may include total headcount, monthly joins, exits, average tenure, and turnover rate displayed as key performance indicators. A good hr kpi dashboard helps managers understand whether the workforce is growing, shrinking, or becoming unstable. It also improves communication because decision-makers can review the most important results quickly. When hr kpi views are displayed clearly, the dashboard becomes more practical for routine review and more useful for staffing and planning discussions.
Measuring Employee Lifecycle and Employee Performance Trends
A useful dashboard should monitor the employee lifecycle from hiring to movement and exit. This includes tracking onboarding, internal changes, turnover, and service length to understand how employees move through the organization. It may also include selected indicators linked to employee performance when the business wants broader workforce review. Looking at these patterns helps HR understand workforce stability and identify risk areas. A strong headcount dashboard that includes lifecycle analysis becomes more strategic because it shows more than workforce size. It helps the organization understand how the workforce is evolving over time and what that may mean for future planning.
HR Headcount Dashboard Power BI Features
How HR Headcount Dashboard Power BI in Excel Supports Reporting
Many organizations start their headcount reporting in spreadsheets, so HR Headcount Dashboard Power BI in Excel often begins with structured source files. Excel can hold employee listings, role assignments, hiring logs, and payroll summaries before the data is brought into Power BI. This is helpful because HR teams often already manage workforce records in spreadsheet format. Once the data is organized, Power BI can transform it into a more visual and practical report. This approach helps teams move from basic headcount tracking into more advanced workforce analysis without changing their full reporting process all at once.
Building a Strong Data Model for Accurate Headcount Analysis
A strong data model is essential for a reliable headcount dashboard. Employee records, dates, department structures, and movement categories need to connect logically so that counts and trends calculate correctly. Without a proper model, headcount reports may produce inconsistent or misleading numbers. In many projects, data analysts use power query to clean employee lists and organize inputs before building the model. A strong model makes it easier to work with complex data and ensures that the dashboard supports accurate data analysis. Better modeling leads to more dependable reporting and stronger confidence in workforce decisions.
Why an HR Headcount Dashboard Power BI Template Saves Time and Improves Accuracy
An HR Headcount Dashboard Power BI template saves time because it gives users a repeatable reporting structure that can be updated easily. Teams can refresh the data and review the latest results without rebuilding visuals and layouts every month. Templates also improve consistency because the same definitions, filters, and calculations are reused each cycle. This reduces errors and makes comparisons more dependable. For organizations that report headcount frequently, a template-based setup is practical and efficient. It helps teams focus more on interpreting workforce changes and less on formatting and redesigning reports.
Headcount Reporting and Workforce Analysis
Using an HR Dashboard to Track Headcount Trends Over Time
An HR Dashboard is especially useful for showing headcount movement across months, quarters, or years. It helps organizations review increases, decreases, and seasonal patterns in the workforce so they can understand whether the business is expanding, stabilizing, or losing staff. A strong hr headcount dashboard helps teams track headcount consistently and compare it with hiring and exit trends. This matters because seeing change over time gives better context than reviewing one number alone. Trend visibility improves workforce planning and helps leaders make more informed staffing decisions.
Monitoring Workforce Changes with HR Analytics and HR Metrics
Hr analytics and well-chosen hr metrics help organizations monitor workforce changes more effectively. These changes may include department growth, role movement, workforce aging, or shifts in headcount distribution across roles. By reviewing these patterns in one report, HR teams gain stronger actionable insights into workforce conditions. A good dashboard can also highlight monthly attrition data, hiring surges, and stability levels by business unit. This makes the report more useful for workforce planning. Monitoring change in a structured way gives HR better visibility into human capital trends and helps identify issues before they become larger problems.
How an HR Headcount Dashboard Improves Reporting Clarity
A strong hr headcount dashboard improves clarity by replacing scattered spreadsheets with a central visual report. This makes it easier for HR and leadership to review workforce size, trends, and changes without sorting through raw tables. Clear visuals reduce confusion and improve consistency in discussions. A good report can summarize workforce patterns in a way that is easier to explain during meetings or planning sessions. Because the dashboard organizes information more clearly, it helps leaders interpret results faster and supports stronger workforce communication across the business.
Dashboard Examples and Practical Use Cases
Learning from Power BI HR Dashboard Examples
Reviewing power bi hr dashboard examples helps teams understand how effective workforce reports are structured. Examples show practical ways to organize summary KPIs, trend charts, workforce tables, and detail sections without making the report cluttered. This is useful for organizations beginning their reporting journey because examples reduce guesswork and improve layout decisions. They also show how to present hiring, turnover, and payroll information clearly. Learning from examples helps teams create better reports faster and makes it easier to build an HR Headcount Dashboard Power BI solution that is both useful and professional.
How Microsoft Power Tools Support Better HR Dashboard Reporting
Microsoft power tools improve HR reporting by helping teams prepare, model, and share workforce information more effectively. Power query helps clean and shape employee records, while Power BI turns those records into a useful power bi report. Together, these tools support better reporting flow from data preparation to dashboard use. Since dashboard integrates data from multiple HR files and systems, Microsoft tools are especially helpful for reducing manual work. This makes it easier for HR teams to build reports that are more accurate, more visual, and better aligned with workforce and leadership reporting needs.
Adapting an HR Headcount Dashboard Power BI Template to Business Needs
Every organization has different workforce questions, so adapting an HR Headcount Dashboard Power BI template is important. One business may focus on turnover and hiring, while another may care more about role distribution, payroll cost, or workforce mix. A flexible template allows users to add the metrics and views that reflect those goals. This helps make the dashboard more relevant to the business and more useful in decision-making. Strong customization also allows the report to align better with the company’s staffing model, planning cycle, and workforce strategy.
Dashboard Design and Practical Value
Creating Clear KPI and HR KPI Views for Decision-Making
Clear KPI views are essential in any headcount dashboard because they help decision-makers review the most important workforce indicators quickly. A dashboard should display total headcount, net change, exits, new hires, and other HR KPI measures in a visible and easy-to-read format. This improves review speed and keeps attention on the numbers that matter most. A good HR KPI dashboard should simplify workforce reporting rather than overload users with detail. Clear KPI views help managers and HR leaders understand the current situation and make faster, better staffing decisions.
Using Dashboard Layout and Metric Design for Better Workforce Insights
Good report design plays a major role in how useful a dashboard becomes. The layout should guide users from overall workforce summary into more detailed sections such as hiring, attrition, payroll, and role structure. When the design is clear, the report becomes more practical for meetings and easier to understand. A dashboard should also present metric views in a logical order so users can connect results naturally. Strong design improves workforce insights because it helps users focus on patterns rather than searching through scattered information.
Building an HR Dashboard for Different Headcount Reporting Goals
Different organizations use headcount dashboards for different purposes. Some want simple count monitoring, while others need broader people analytics views that support hiring, retention, and diversity analysis. A dashboard may be tailored to track employee retention, workforce mix, or department-level staffing. It may even combine other HR reporting needs, such as an HR payroll dashboard for employee compensation data, or views that support pay equity review. In some cases, an HR recruitment dashboard is designed to track hiring flow, while another dashboard is designed to track turnover and role movement. Flexibility makes the dashboard more valuable.
Conclusion
Why an HR Headcount Dashboard Power BI Template Is a Practical Reporting Tool
An HR Headcount Dashboard Power BI template is practical because it combines structure, consistency, and flexibility in one reporting solution. It helps organizations organize employee data, headcount movement, and workforce indicators into a repeatable format that is easier to maintain. Templates save time, improve reporting accuracy, and support stronger comparisons across periods. Since the dashboard integrates data from multiple sources, it becomes easier to build a central workforce report that reduces manual effort. For many organizations, a template-based approach is the most efficient way to strengthen headcount reporting.
Final Thoughts on Using an HR Dashboard for Headcount Trends and Workforce Insights
A well-designed HR Dashboard helps organizations understand how the workforce is changing and what those changes may mean for future planning. It can reveal attrition trends, hiring growth, workforce mix, and broader human capital patterns in a clearer way than spreadsheets alone. Whether the report focuses on headcount, recruitment, payroll, or diversity, the value comes from turning workforce data into action. For example, an HR attrition dashboard helps identify turnover issues, while an HR diversity dashboard analyses representation patterns, and another dashboard analyses the correlation between workforce structure and cost. Clear reporting leads to better workforce decisions.
For ready-to-use Dashboard Templates: