Introduction to HR Termination Dashboard Power BI
What Is an HR Termination Dashboard Power BI and Why It Matters
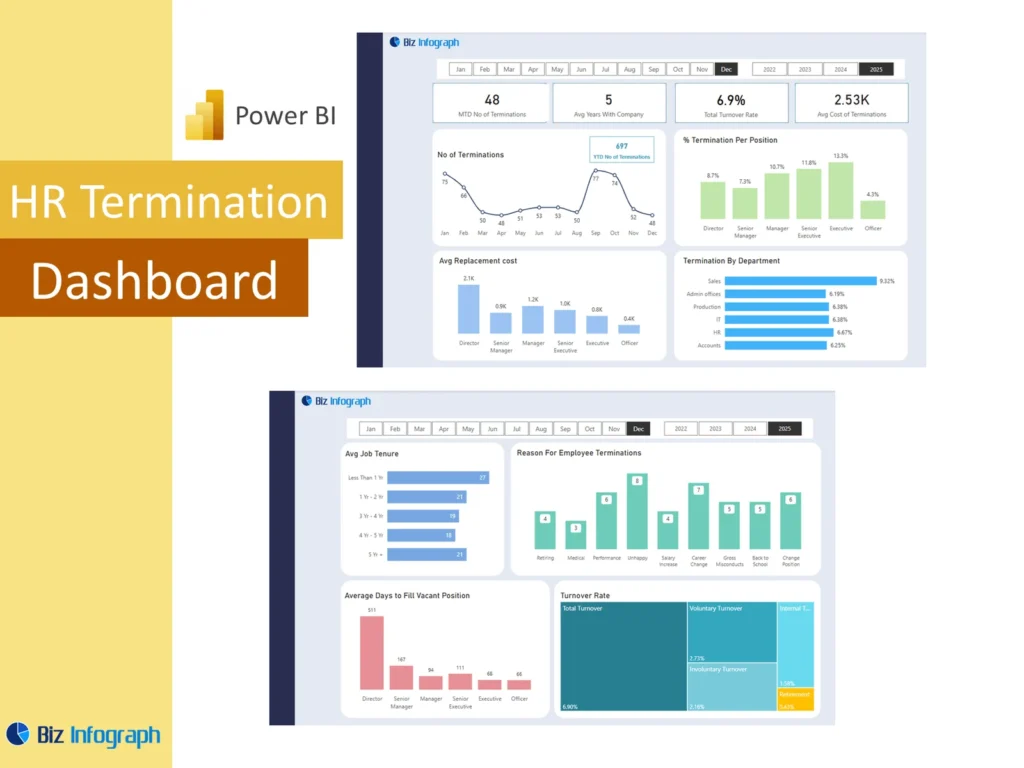
An HR termination dashboard Power BI solution is a reporting tool designed to help organizations monitor employee exits, turnover patterns, and workforce changes in one visual view. Instead of reviewing separate spreadsheets and manual summaries, HR teams can use one power bi dashboard to understand exit activity more clearly. This matters because employee turnover affects cost, hiring, productivity, and workforce stability. A strong dashboard helps hr professionals review what is happening across the business and identify patterns early. With clearer reporting, the organization can respond faster and make better workforce decisions based on real data.
How an HR Dashboard Supports Employee Turnover Reporting and Insight
A well-structured HR Dashboard improves turnover reporting by organizing exit trends, workforce counts, and employee categories into a clear format. A strong power bi hr dashboard helps teams compare termination patterns by department, period, or employee group without searching through multiple files. It turns complex hr data into something more understandable and more useful. This supports better insightful review because HR can see both the overall picture and the details behind it. By improving visibility, the dashboard helps the organization understand turnover more clearly and supports stronger planning, communication, and workforce management.
Why Businesses Use an HR Termination Dashboard Power BI Template
Many organizations choose an HR termination dashboard Power BI Template because it gives them a ready structure for tracking turnover and termination activity. A reusable template or dashboard template saves time by providing summary sections, graphs, trend views, and detailed analysis pages without starting from scratch. It also improves consistency because the same layout and logic are used each reporting cycle. For teams that need recurring turnover analysis, a template makes reporting faster and more dependable. It helps HR focus on interpretation and action instead of rebuilding the report every month or quarter.
Core Benefits of HR Termination Dashboard Power BI
Improving Attrition Visibility with an HR Analytics Dashboard
An hr analytics dashboard improves visibility by putting exit patterns, workforce counts, and attrition indicators into one report. Instead of reviewing terminations in isolation, HR can use an attrition dashboard to see how employee exits are changing across departments, time periods, and employee segments. Better visibility matters because turnover often develops as a pattern before it becomes a larger business issue. A dashboard lets users see these patterns earlier. This gives leaders a clearer view of workforce stability and helps them act before turnover creates serious disruption across the organizational structure.
How HR Analytics Supports Better Termination and Attrition Decisions
Strong hr analytics help the business move beyond counting exits and start understanding the reasons and patterns behind them. By analyzing termination data, HR can compare turnover by location, tenure, role, or team and identify where the problems are most serious. This supports better workforce decisions because the company can focus attention where it matters most. A strong dashboard provides actionable insights instead of just totals. That means HR can review trends, target interventions, and support managers with better evidence. Better analytics lead to better responses to turnover and more effective retention planning.
Using Power BI for Interactive Employee Exit Reporting
Organizations often use power bi because it makes HR reporting more flexible and easier to explore. A dashboard using power bi allows HR teams to filter, compare, and analyze termination records quickly without creating separate reports each time. With interactive dashboards, users can move from a high-level summary to department or employee-group detail in seconds. This is one reason many teams choose power bi for hr reporting. The dashboard becomes easier to use in meetings, easier to explain to leadership, and much more useful for ongoing turnover monitoring and workforce planning.
Key Metrics in an HR Termination Dashboard Power BI
Essential Employee and Attrition Metrics Every Business Should Track
Every HR termination dashboard Power BI report should include the key hr metrics needed to understand turnover clearly. These often include total exits, attrition rate, voluntary and involuntary exits, terminated employees, and workforce counts. Many teams also include key performance indicators such as turnover by month, turnover by business unit, or exit rate against workforce size. These measures give a practical view of how serious turnover is and whether it is increasing. A good dashboard brings these metrics together so leadership can assess the state of the workforce more quickly and more accurately.
Using Termination Trends and Active Employees Data for Better Reporting
A good dashboard should compare exits with active employees so that turnover is reviewed in the right context. Looking only at the number of exits can be misleading if workforce size changes at the same time. When termination data is paired with active headcount, the business gets a stronger understanding of relative attrition. Trend reporting is also important because HR needs to see how turnover changes over time, not just at one point. This combination makes the dashboard more useful for reporting and gives leaders a stronger basis for workforce decisions and retention discussions.
Measuring HR Reporting Insight Through Attrition Dashboard Views
An attrition dashboard should do more than show totals. It should create real reporting insight by helping users compare exit patterns across groups, time periods, and workforce categories. This may include attrition by team, tenure band, role, or employee type. A strong HR Dashboard makes the information easier to understand by organizing it into meaningful views. These views allow teams to move from basic reporting into interpretation. Better insight helps leadership understand whether turnover is normal, whether it is concentrated in specific areas, and whether action should be taken to improve stability.
HR Termination Dashboard Power BI Features
How HR Termination Dashboard Power BI in Excel Supports Reporting
Many organizations begin their turnover reporting in spreadsheets, so HR termination dashboard Power BI in Excel often starts with source files that contain employee status changes, headcount, and exit records. Those spreadsheet files can then feed into the final dashboard. This is practical because HR teams often already maintain reports in Excel before moving to dashboard in power bi reporting. Once connected, Power BI makes the information more visual and easier to analyze. This approach helps the organization move from manual summaries to a stronger reporting environment without changing every part of the workflow at once.
Using Power Query to Transform Employee Data for Better Analysis
Power Query is especially useful when HR needs to clean, shape, and standardize employee records before reporting. Teams may have workforce data coming from spreadsheets, HR systems, or even sql databases, and those records often need preparation before they are reliable enough for analysis. Power Query helps transform raw inputs into a cleaner structure for the dashboard. This is important because the quality of the analysis depends on the quality of the prepared data. Better transformation creates stronger reporting, fewer errors, and a more trustworthy view of turnover and workforce movement.
Why an HR Termination Dashboard Power BI Template Saves Time and Improves Accuracy
A reusable HR termination dashboard Power BI template saves time because users can refresh the report instead of redesigning it each period. It also improves accuracy because the same definitions, calculations, and report sections are used consistently. This reduces confusion and makes it easier to compare results across periods. A strong template supports ongoing termination reporting with less manual effort. For HR teams that prepare recurring reports for managers or executive review, a reusable structure makes analysis faster and more dependable. It also improves clarity because users know where to find the same information each time.
Employee Turnover Reporting and Analysis
Using an HR Dashboard to Monitor Termination Trend Over Time
An HR Dashboard is highly useful for showing termination activity over time because patterns are easier to understand when viewed across months or quarters. A trend view helps HR see whether exits are rising, falling, or staying stable. This matters because turnover issues are often easier to address when identified early. A dashboard can show these changes through a graph or time-based chart that makes movement clear. Trend reporting gives the business a better understanding of workforce stability and helps managers prepare responses based on changing turnover behavior rather than isolated numbers.
How an Overview Page Improves Reporting Clarity and Decision-Making
A strong overview page improves clarity by giving users a quick snapshot of the most important turnover indicators before they move into deeper analysis. This page may show total exits, attrition rate, key departments affected, and recent trend movement. A high-level view is especially useful for managers and executive users who need a summary first. It improves decision-making because users can understand the current situation quickly and then use drill-down features for more detail. A well-designed overview page makes the dashboard much more practical and much easier to use in real meetings.
Building Interactive Dashboards for Better Employee Turnover Insight
Interactive dashboards make turnover reporting more useful because users can filter and explore the data instead of reading static tables. A good power bi dashboard may let users click by department, role, period, or workforce segment to see where exits are concentrated. Features like drill-through help users move from summary to detailed employee or team analysis more efficiently. This level of interaction improves insight because the report becomes a tool for investigation, not just presentation. A more interactive dashboard gives HR better visibility and supports stronger analysis of turnover causes and patterns.
Dashboard Examples and Practical Use Cases
Learning from Dashboard Examples for HR Termination Reporting
Reviewing dashboard examples helps HR teams understand how effective turnover reporting can be structured. Good examples show how to organize summary metrics, trends, workforce comparisons, and visuals in a way that is easy to interpret. They also help teams avoid clutter and choose practical layouts. Looking at examples is especially useful when businesses are building their first HR termination dashboard Power BI solution. It reduces design mistakes and helps teams focus on what matters most. A strong example can improve layout, visual flow, and the overall usefulness of the report.
How to Use Power BI for Different HR Termination Use Cases
Organizations can use power and microsoft power bi for many termination-related use cases, depending on what they want to understand. Some may focus on voluntary exits, others on department-level turnover, and others on location or tenure patterns. The dashboard may also include views by role, workforce type, or demographic group if those are relevant to the business. Different use cases require different report designs, but Power BI makes that possible with flexible filters and visuals. This adaptability is one reason organizations often choose it for turnover and workforce reporting.
Adapting an HR Termination Dashboard Power BI Template to Business Needs
A strong HR termination dashboard Power BI template should be customizable enough to reflect the business’s actual reporting priorities. One organization may care most about voluntary attrition, while another may focus on exits among managers or front-line teams. Some may want to add demographics such as age band, service length, or location to identify patterns more clearly. Others may need a more high-level executive summary. Adapting the template makes it more relevant and more useful in practice. It ensures that the dashboard supports real business questions instead of generic reporting.
Dashboard Design and Practical Value
Creating Clear Reporting Views in a Dashboard in Power BI
Good design is essential in any dashboard in power bi because users need to understand turnover clearly and quickly. A strong layout may begin with summary KPIs and then move into trend visuals, team comparisons, and detailed breakdowns. Clear reporting views help HR interpret results faster and reduce confusion in meetings. A dashboard should also balance summary and detail so both managers and analysts can use it. When the reporting views are organized well, the dashboard becomes more practical and gives the business a clearer understanding of workforce exit patterns.
Using Interactive and Performance Dashboard Elements for Better HR Analysis
A strong turnover report can benefit from performance dashboard elements such as KPI cards, trend comparisons, and focused visuals that make reporting easier to read. For example, a stacked bar chart can compare exit reasons across departments, while charts and filters can show differences across teams or time periods. These interactive elements help users move from summary to explanation more easily. The result is a more useful analysis experience. When the dashboard is designed with interaction in mind, HR can explore turnover more deeply and make more informed choices about workforce actions.
Building an HR Dashboard for Different Attrition and Termination Goals
Different organizations build dashboards for different goals. Some focus on reducing attrition, others want better reporting on employee turnover, and some want to compare turnover across departments or workforce groups. A good HR Dashboard can be adapted to each of these needs. It may highlight exit counts, rates, retention challenges, or structural workforce issues depending on the audience. Building around these goals helps the report stay relevant and useful. It also makes the dashboard a stronger management tool because it reflects what the organization actually wants to understand and improve.
Conclusion
Why an HR Termination Dashboard Power BI Template Is a Practical Reporting Tool
An HR termination dashboard Power BI template is practical because it combines speed, consistency, and structure in one report. It helps HR teams organize turnover data, monitor patterns, and present findings in a way that is easier to understand than manual reports. Templates also reduce repetitive work and support more consistent reporting across periods. For teams that need recurring attrition analysis, this makes reporting much more efficient. A reusable dashboard structure helps the organization focus on analysis and action instead of spending time rebuilding the same report over and over.
Final Thoughts on Using an HR Dashboard for Employee Turnover Analysis and Better HR Reporting
A well-designed HR Dashboard for turnover reporting helps organizations understand exit patterns, workforce stability, and where attention is needed most. It brings together termination data, trend analysis, and employee context into one view that supports better decisions. Whether the business is reviewing terminated employees, overall attrition, or specific workforce groups, the dashboard creates a clearer basis for action. With stronger reporting, leaders can make better decisions, gain more useful insight, and respond to workforce issues with greater confidence and speed.
For ready-to-use Dashboard Templates: