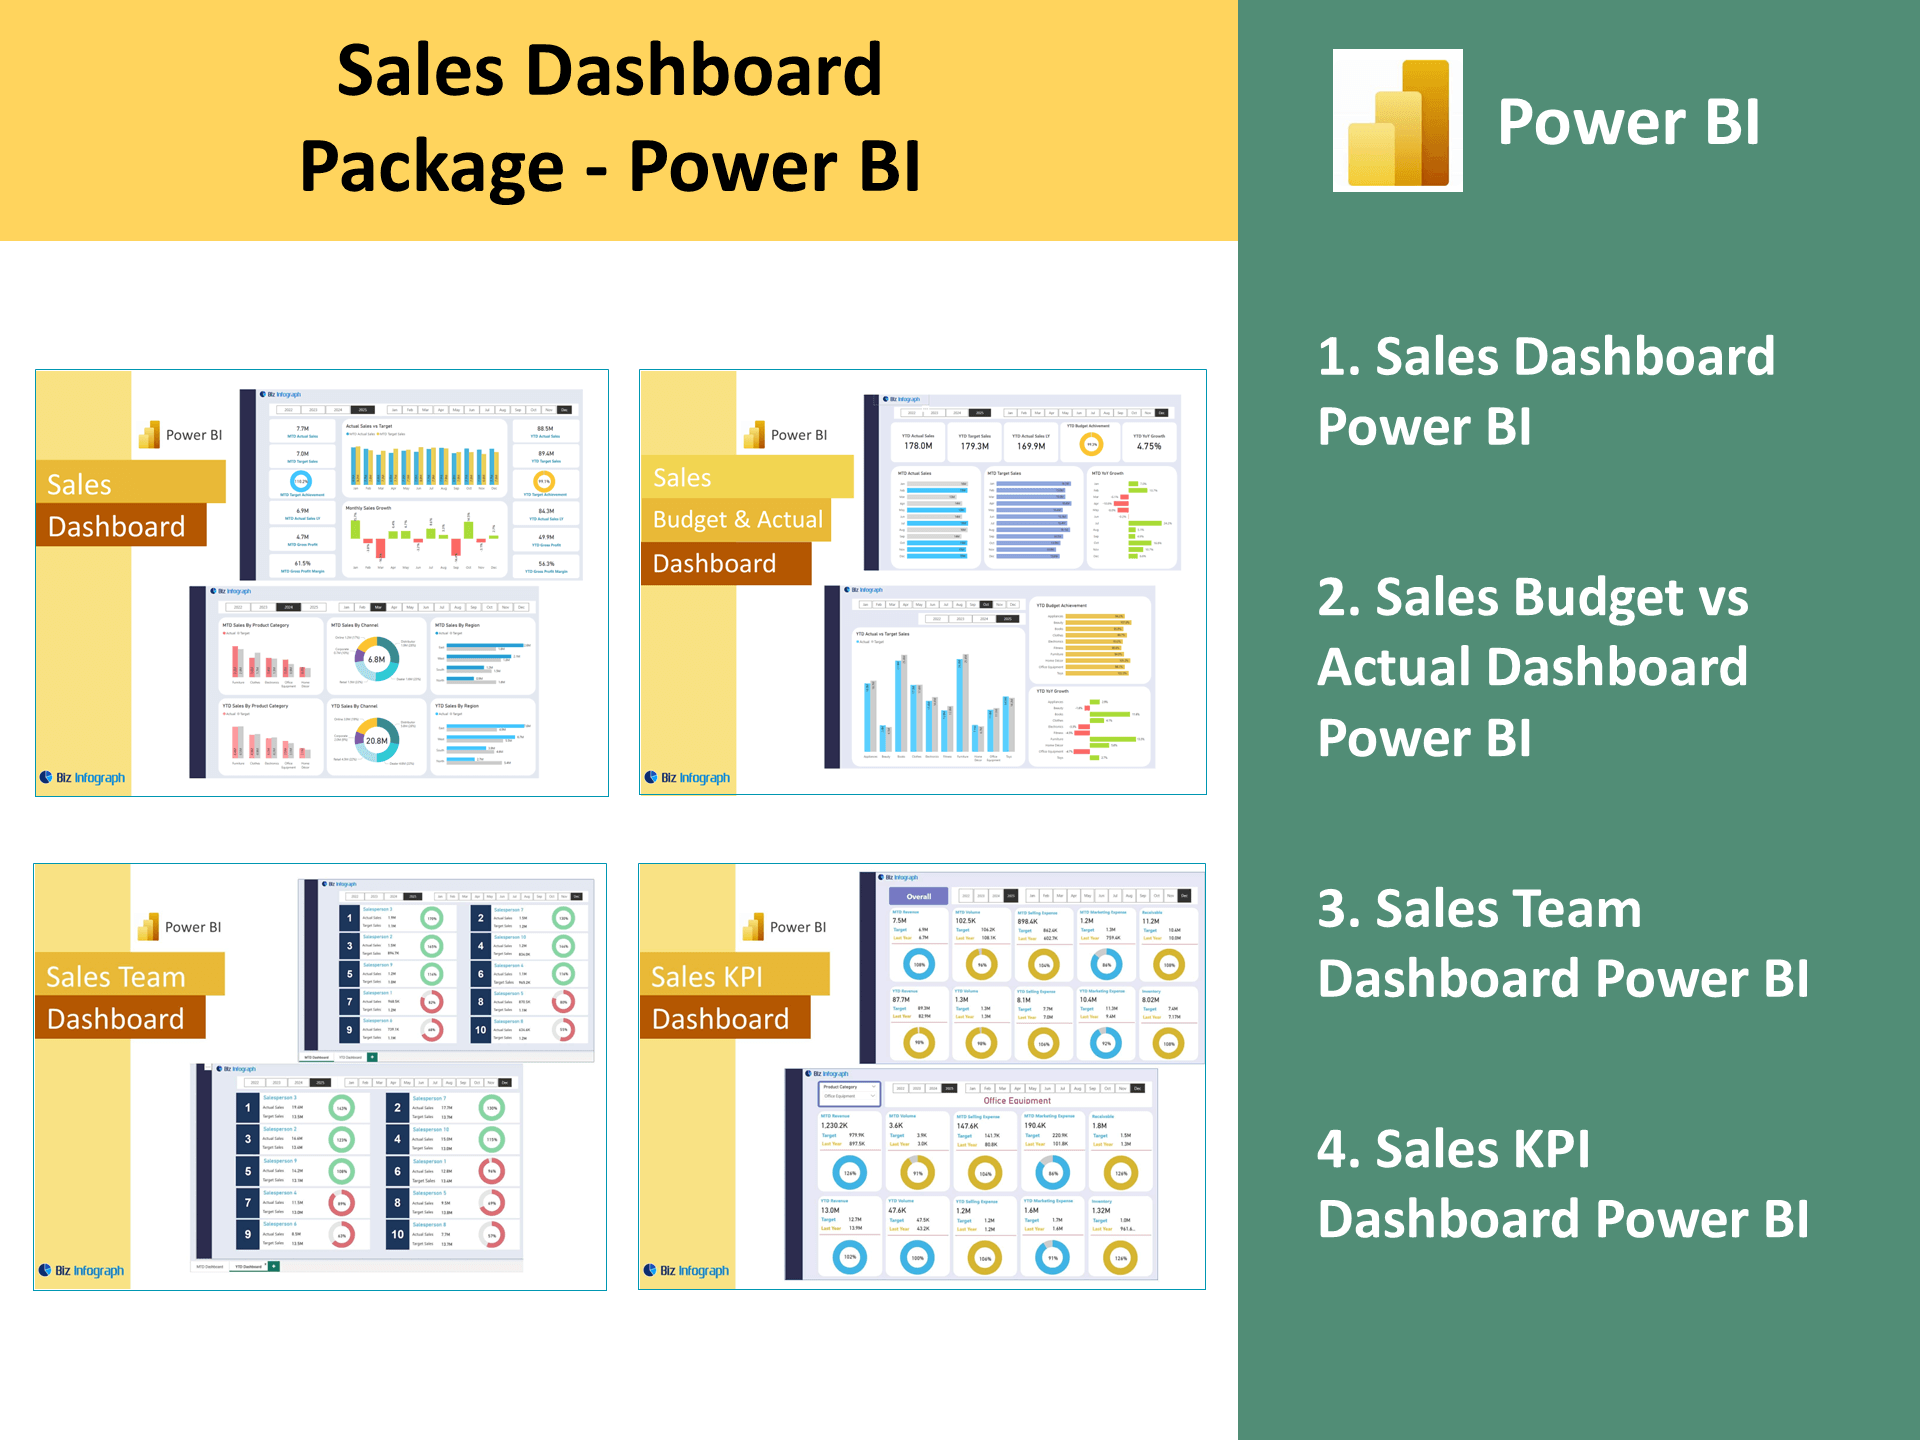
Sales Team Power BI Template
Introduction to Sales Team Dashboards in Power BI
What is a Sales Team Power BI Template?
A Sales Team Power BI Template is a pre-designed framework used to track, analyze, and visualize key sales performance metrics. Built in Power BI Desktop, this dashboard is designed to help sales organizations improve efficiency and alignment through better data visualization. A good template is designed to provide easy access to sales data across regions, products, and time periods, enabling teams to make faster, smarter decisions. Many organizations leverage free Power BI templates or sales dashboard templates to accelerate development without sacrificing customization. These templates help sales managers monitor key metrics like sales to date, pipeline status, and product sales performance.
Why Use Power BI for Sales Dashboard Reporting?
Microsoft Power BI is a leading data analysis and visualization platform that provides powerful tools for creating dynamic and insightful sales dashboards. Power BI offers real-time data connectivity, interactive charts, and automated updates, making it far more scalable than traditional spreadsheets. A dashboard in Power BI not only helps visualize KPIs but also reduces the need for manual data work. With its ability to connect your data from multiple sources, including CRMs, ERPs, and web analytics, Power BI makes reporting through Power BI seamless. This allows sales teams to track progress, identify bottlenecks, and adjust sales strategies accordingly.
Benefits of Power BI Templates for Sales Teams
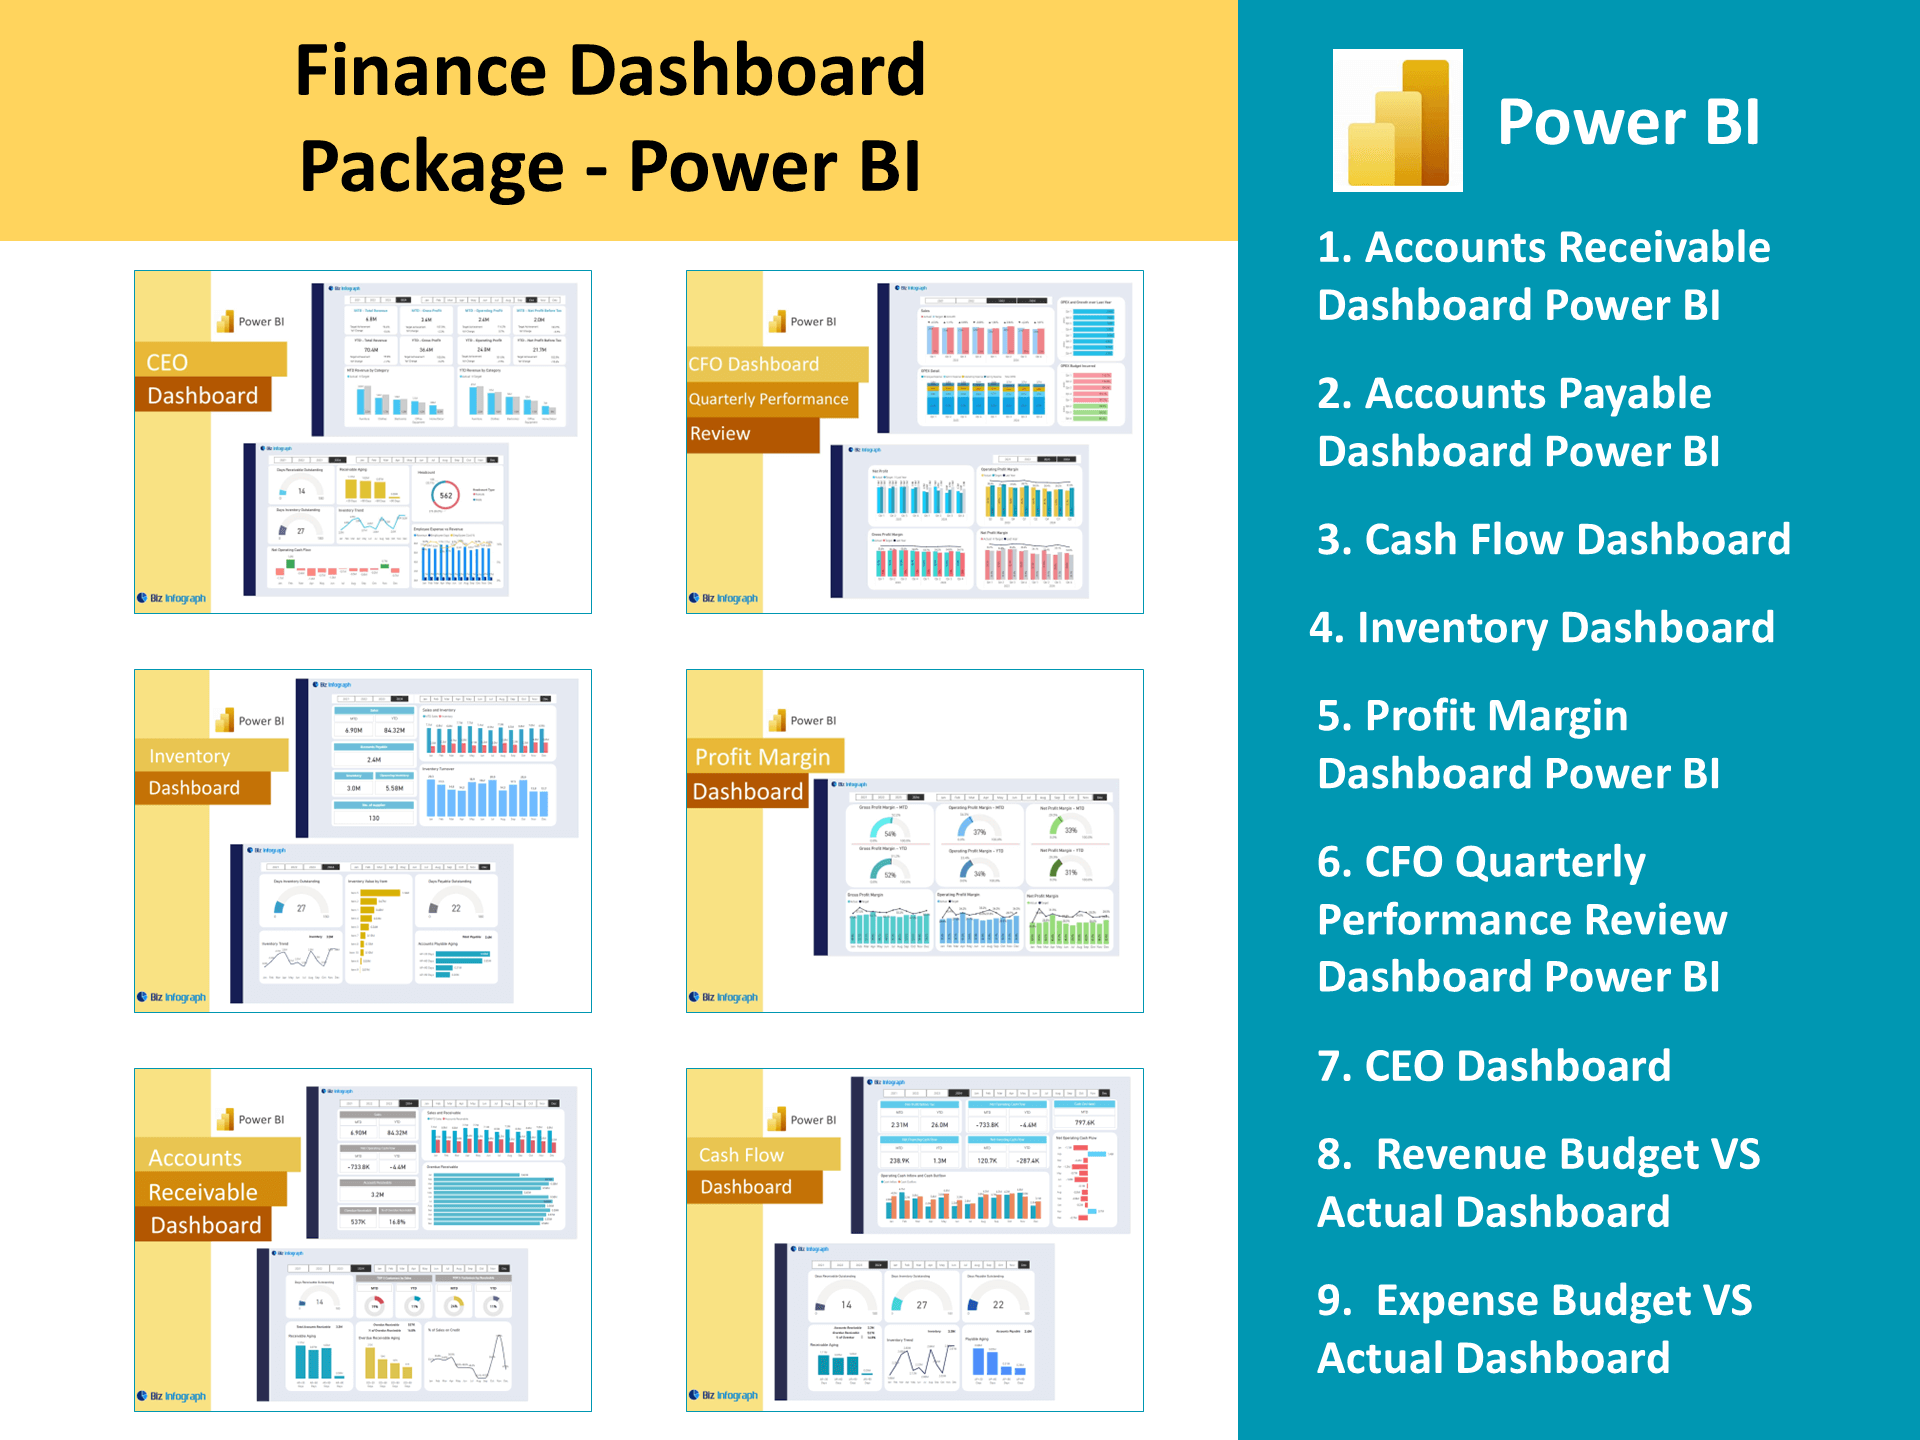
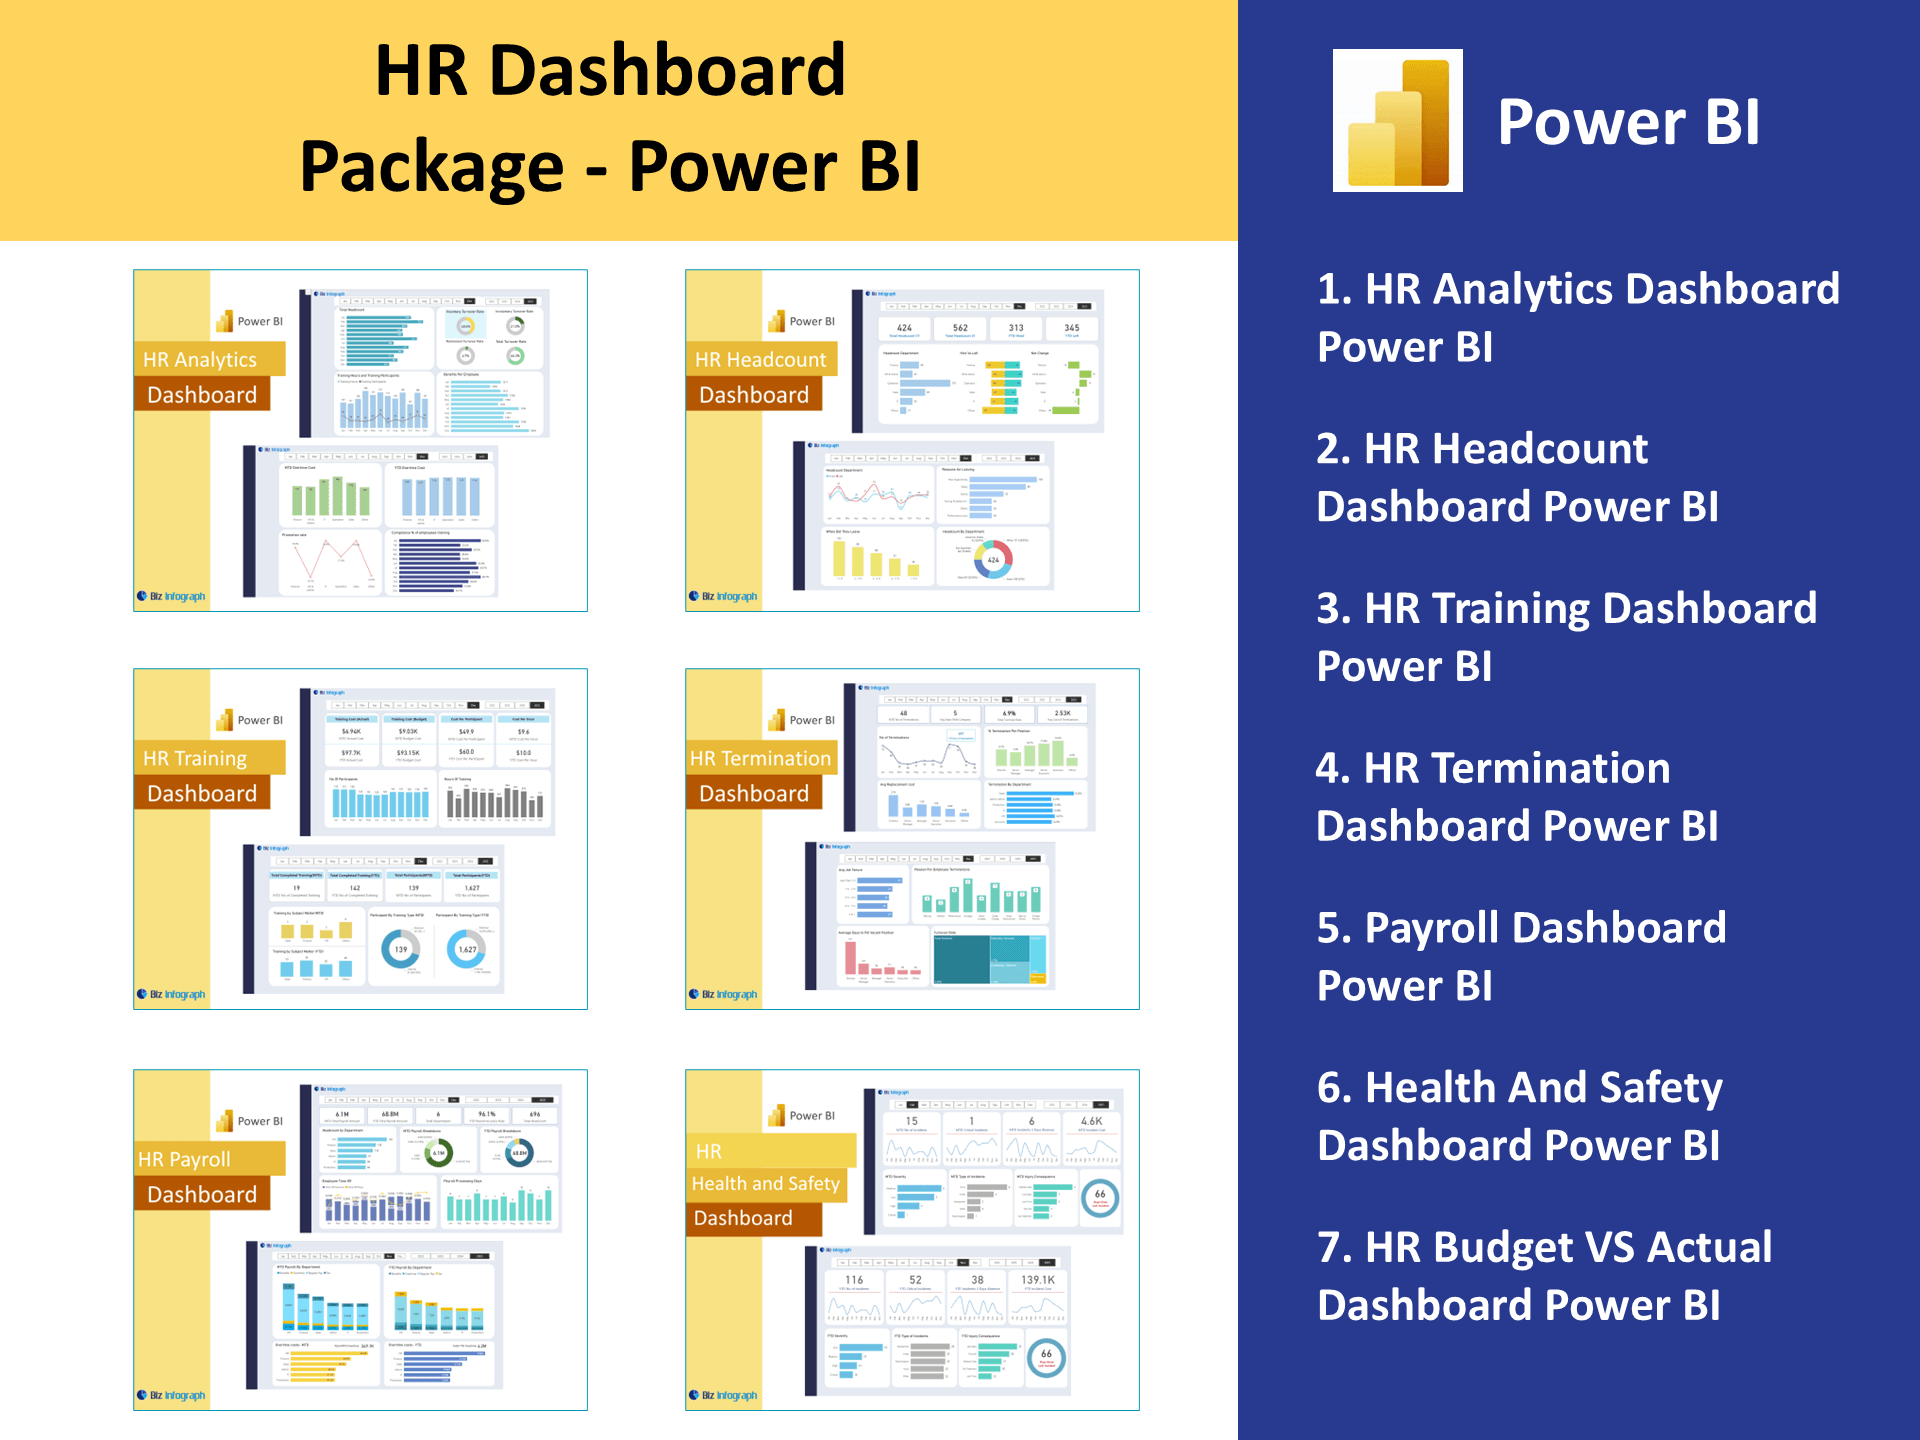
Using sales dashboard templates in Power BI provides several advantages for both beginners and experienced Power BI users. Templates come with predefined visuals, calculated fields, and layout arrangements, which streamline setup. These templates reduce development time and ensure consistent dashboard design across teams. Power BI provides templates for various functions such as sales analysis dashboards, spend analysis dashboards, analytics dashboard, and even customer analysis dashboards. Templates also allow for customizing the dashboard to reflect company branding or unique KPIs. Ultimately, they help sales teams focus more on performance improvement and less on technical setup.
Key Components of a Sales Dashboard Template
Essential Visuals and Metrics in a Sales Dashboard
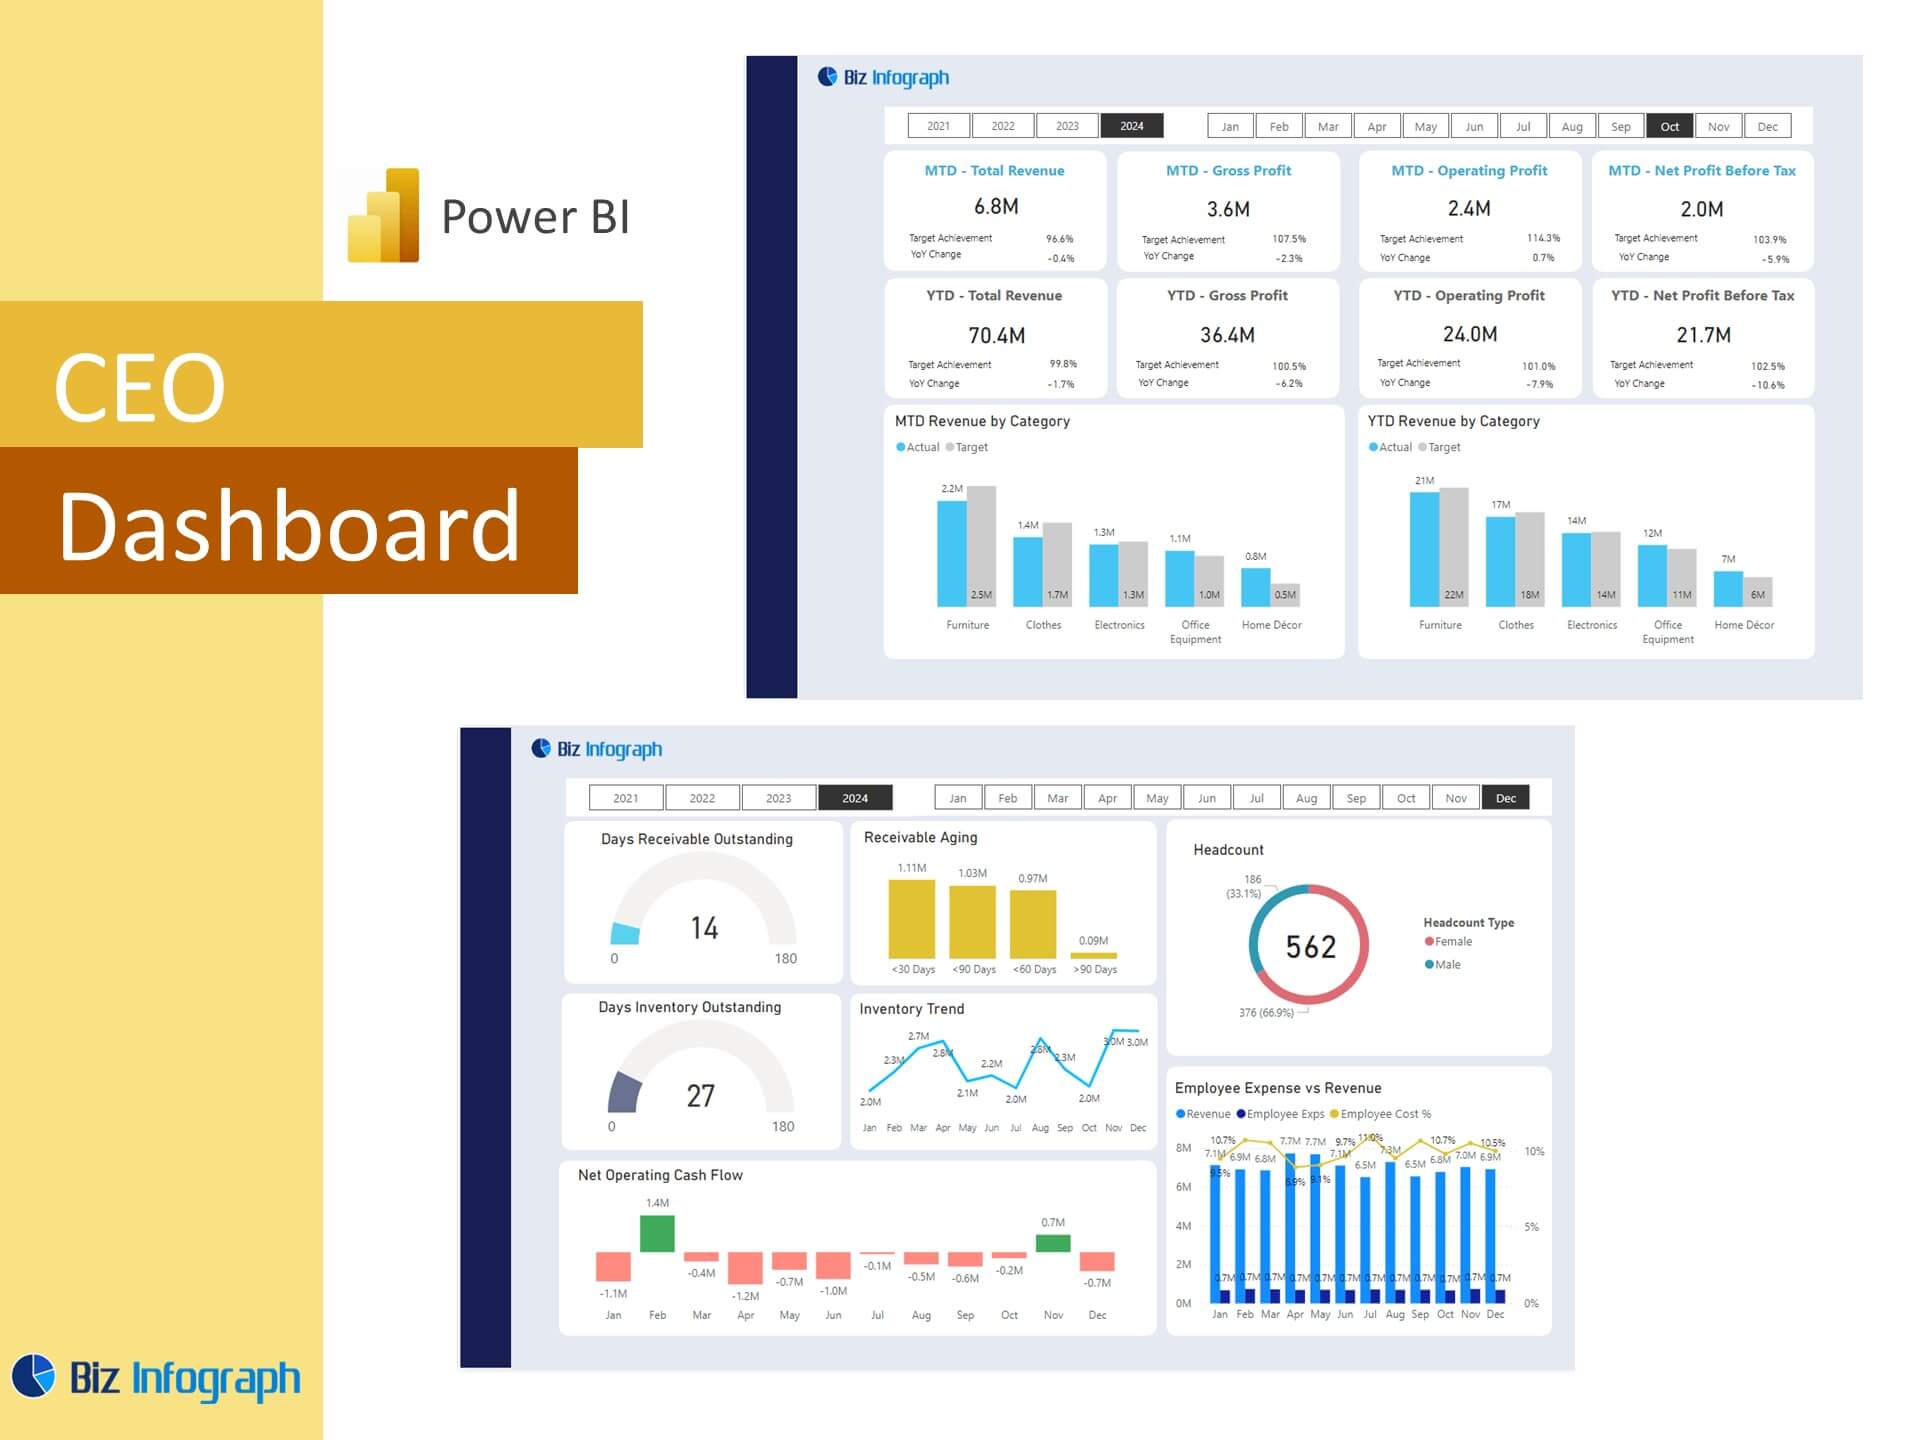
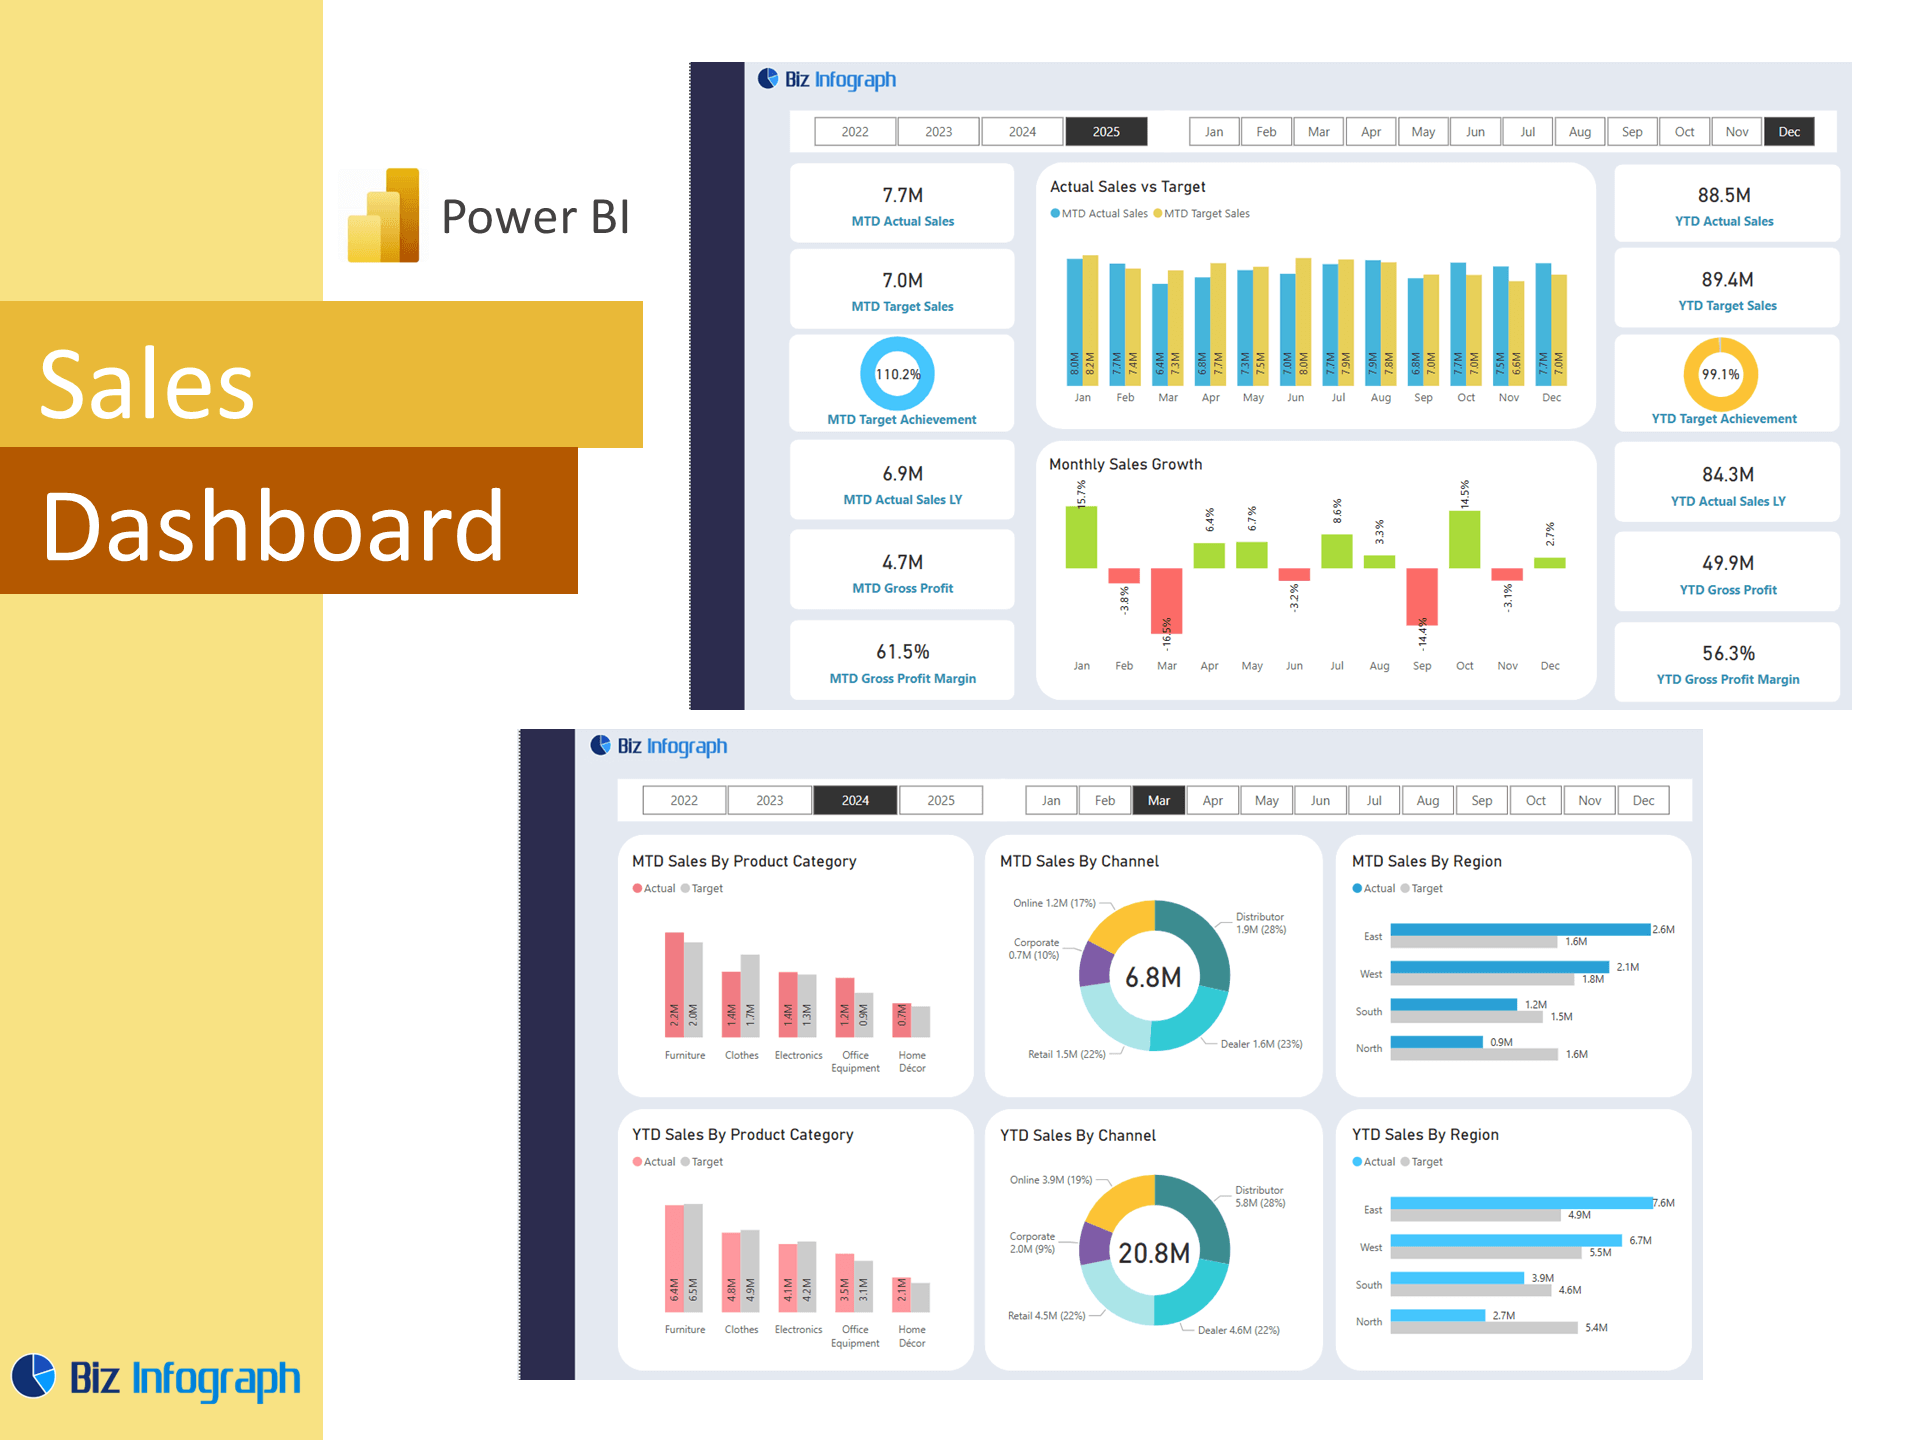
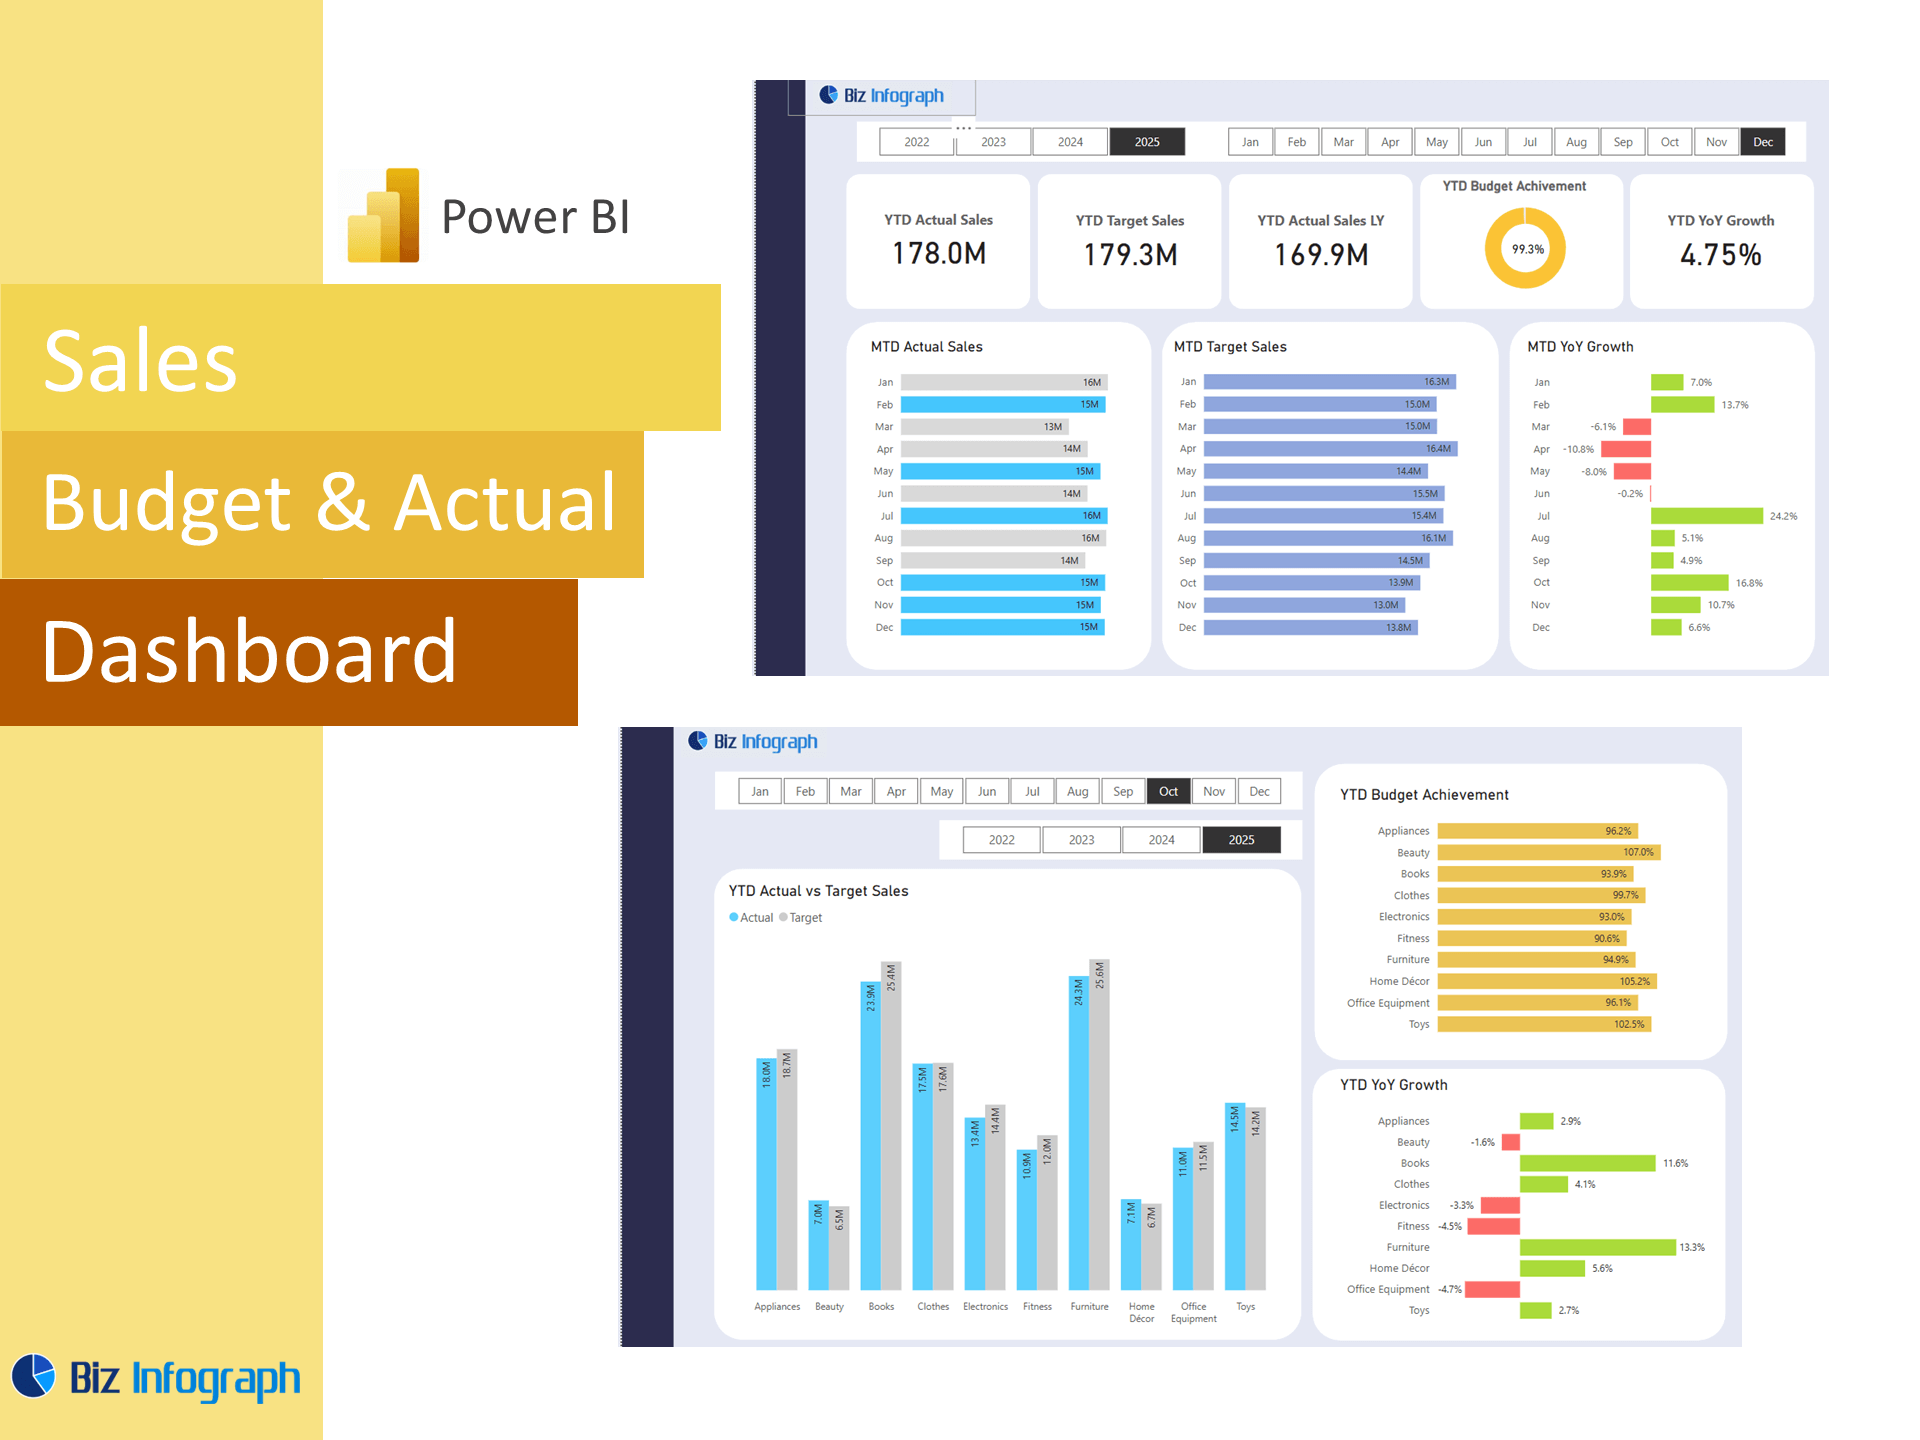
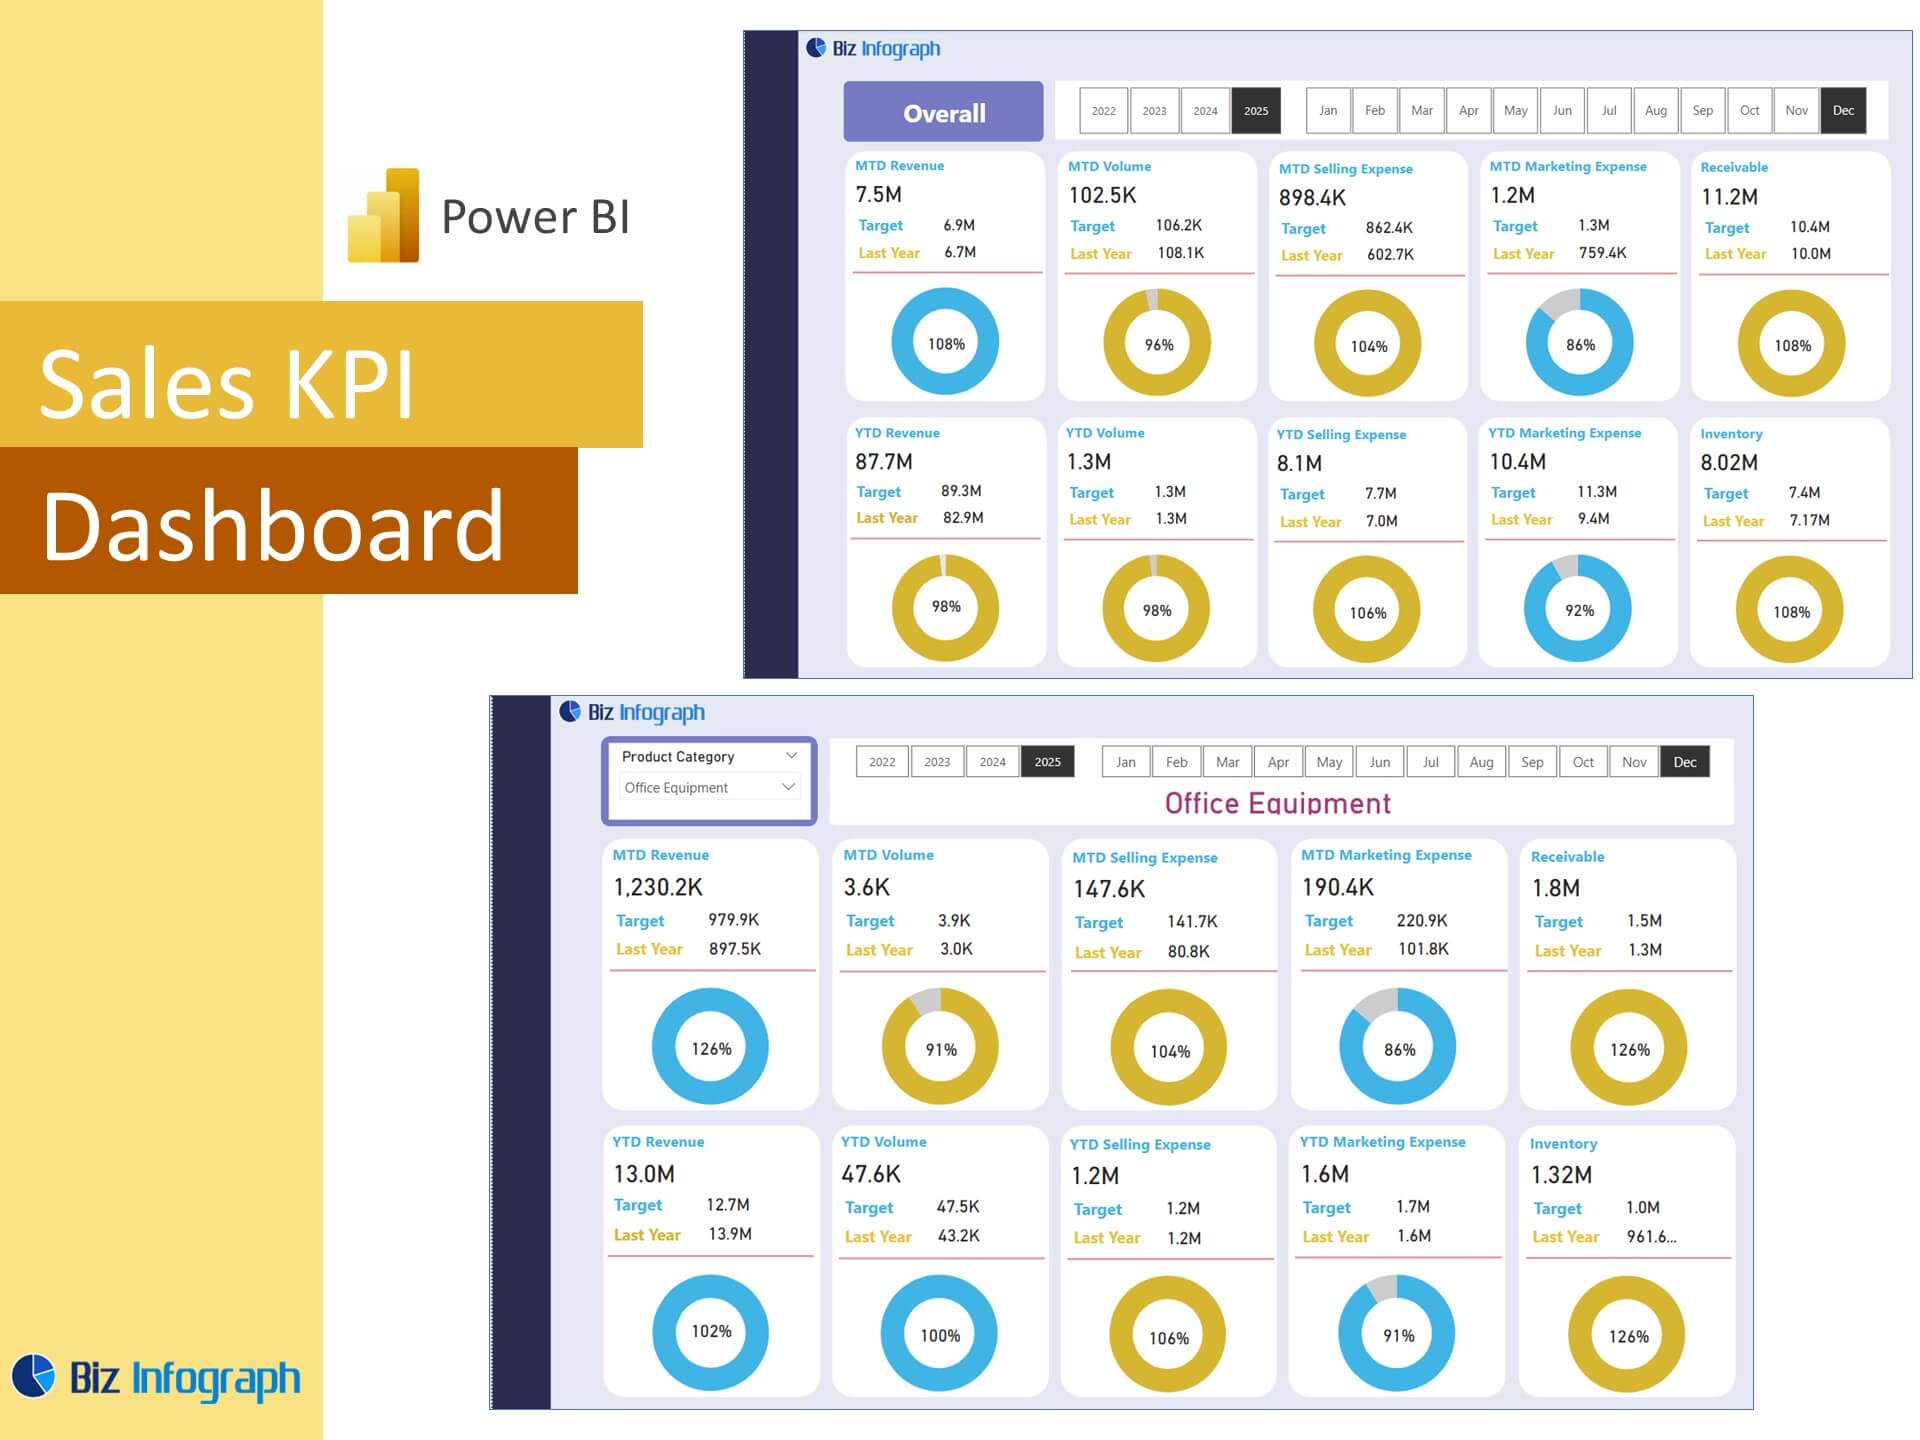
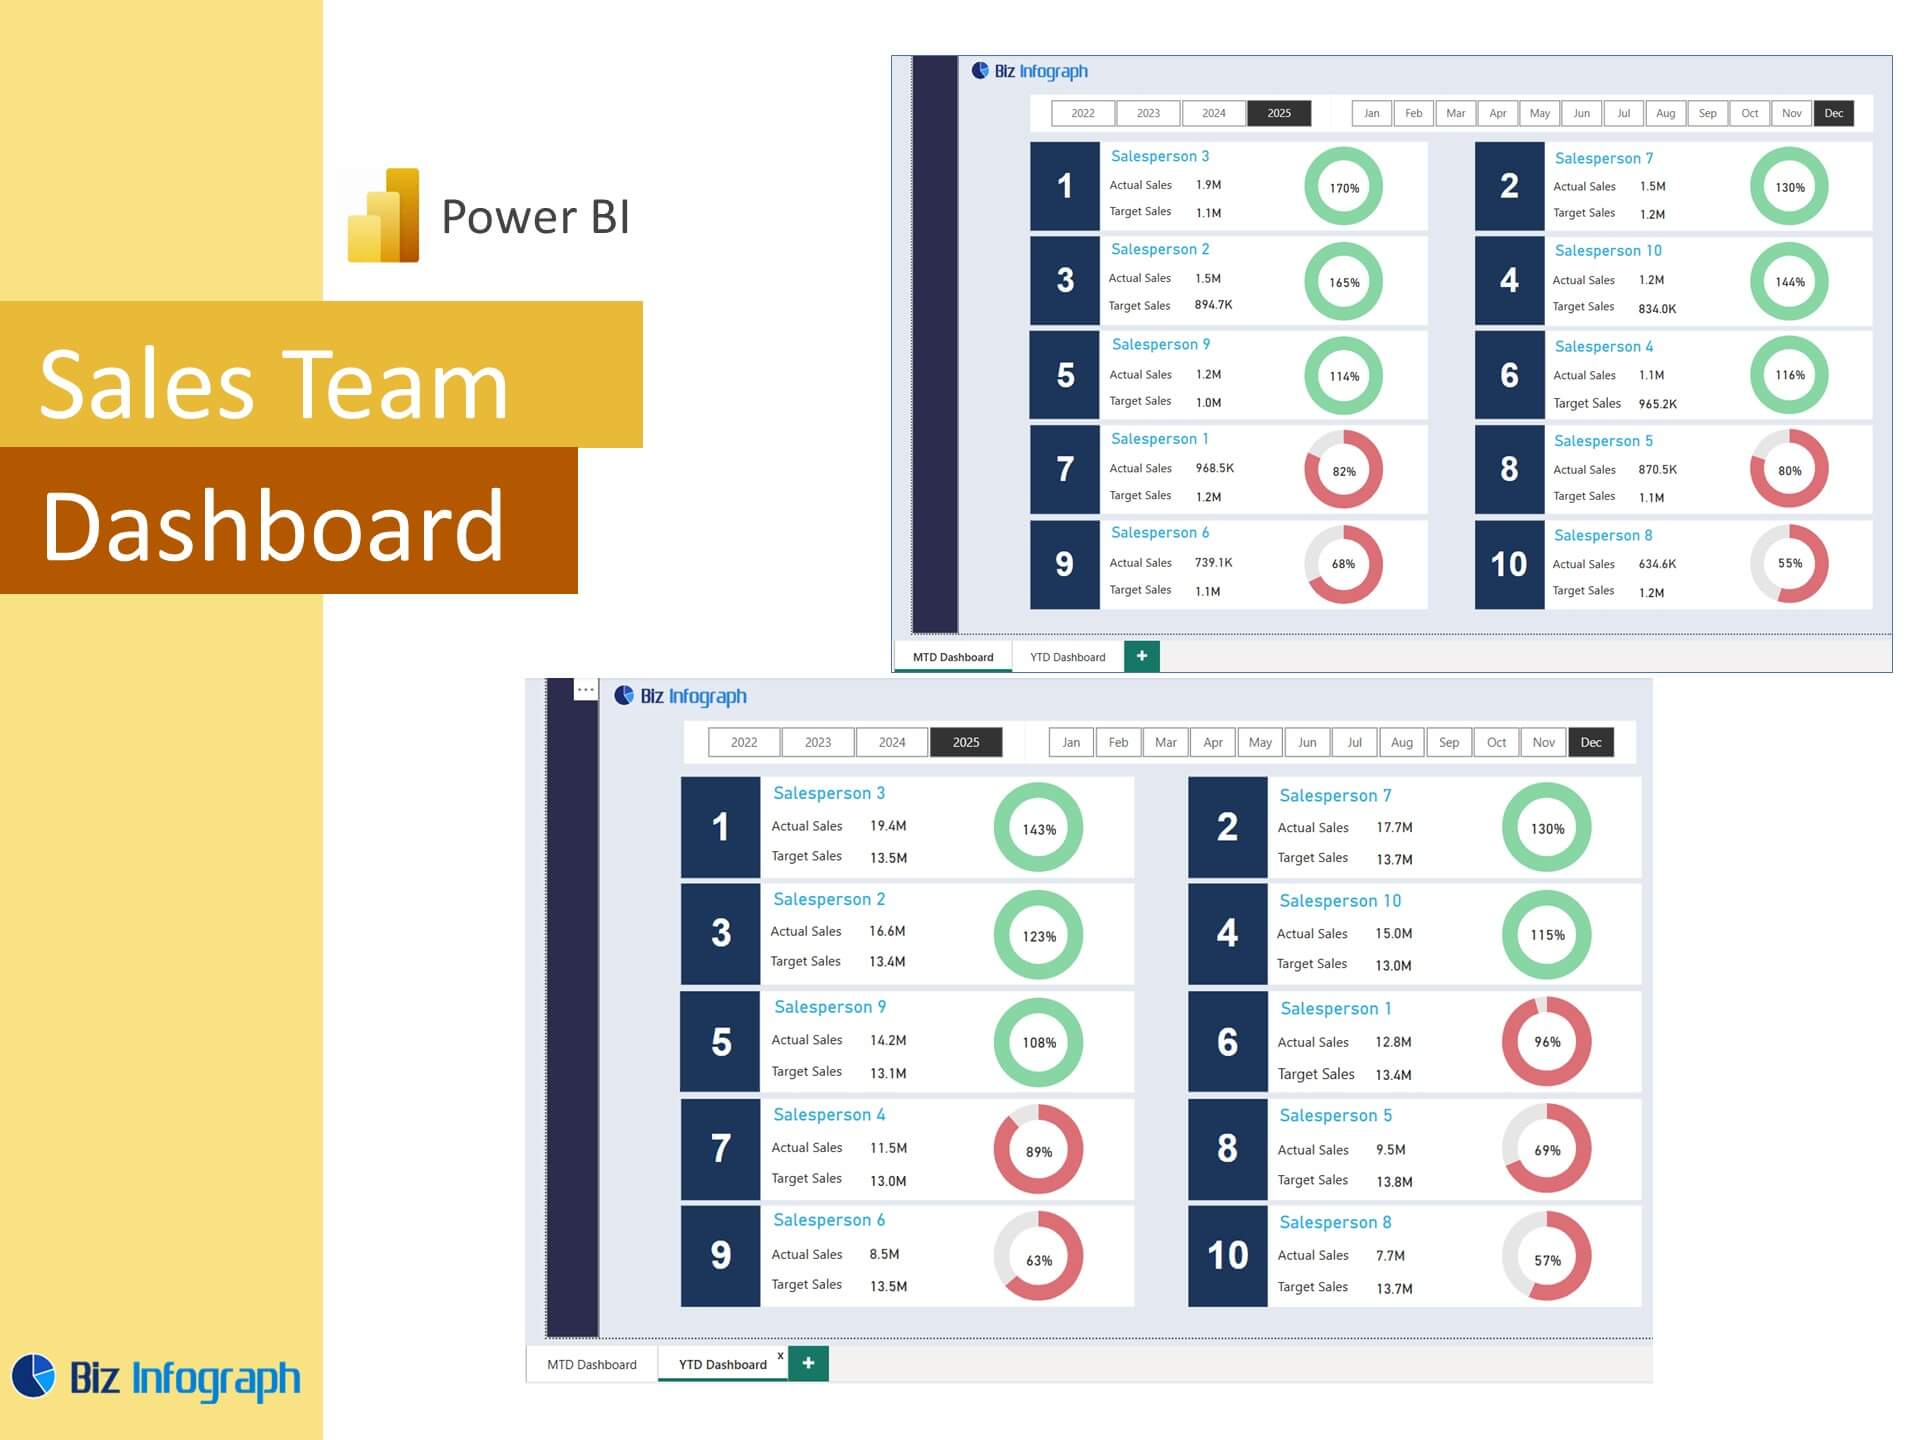
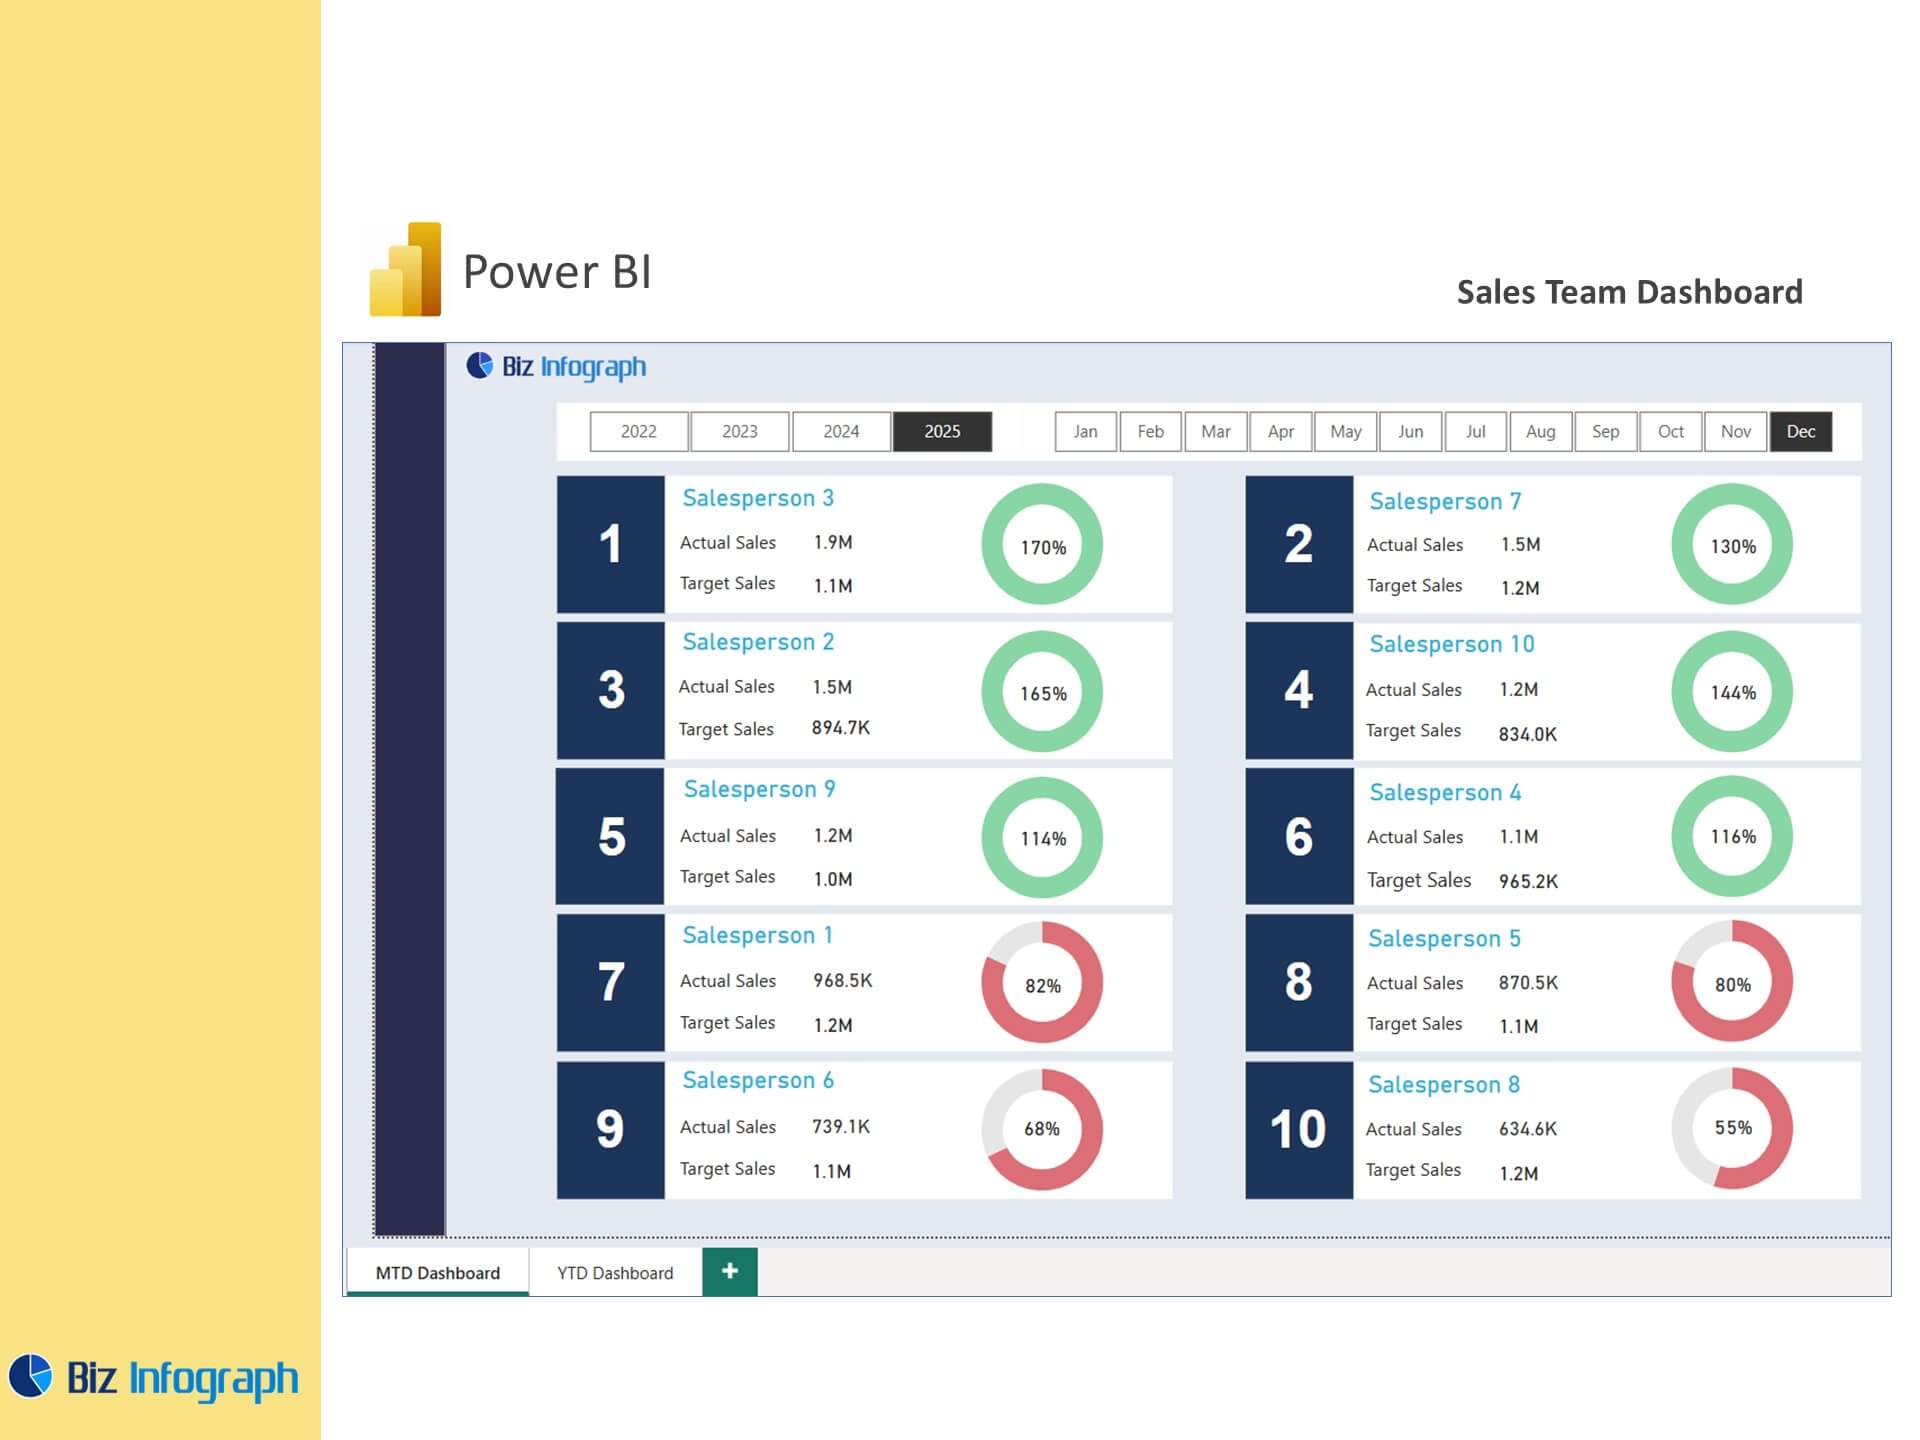
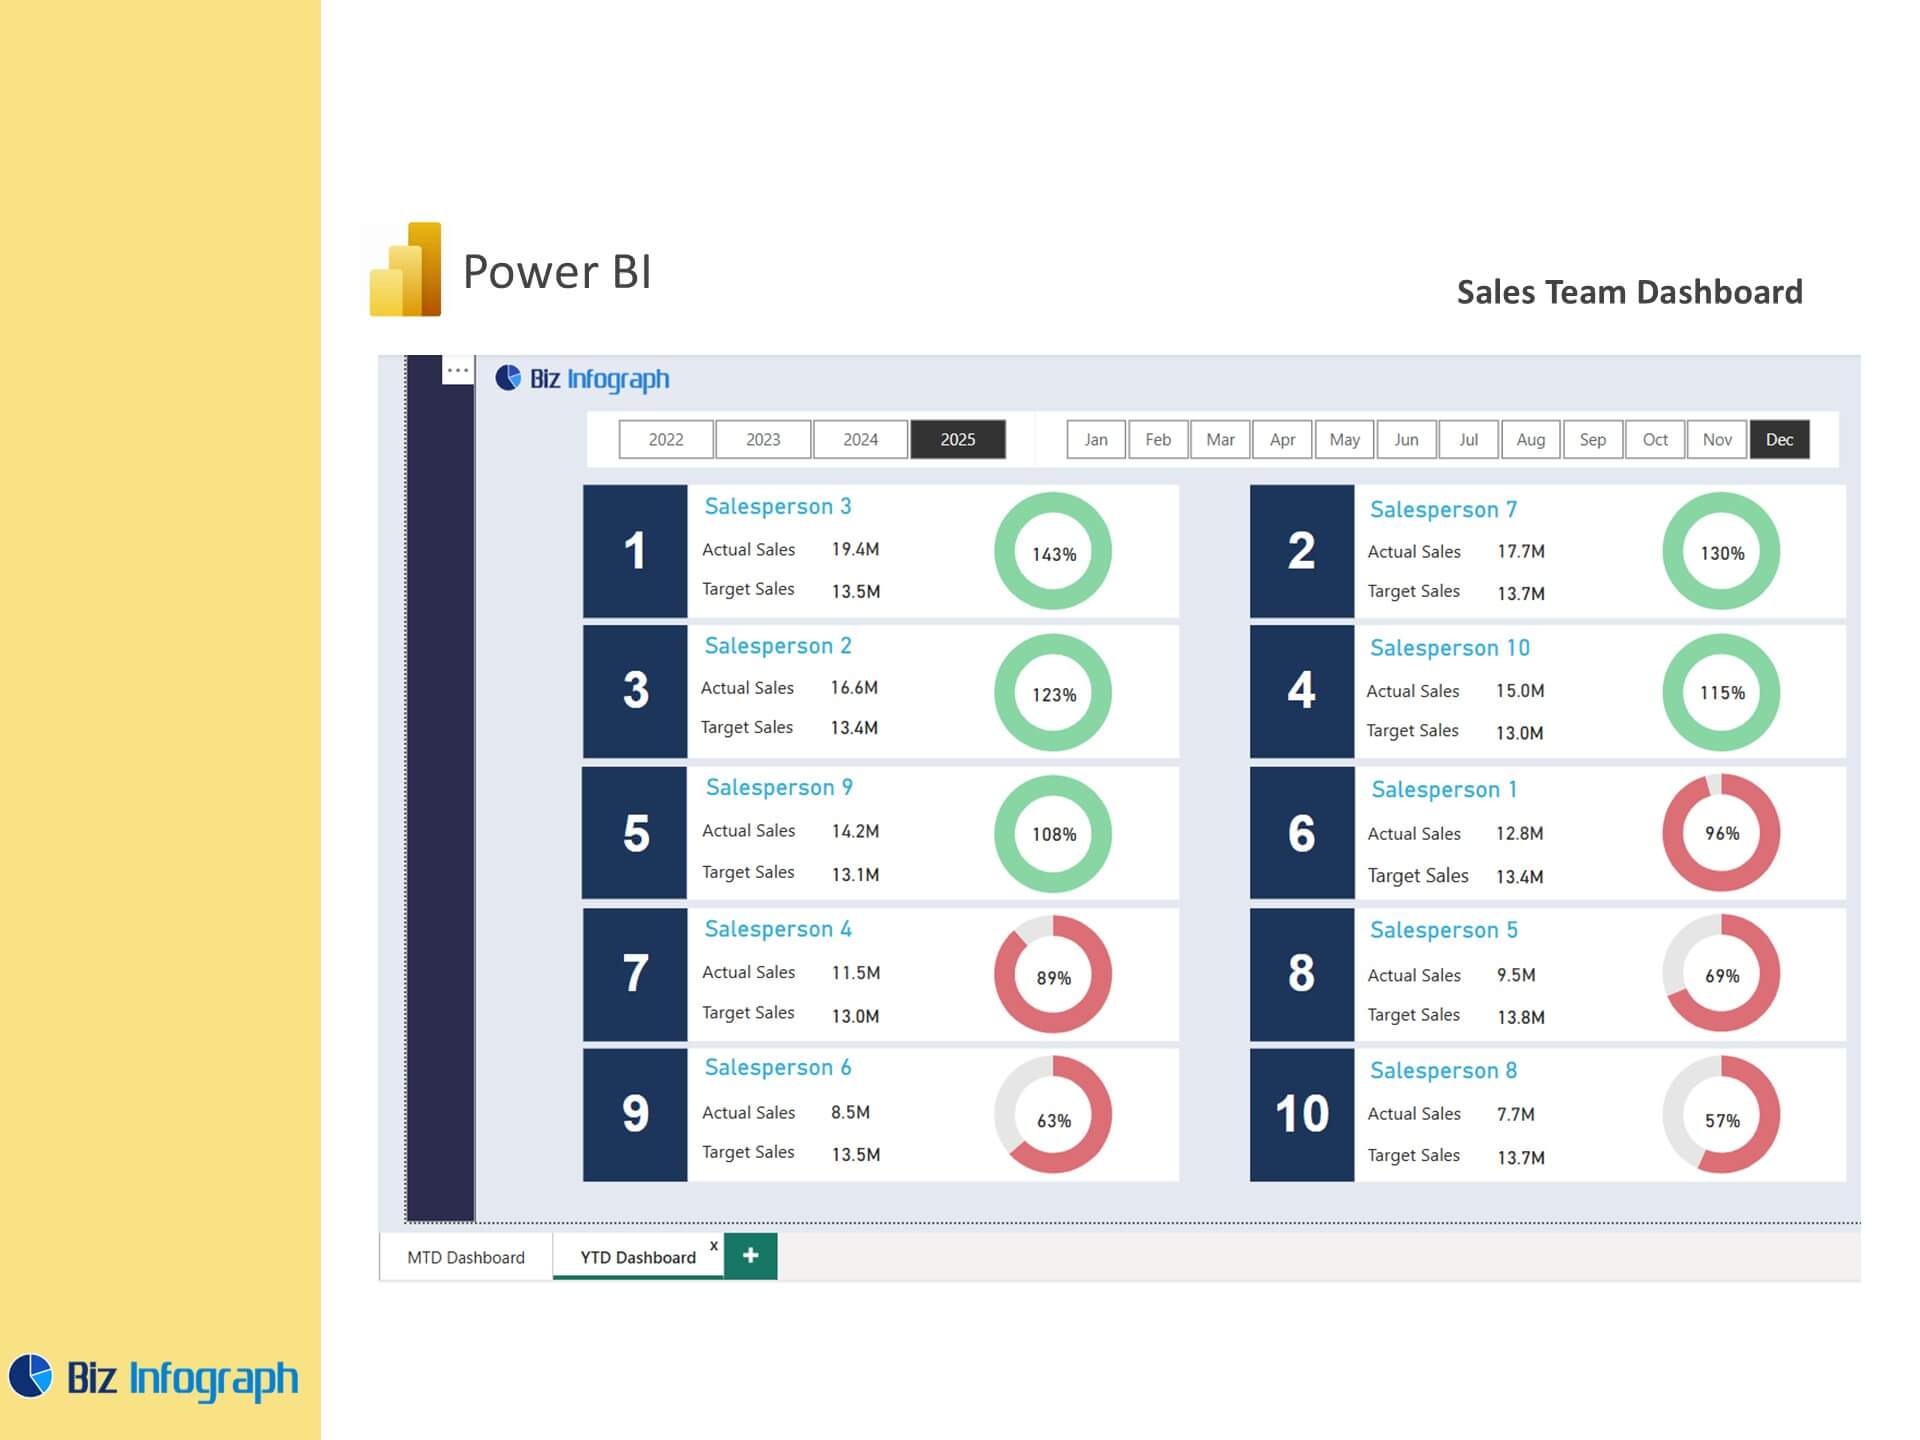
A solid Power BI sales dashboard should include visuals that cover pipeline stages, sales conversions, target attainment, and sales team performance. Charts showing sales to date, revenue by product, and performance by region help deliver a complete overview of sales. Interactive dashboards allow users to filter by specific data such as quarter, region, or salesperson. KPI cards, line graphs, and bar charts are commonly used to show trends and comparisons. The dashboard highlights key performance metrics that matter most to sales managers, providing quick, actionable insights.
How Templates Improve Sales Team Performance
A well-structured template enhances performance by centralizing and simplifying access to real-time sales data. These dashboards enable better sales activities planning, coaching, and accountability. With dashboard allows users to drill down into territory performance or product sales, sales managers can focus on opportunities that drive growth. For reps, having a clear view of pipeline status helps align daily actions with broader team goals. Templates built in Power BI Desktop often include benchmarking features and trend tracking that support more accurate forecasting. The result is improved visibility and stronger execution.
Interactive Features in Power BI Dashboard Templates
Interactive Power BI dashboards are designed to enhance user engagement. Features like slicers, filters, bookmarks, and drill-throughs allow for flexible navigation and in-depth data analysis. These features help users spot trends, identify outliers, and understand sales team performance at a granular level. Integration with AI capabilities in Power BI reports today can even surface insights proactively. These templates are part of the reason why Power BI remains one of the best Power BI dashboard examples platforms for interactive, self-service analytics.
Designing and Customizing a Power BI Sales Template
How to Create a Power BI Dashboard for Sales
To create a Power BI dashboard, start by identifying your KPIs and pull data from your CRM, Excel sheets, or databases. Use the Power Query Editor for ETL processes, then model relationships between tables. Add visuals like KPI cards, funnel charts, and bar graphs to represent sales pipeline and revenue. This structure ensures the dashboard is to help sales teams operate with clarity. Publishing to Power BI Service allows for sharing and collaboration across departments.
Best Practices for Customizing Power BI Dashboard Templates
When customizing the dashboard, it’s essential to tailor visualizations to your organization’s structure. Use color schemes to highlight performance levels, and ensure mobile responsiveness for on-the-go access. Consider integrating a google ads dashboard, facebook ads dashboard, or social media dashboard for marketing attribution. Use hierarchy filters for executive and rep-level views. These best practices help ensure that your dashboard provides clear, actionable insights tailored to your users.
Examples of Power BI Dashboards for Sales and Beyond
Popular examples of Power BI dashboards include global sales overviews, power bi finance dashboards, and customer analysis dashboards. One of the great Power BI dashboard examples includes a hybrid dashboard that links ads dashboard templates with revenue outcomes. These examples show how different departments can use Power BI for strategic alignment and visibility. With the release of new templates in 2025, companies now have even more robust options to deploy quickly.
Power BI Templates for Cross-Departmental Use
Using Power BI for Finance and HR Dashboards
Power BI isn’t just for sales—it’s widely used for power bi finance dashboards and HR dashboards. Finance templates track expenses, revenues, and cash flow forecasts, while HR dashboards monitor hiring, retention, and headcount. Templates help these departments reduce dependency on static reports and improve real-time decision-making.
Marketing Insights with Social Media and Ads Dashboards
Google Ads Dashboards, Facebook Ads Dashboards, and Social Media Dashboards help marketing teams evaluate campaign ROI and lead quality. Integrating these with sales templates gives a full-funnel view that aligns marketing and sales teams. Templates offer a centralized hub where sales managers can correlate campaign spend with closed deals.
Leveraging Customer Analysis Dashboards in Sales Strategy
A Customer Analysis Dashboard helps identify high-value segments, churn risk, and behavior patterns. These insights directly inform sales strategies by identifying upsell opportunities and optimizing lead follow-up processes. Using customer-centric dashboards as part of your sales suite strengthens targeting and boosts close rates.
Managing Data and Reporting with Power BI
Connecting and Preparing Data in Power BI
Successful dashboards depend on reliable data. Use data source to Power BI workflows to connect CRMs, ERPs, and APIs. Perform cleansing and shaping using Power Query, and build a model that supports key calculations. By organizing data using Power BI, teams ensure accuracy and scalability for long-term use.
Power BI Service for Sharing and Collaboration
Publishing reports to Power BI Service enables secure sharing across departments. Teams can comment on visuals, subscribe to updates, and embed reports into apps. Shared access promotes collaboration and ensures everyone is working from the same data.
Automating Reports and Reducing Manual Data Workflows
Power BI can automate scheduled refreshes and integrate with tools like Power Automate. This eliminates manual data handling and allows real-time tracking. Teams can shift their focus from pulling data to analyzing trends and responding quickly to market changes.