


Sales Dashboard Package Power BI
Introduction to Sales Dashboards Package in Power BI
What is a Sales Dashboard Package in Power BI?
A Sales Dashboard Package in Power BI is a dynamic tool used to monitor, evaluate, and improve sales teams’ performance across various dimensions such as sales pipeline, sales conversion, and product sales. Built using Power BI Desktop, this type of dashboard is designed to help sales managers and stakeholders transform raw data into meaningful insights. The dashboard provides an overview of critical indicators including sales by region, monthly sales, and average sales cycle length. With built-in integration and real-time updating via Power BI Service, this dashboard type is essential for businesses looking to centralize their sales data analysis.
Why Use Power BI for Sales Analysis?
Power BI offers an accessible and scalable platform for conducting advanced sales analysis. With Power BI templates and the Power Query Editor to transform messy inputs, teams can connect and visualize data from multiple sources—including CRMs, ERPs, and spreadsheets—without the need for manual data handling. Power BI allows real-time data syncs and multi-user access, making it ideal for sales and marketing collaboration. It also reduces reliance on static reporting by offering interactive, self-service analysis for sales representatives and leadership. Whether tracking future sales, campaign ROI, or overall sales performance, Power BI is the go-to data visualization tool for effective sales monitoring.
Benefits of Using Power BI Dashboards for Sales Management
Sales dashboards created in Power BI benefit sales management by consolidating KPIs into a single, intuitive interface. This helps managers compare performance across regions, reps, or product categories. These dashboards include trend analysis, real-time updates, and conditional formatting to highlight bottlenecks or success stories. By implementing dashboard creation best practices, such as layout clarity and data prioritization, dashboards become a vital part of strategy and operations. They also reduce the time needed to monitor sales, freeing up teams to focus on improve your sales tactics. With Power BI supports embedded analytics, insights can be shared across apps and departments seamlessly.
Key Components of a Sales Package Dashboard
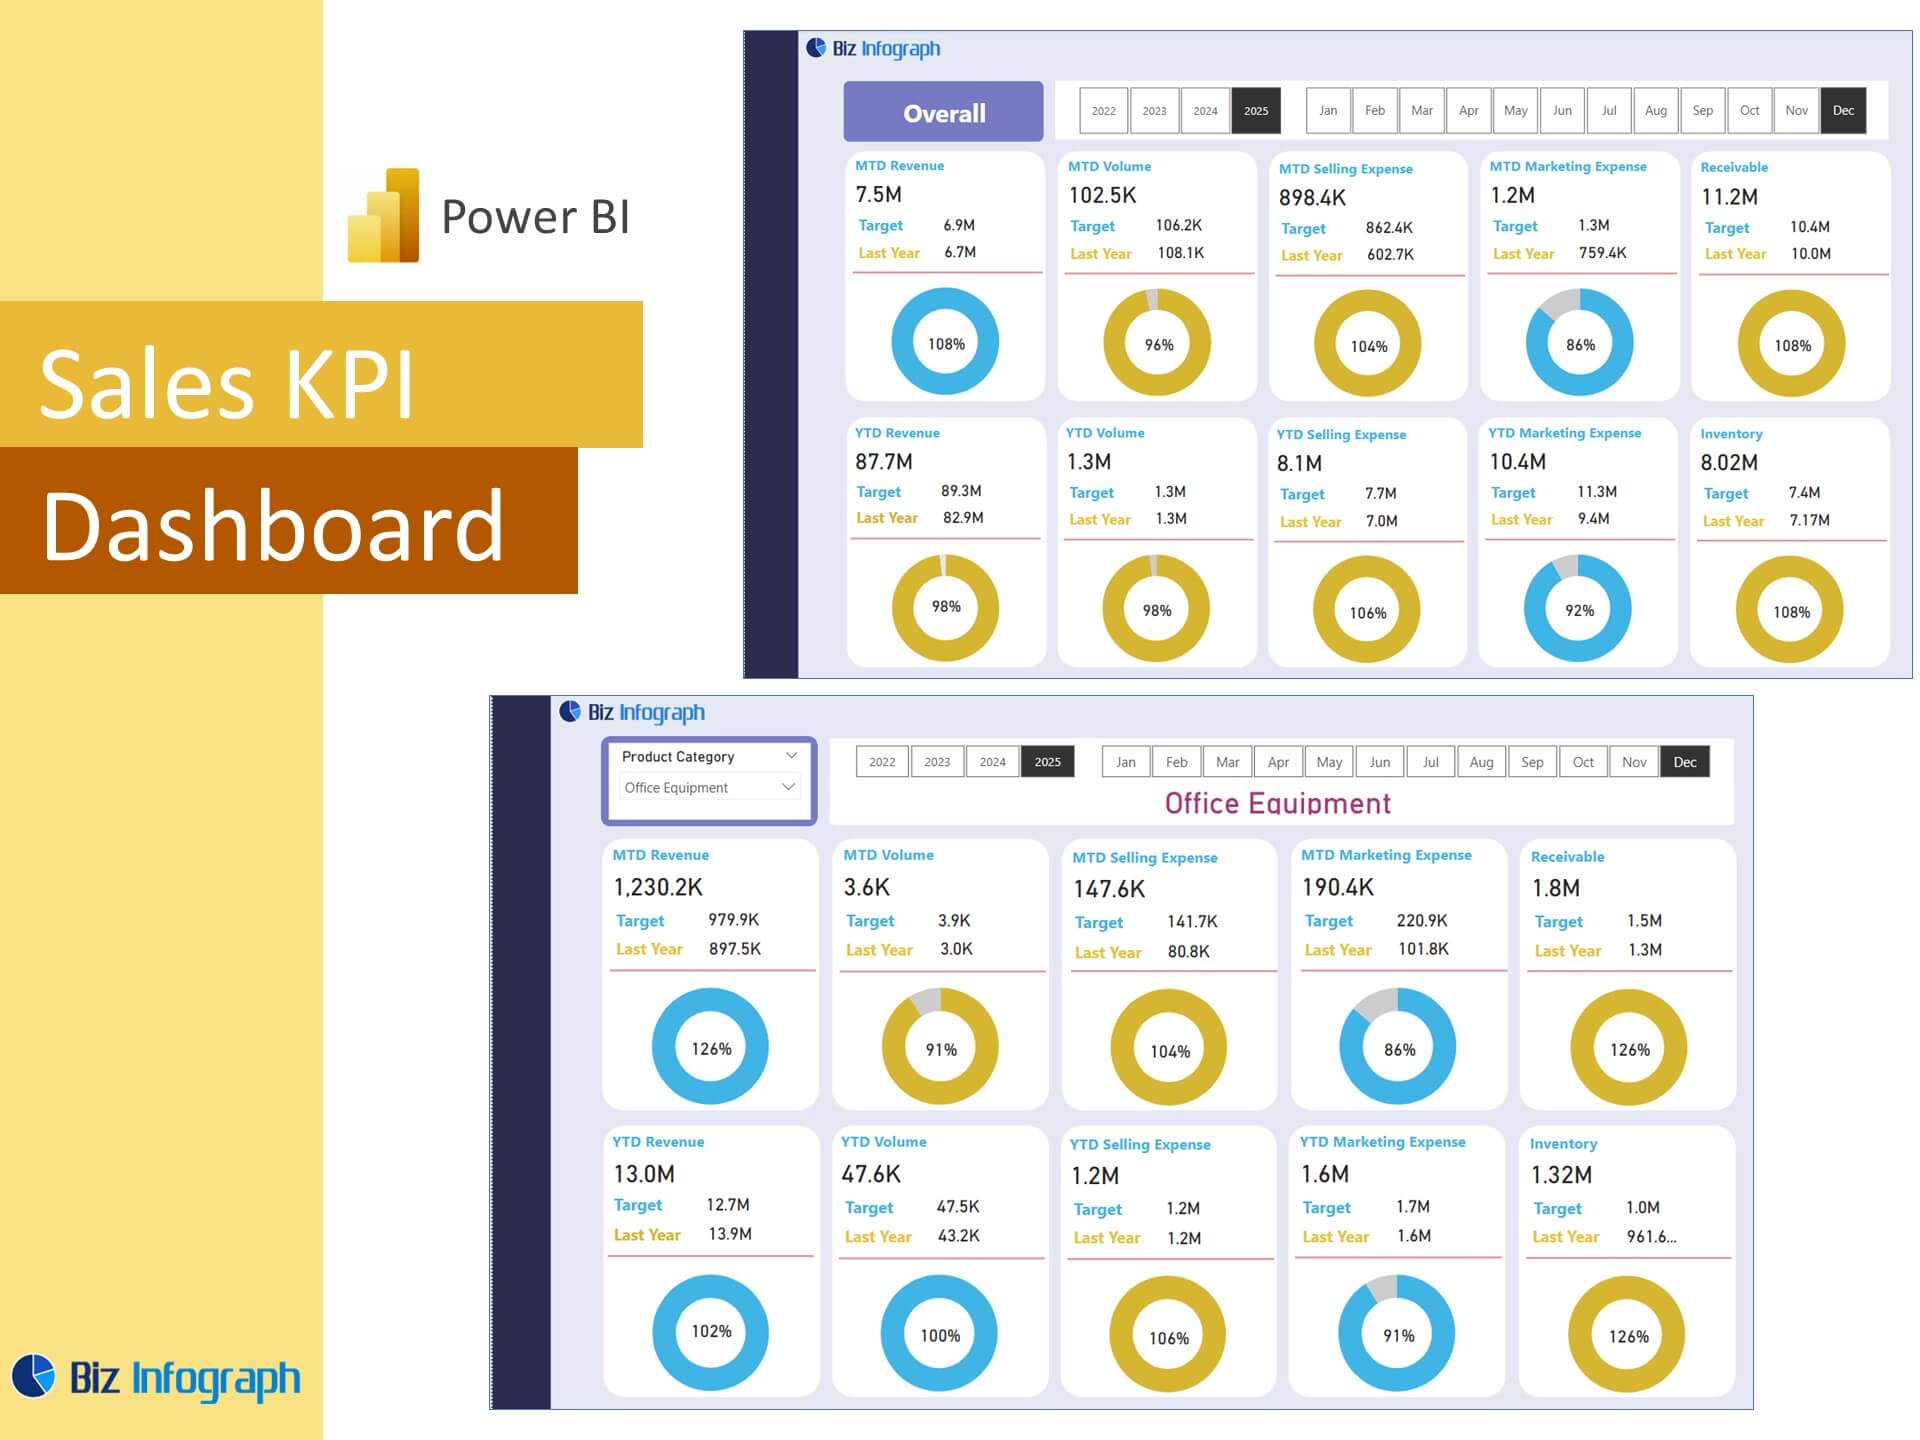
Essential Sales Metrics and KPIs to Track
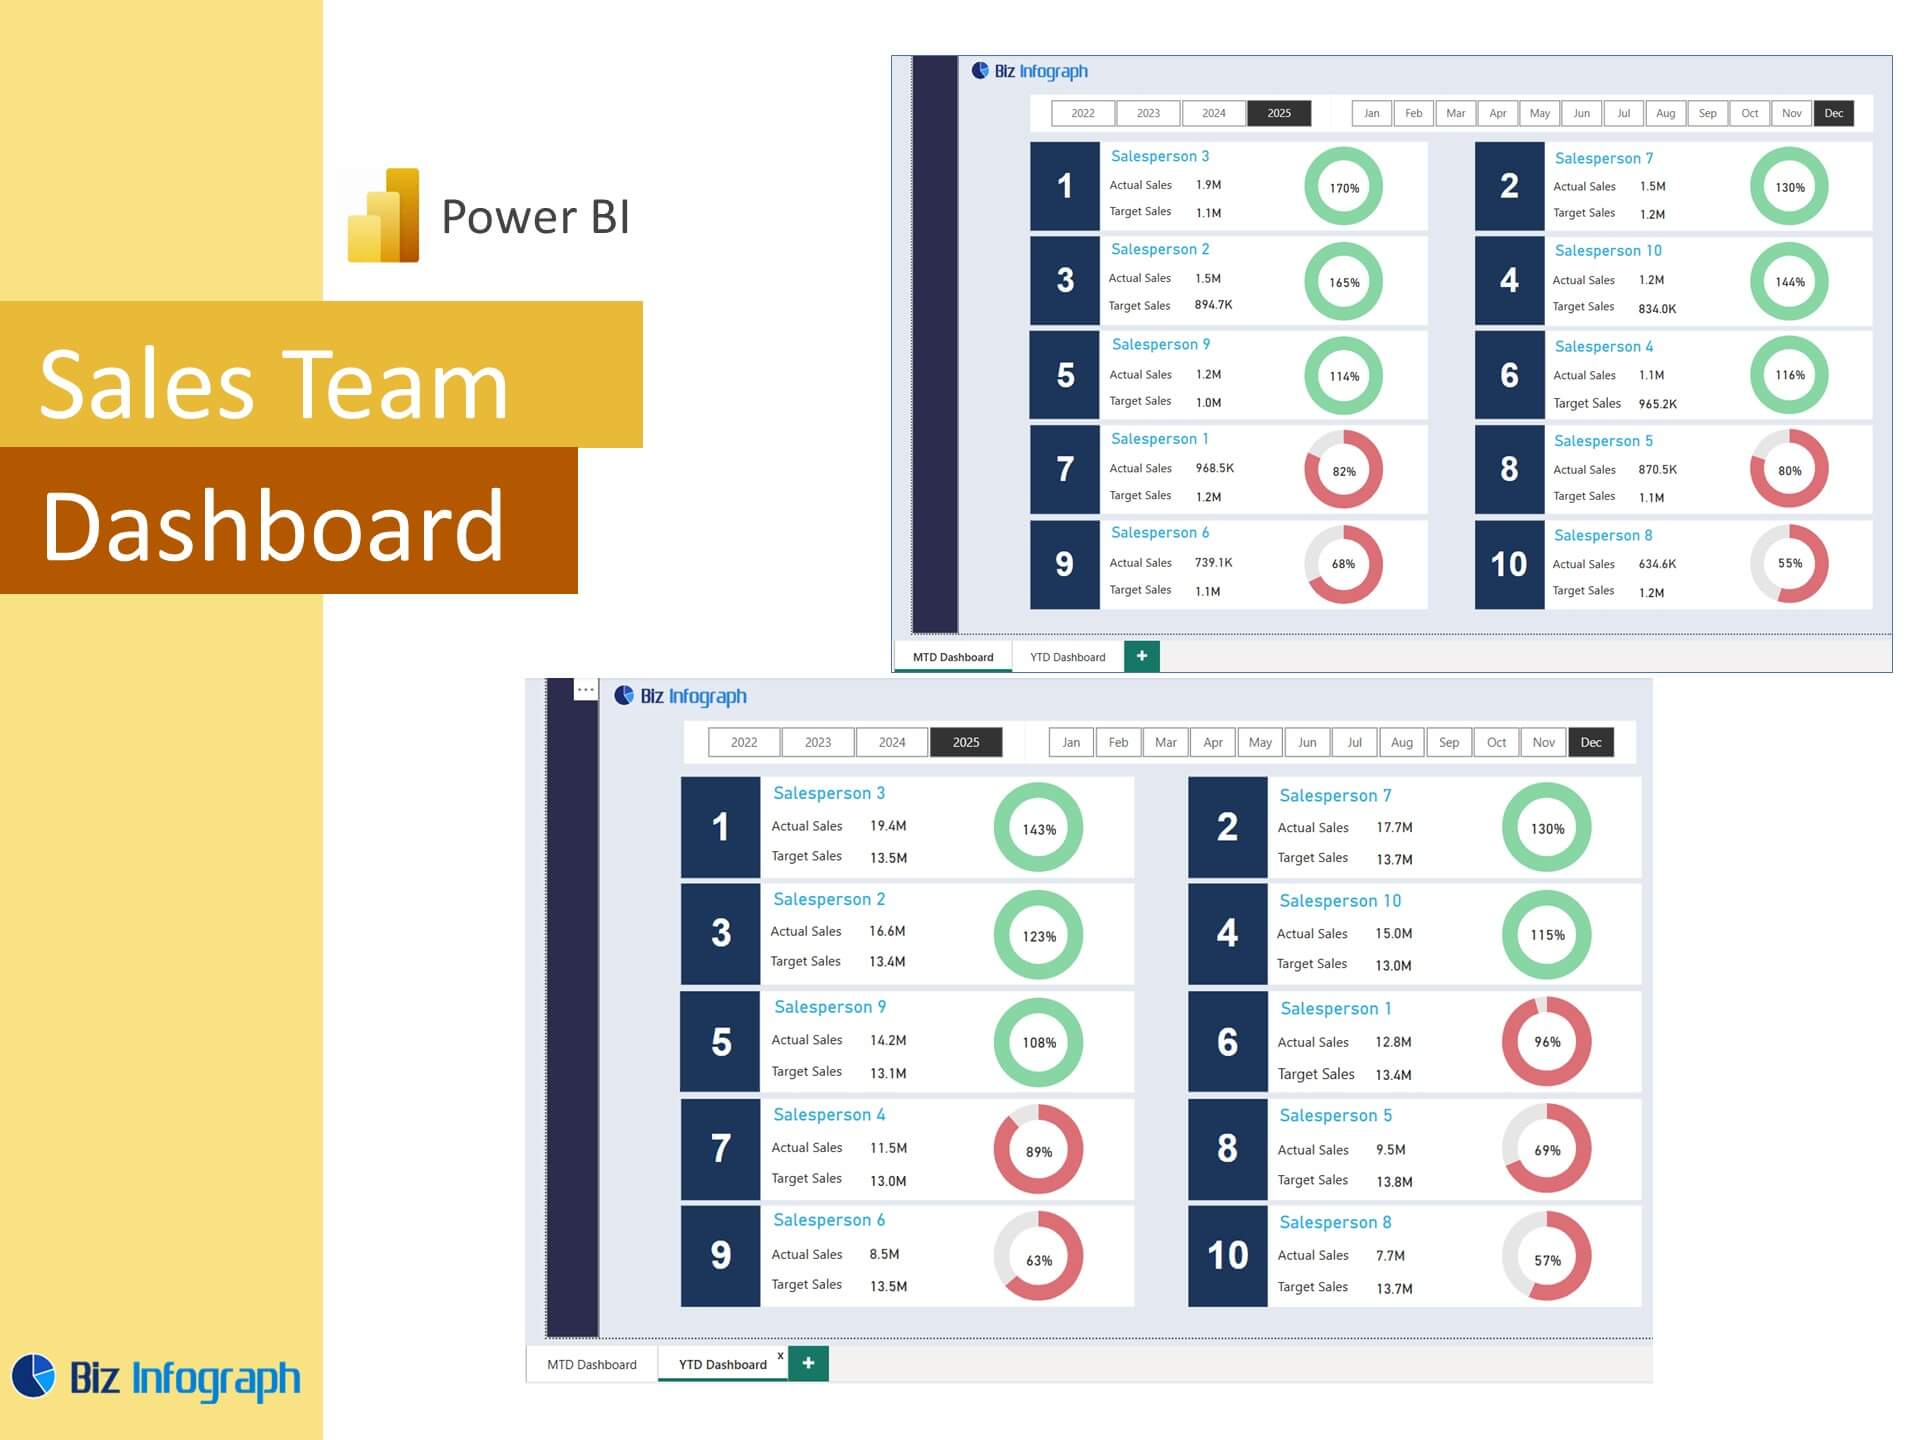
A high-functioning sales dashboard must include KPIs like sales figures, close rate, average deal size, sales funnel stages, and rep performance. These metrics help measure overall sales efficiency and guide resource allocation. Dashboard contains elements like KPI cards, comparison visuals, and timeline charts to track progression. Using Power Pivot and Power Query, users can perform advanced calculations and aggregations to fuel decision-making. Tracking sales trends like YoY growth or lead conversion by source gives a deeper look into what’s driving or hindering results.
Visualizing Sales Performance and Conversion Rates
An effective dashboard helps businesses visualize data related to their sales process—from lead to close. By incorporating sales analytics visuals like funnel diagrams, scatter plots, and slicers, teams can better understand sales conversion rates and identify which stages need attention. A dashboard created with data visualization best practices will not only display real-time numbers but also contextualize them with trends, color cues, and thresholds. This empowers users to make faster, smarter decisions and create a dashboard that drives revenue.
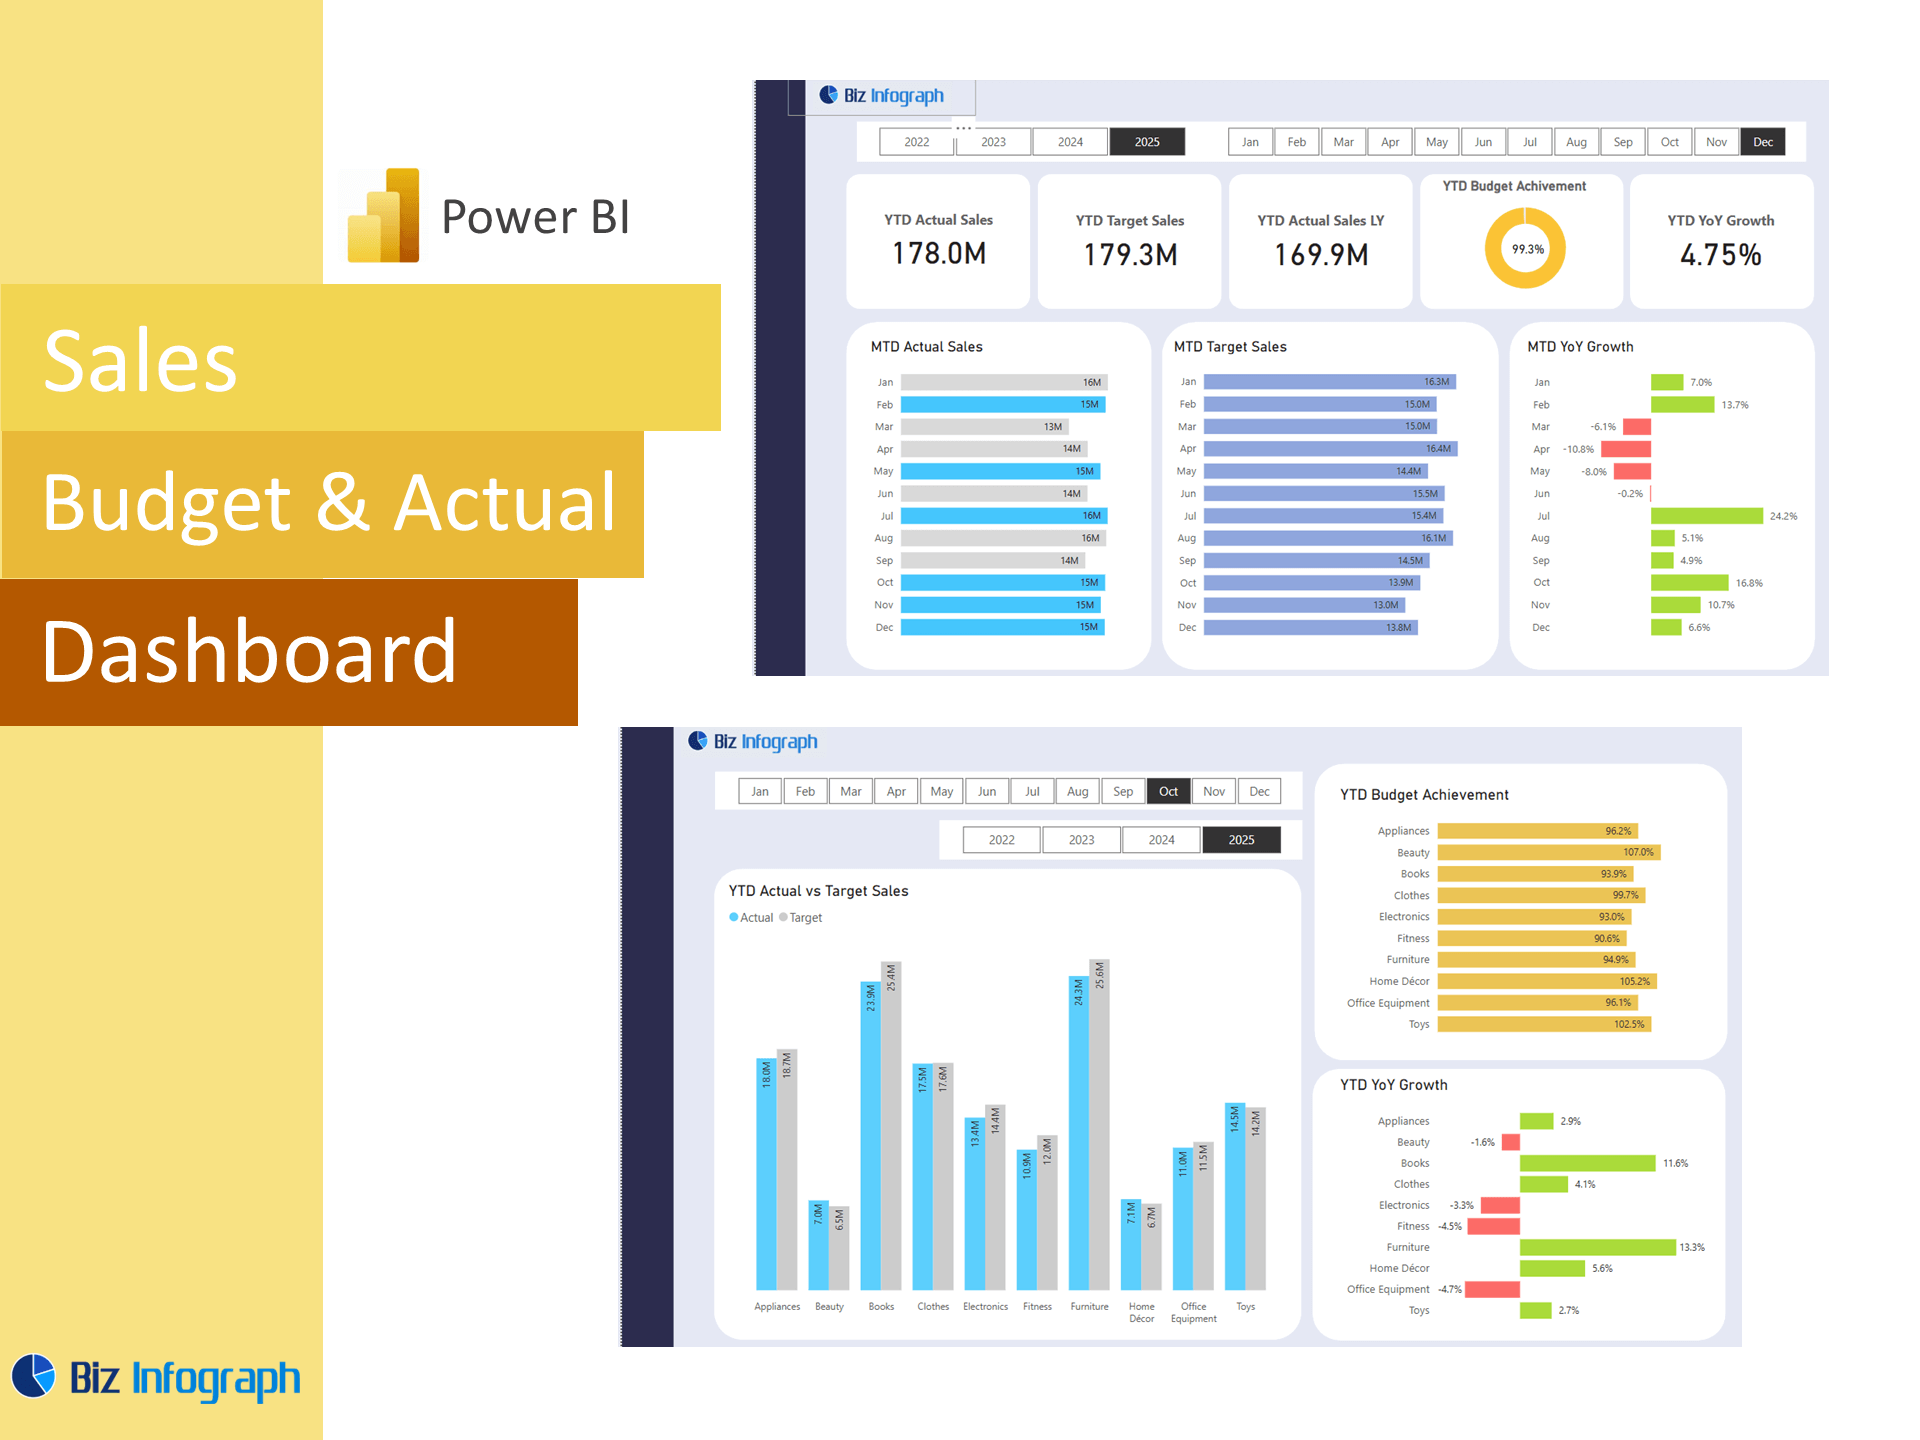
Sales Overview and Sales Pipeline Monitoring
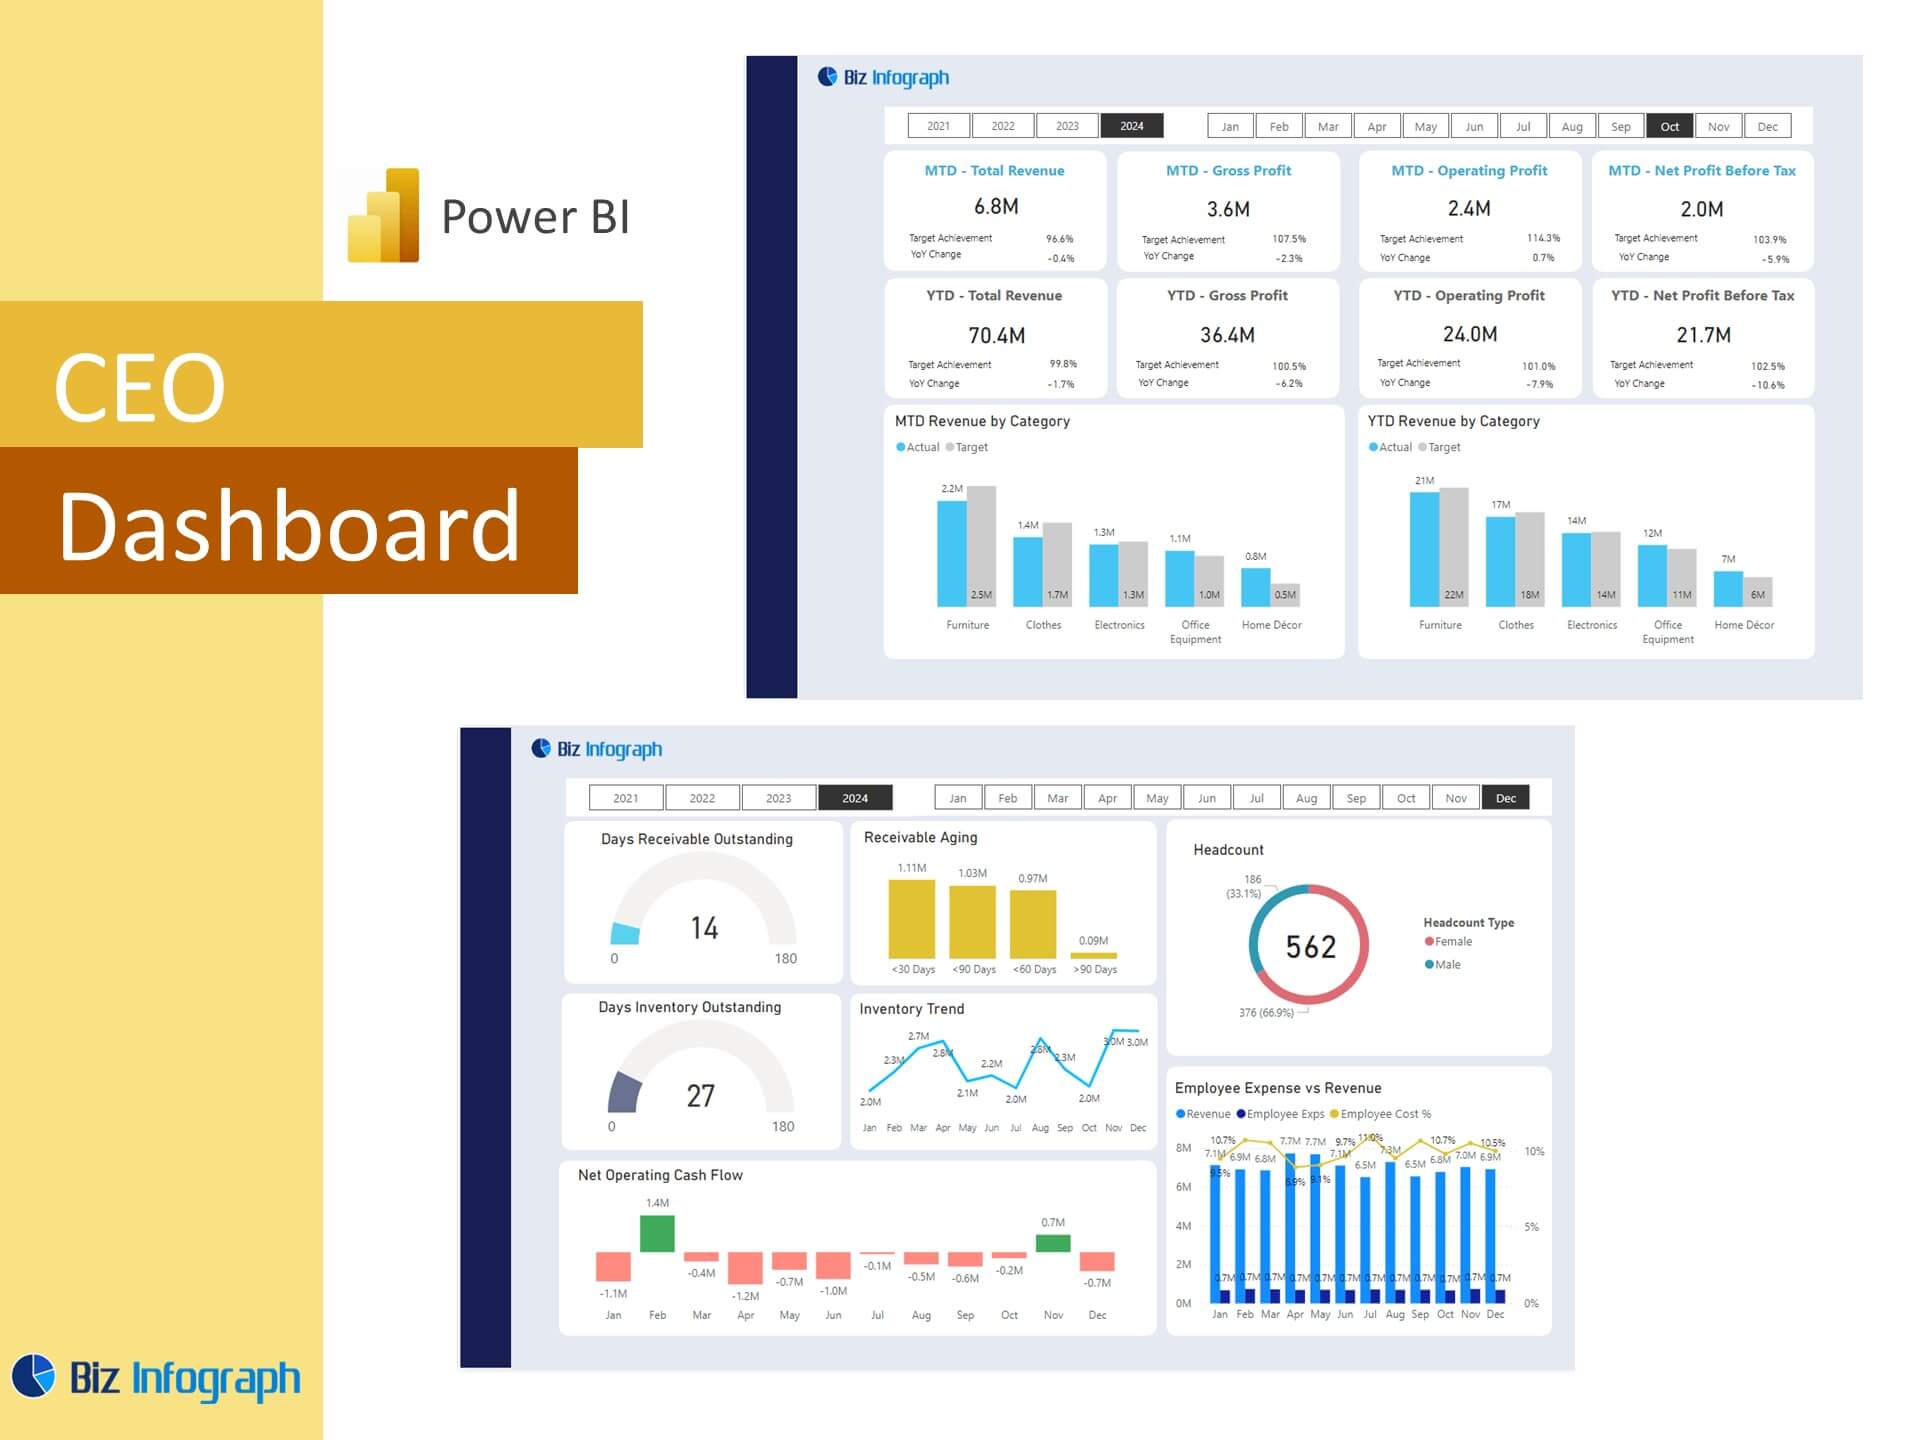
The sales overview section of a Power BI dashboard gives leadership a snapshot of revenue, opportunities, and quota attainment. It should break down sales by region, product, or rep while showing the overall progress toward targets. Meanwhile, the sales pipeline view tracks lead statuses and stage durations, offering predictive insights into future sales and backlog strength. These elements rely on connecting data from multiple business applications and enriching it through Power Query Editor. The result is a dashboard allows for day-to-day tactical adjustments and quarterly strategic planning.
Designing Effective Dashboards in Power BI
Choosing the Right Power BI Template for Sales Dashboards
When starting from scratch isn’t feasible, templates for Power BI offer a fast and reliable foundation. A strong Power BI Sales dashboard template will include pre-built visuals tailored for sales teams’ needs—such as revenue by stage, product sales, and rep contribution. These templates reduce deployment time and reflect best Power BI dashboard examples, which focus on clarity, responsiveness, and insight depth. Organizations often choose a default Power BI template as a starting point before refining it with custom visuals and metrics.
Best Practices for Interactive and Visual Dashboard Design
Interactive dashboards should follow clear principles: define your audience, prioritize high-impact visuals, and use intuitive navigation. Whether targeting sales managers, field reps, or executives, dashboards should offer logical layouts and dynamic filtering options. Emphasizing charts that compare performance over time, using color-coded alerts, and designing mobile-friendly layouts are hallmarks of the best dashboard examples. Ensure the dashboard uses consistent formatting and that it dashboard presents insights in a clean, readable structure. Leveraging Power BI’s bi tools, including tooltips and bookmarks, can further enhance engagement and clarity.
Customizing Dashboards for Sales and Marketing Insights
Custom dashboards allow businesses to merge sales analytics with marketing campaign data for a unified view. This could involve overlaying lead source data from a Google Ads dashboard with close rates tracked in your CRM. By tailoring filters and pages for both sales and marketing users, the dashboard also becomes a bridge between departments. These dashboards offer a clear view into lead quality, campaign ROI, and revenue impact—essential for refining joint sales and marketing strategies. Customization ensures dashboards stay relevant and aligned with the business's evolving needs.
Power BI Reporting and Service Integration
Creating and Sharing Power BI Reports Through Power BI Service
Publishing to Power BI Service makes dashboards accessible to all stakeholders in a secure, cloud-based environment. Reports can be scheduled, shared through apps, or embedded into team platforms like SharePoint or Teams. This seamless access promotes consistent data with Power BI usage and reduces dependence on isolated reports. Teams can collaborate on the same version of the truth, while Power BI provides built-in governance to manage roles and permissions effectively.
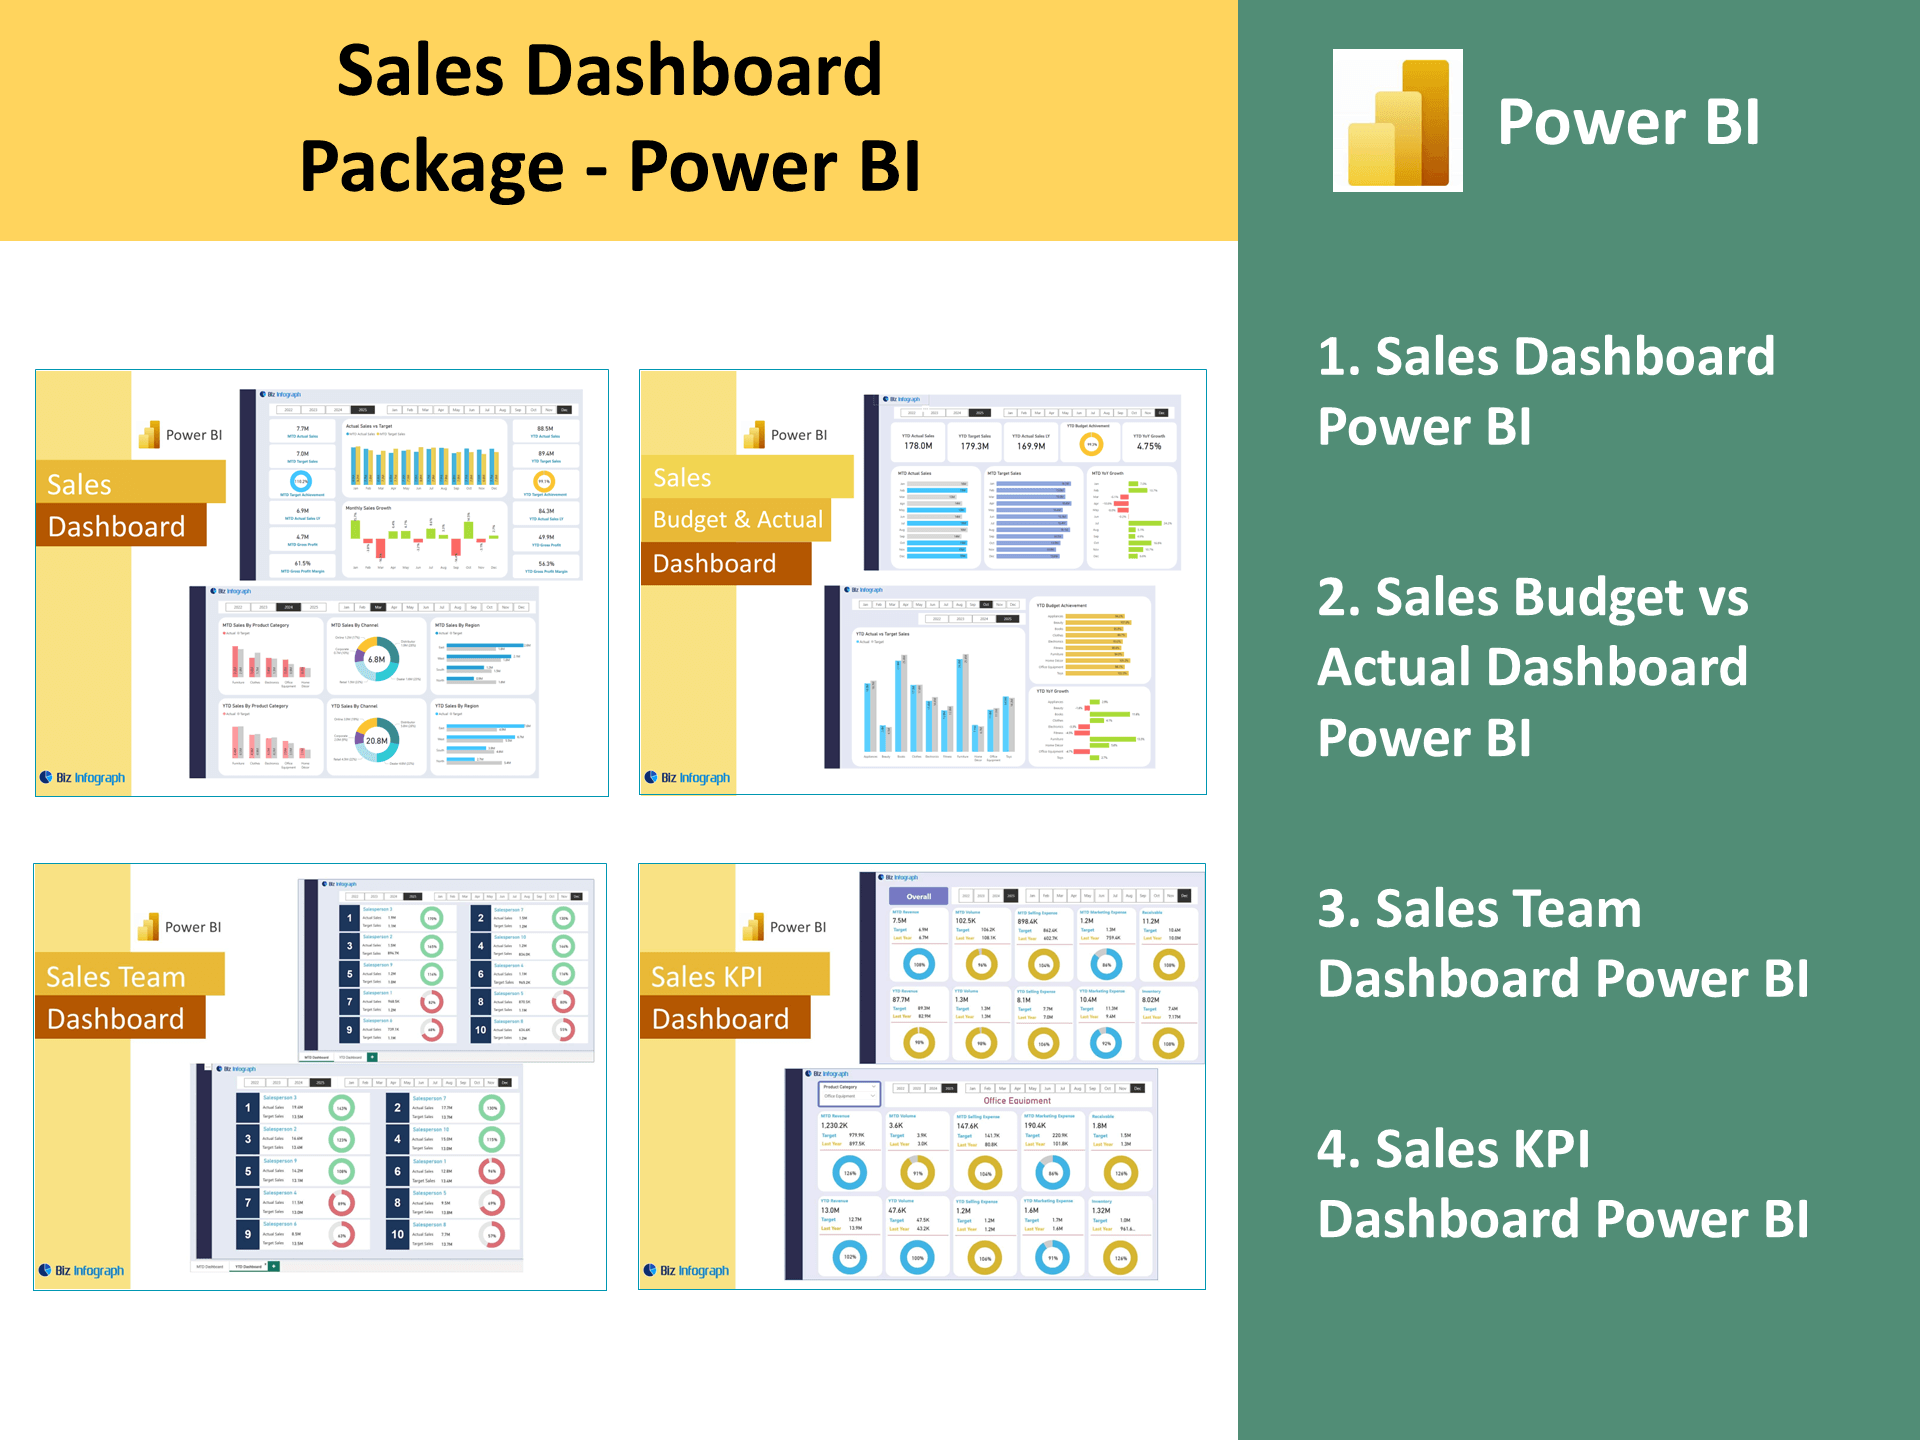
Examples of Power BI Dashboards for Sales Analysis
Power BI dashboard examples include a variety of use cases—from territory performance tracking and sales analysis dashboards to quota vs. attainment reviews. These examples of Power BI dashboards demonstrate how organizations combine transactional, CRM, and marketing data to fuel smarter selling. Many of these dashboards are featured in Microsoft’s Power BI templates library and can be downloaded or adapted for internal use. Whether you’re using a power bi finance report or a high-level executive dashboard, the customization options ensure that the data source matches your business needs.
Leveraging Power BI for Continuous Sales Performance Optimization
Sales teams thrive on data-driven accountability. A dashboard in Power BI empowers organizations to assess reps’ impact, refine sales process efficiency, and align with long-term revenue goals. By setting scheduled data refreshes and integrating data into actionable insights, dashboards evolve alongside strategy. Whether you’re reviewing the next Power BI report or developing a new view for a product launch, ongoing dashboard iteration keeps performance metrics aligned with evolving objectives. Leveraging Power BI supports ongoing learning and insight sharing for continual improvement.
For ready-to-use Dashboard Templates:
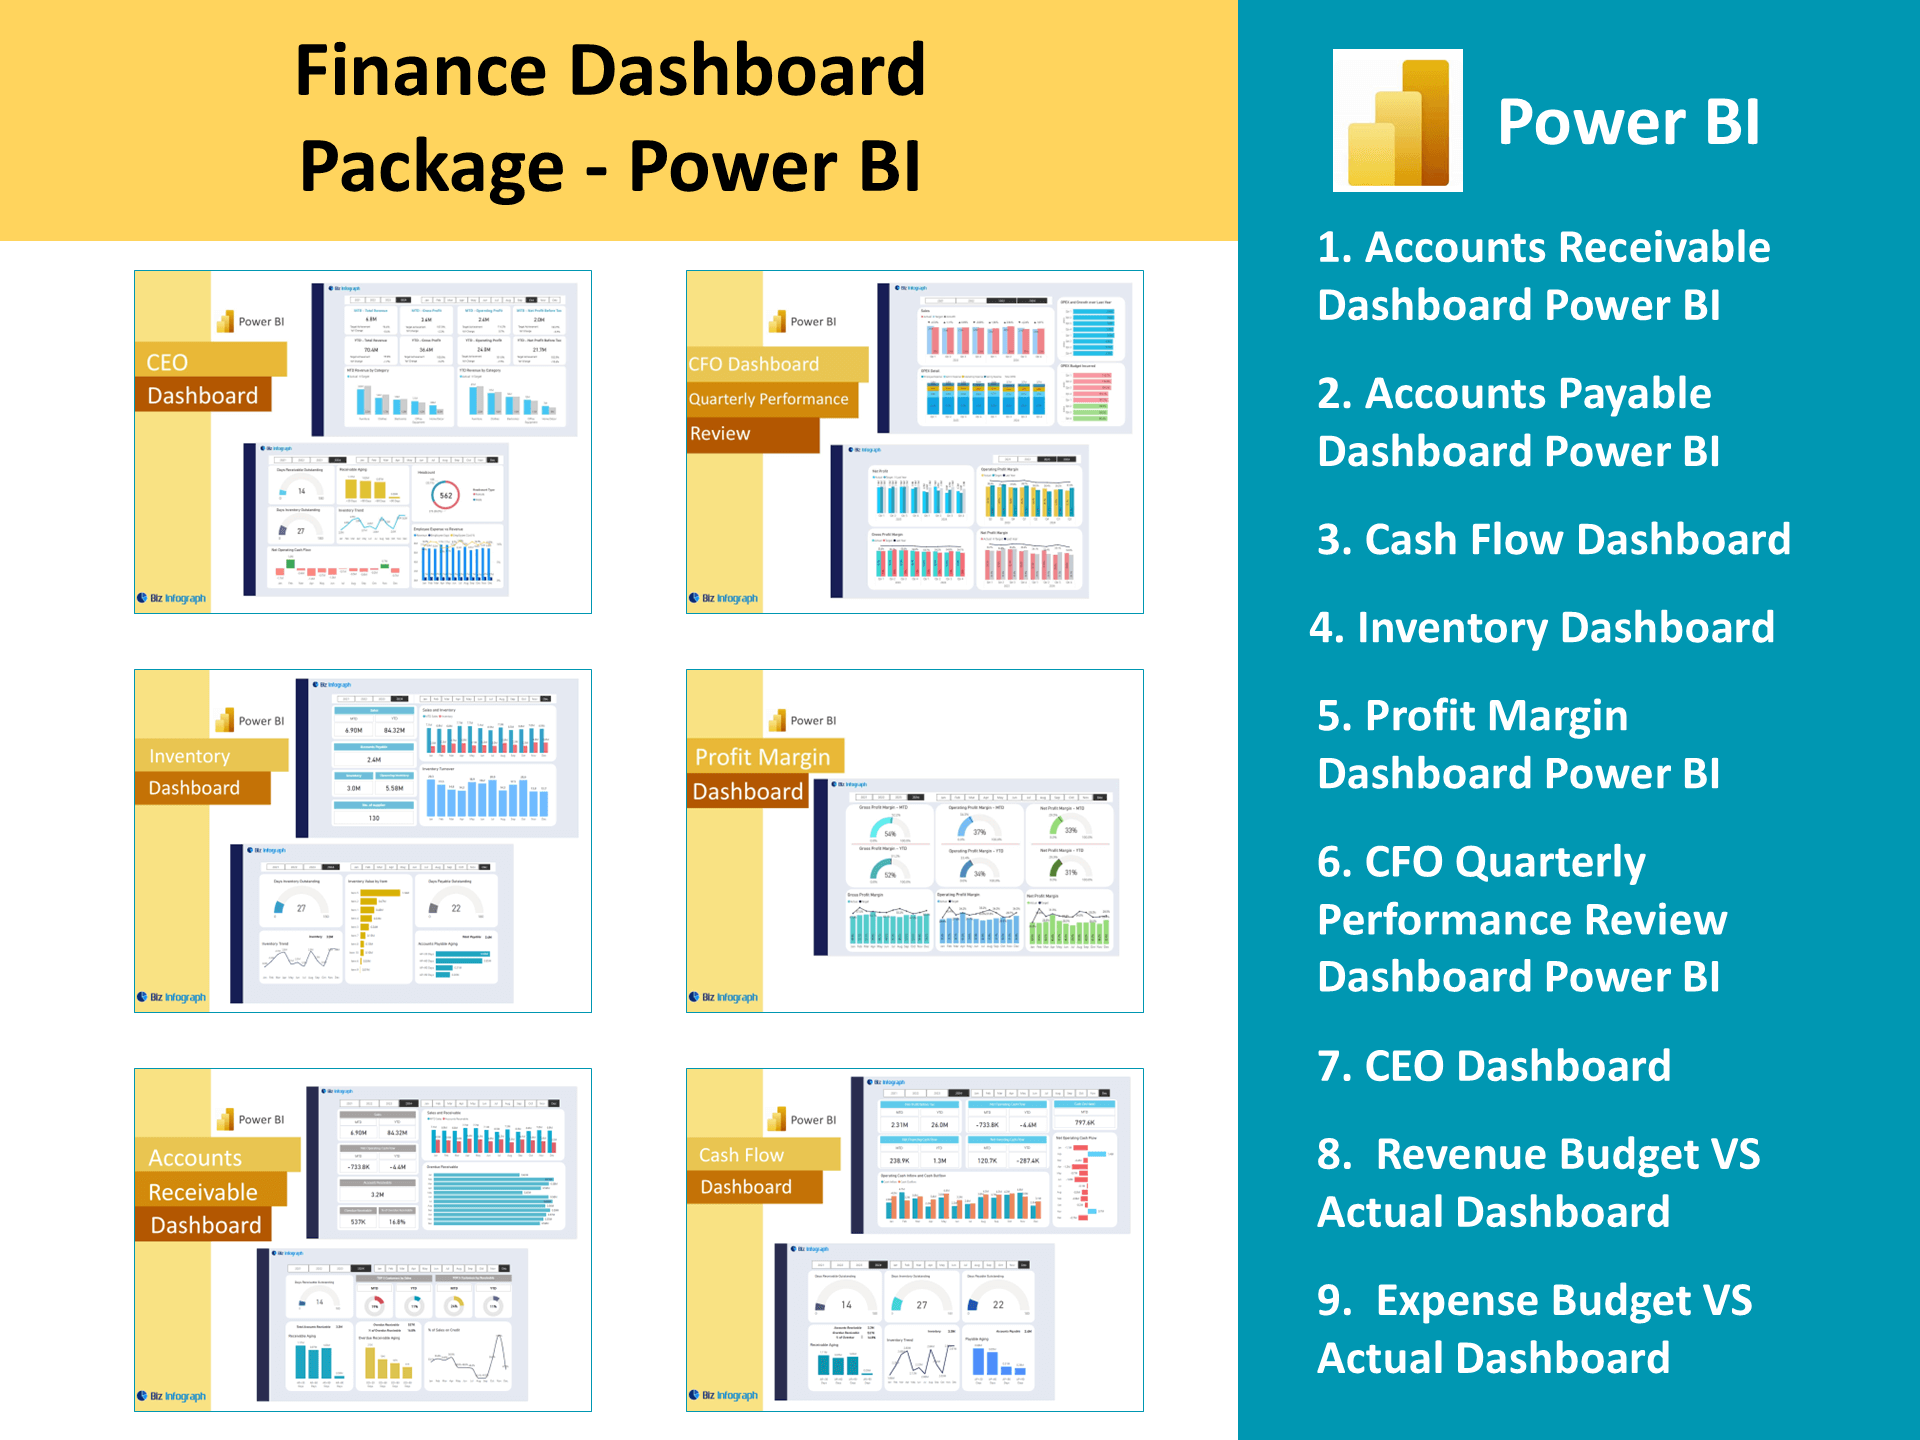
- Financial Dashboards
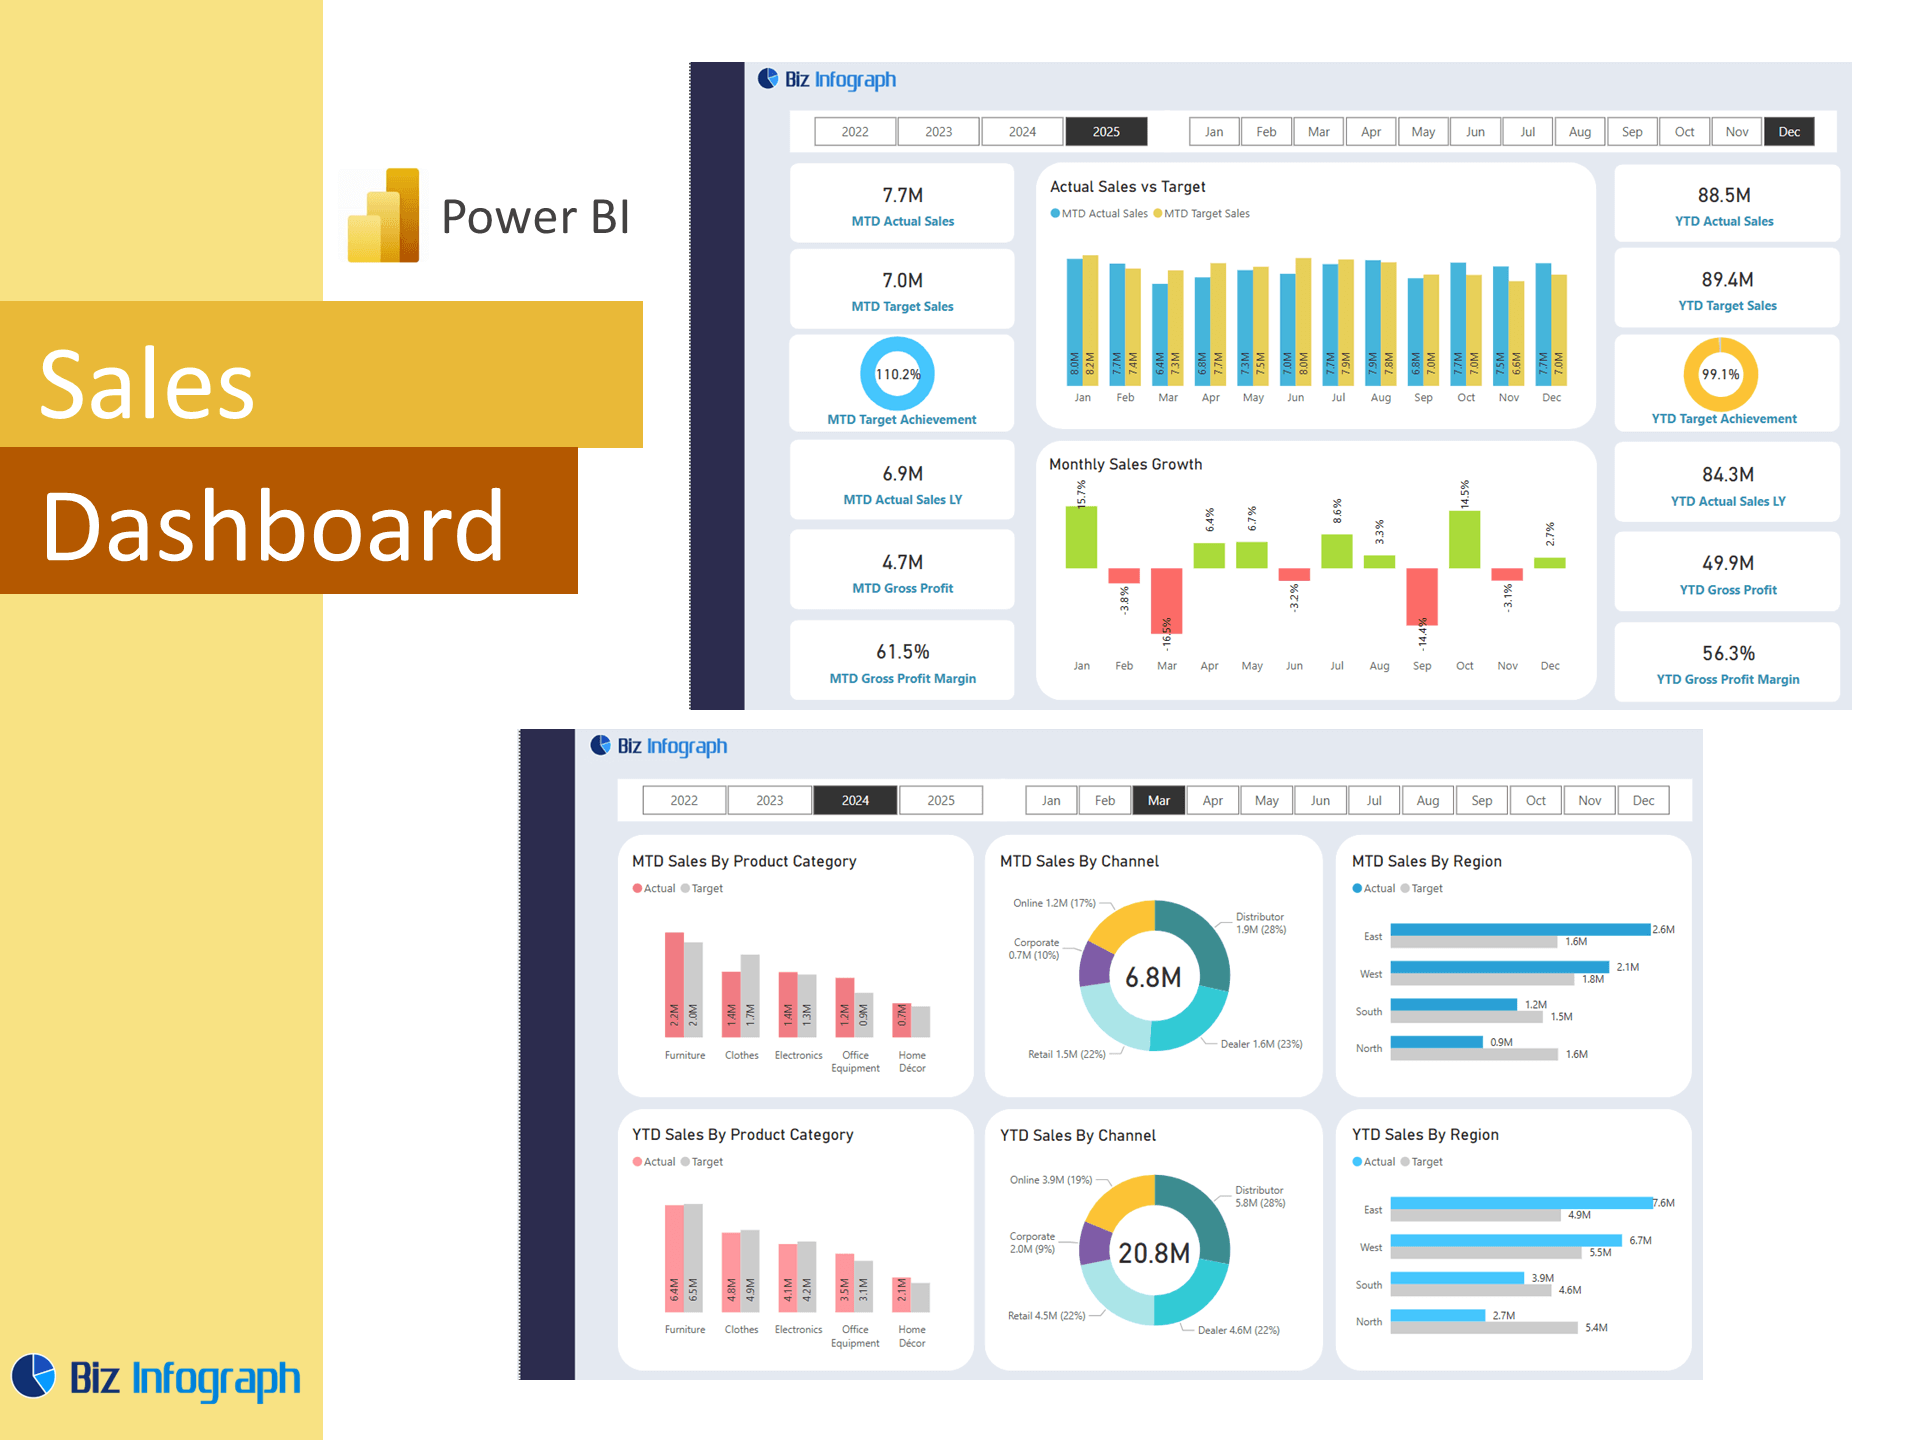
- Sales Dashboards
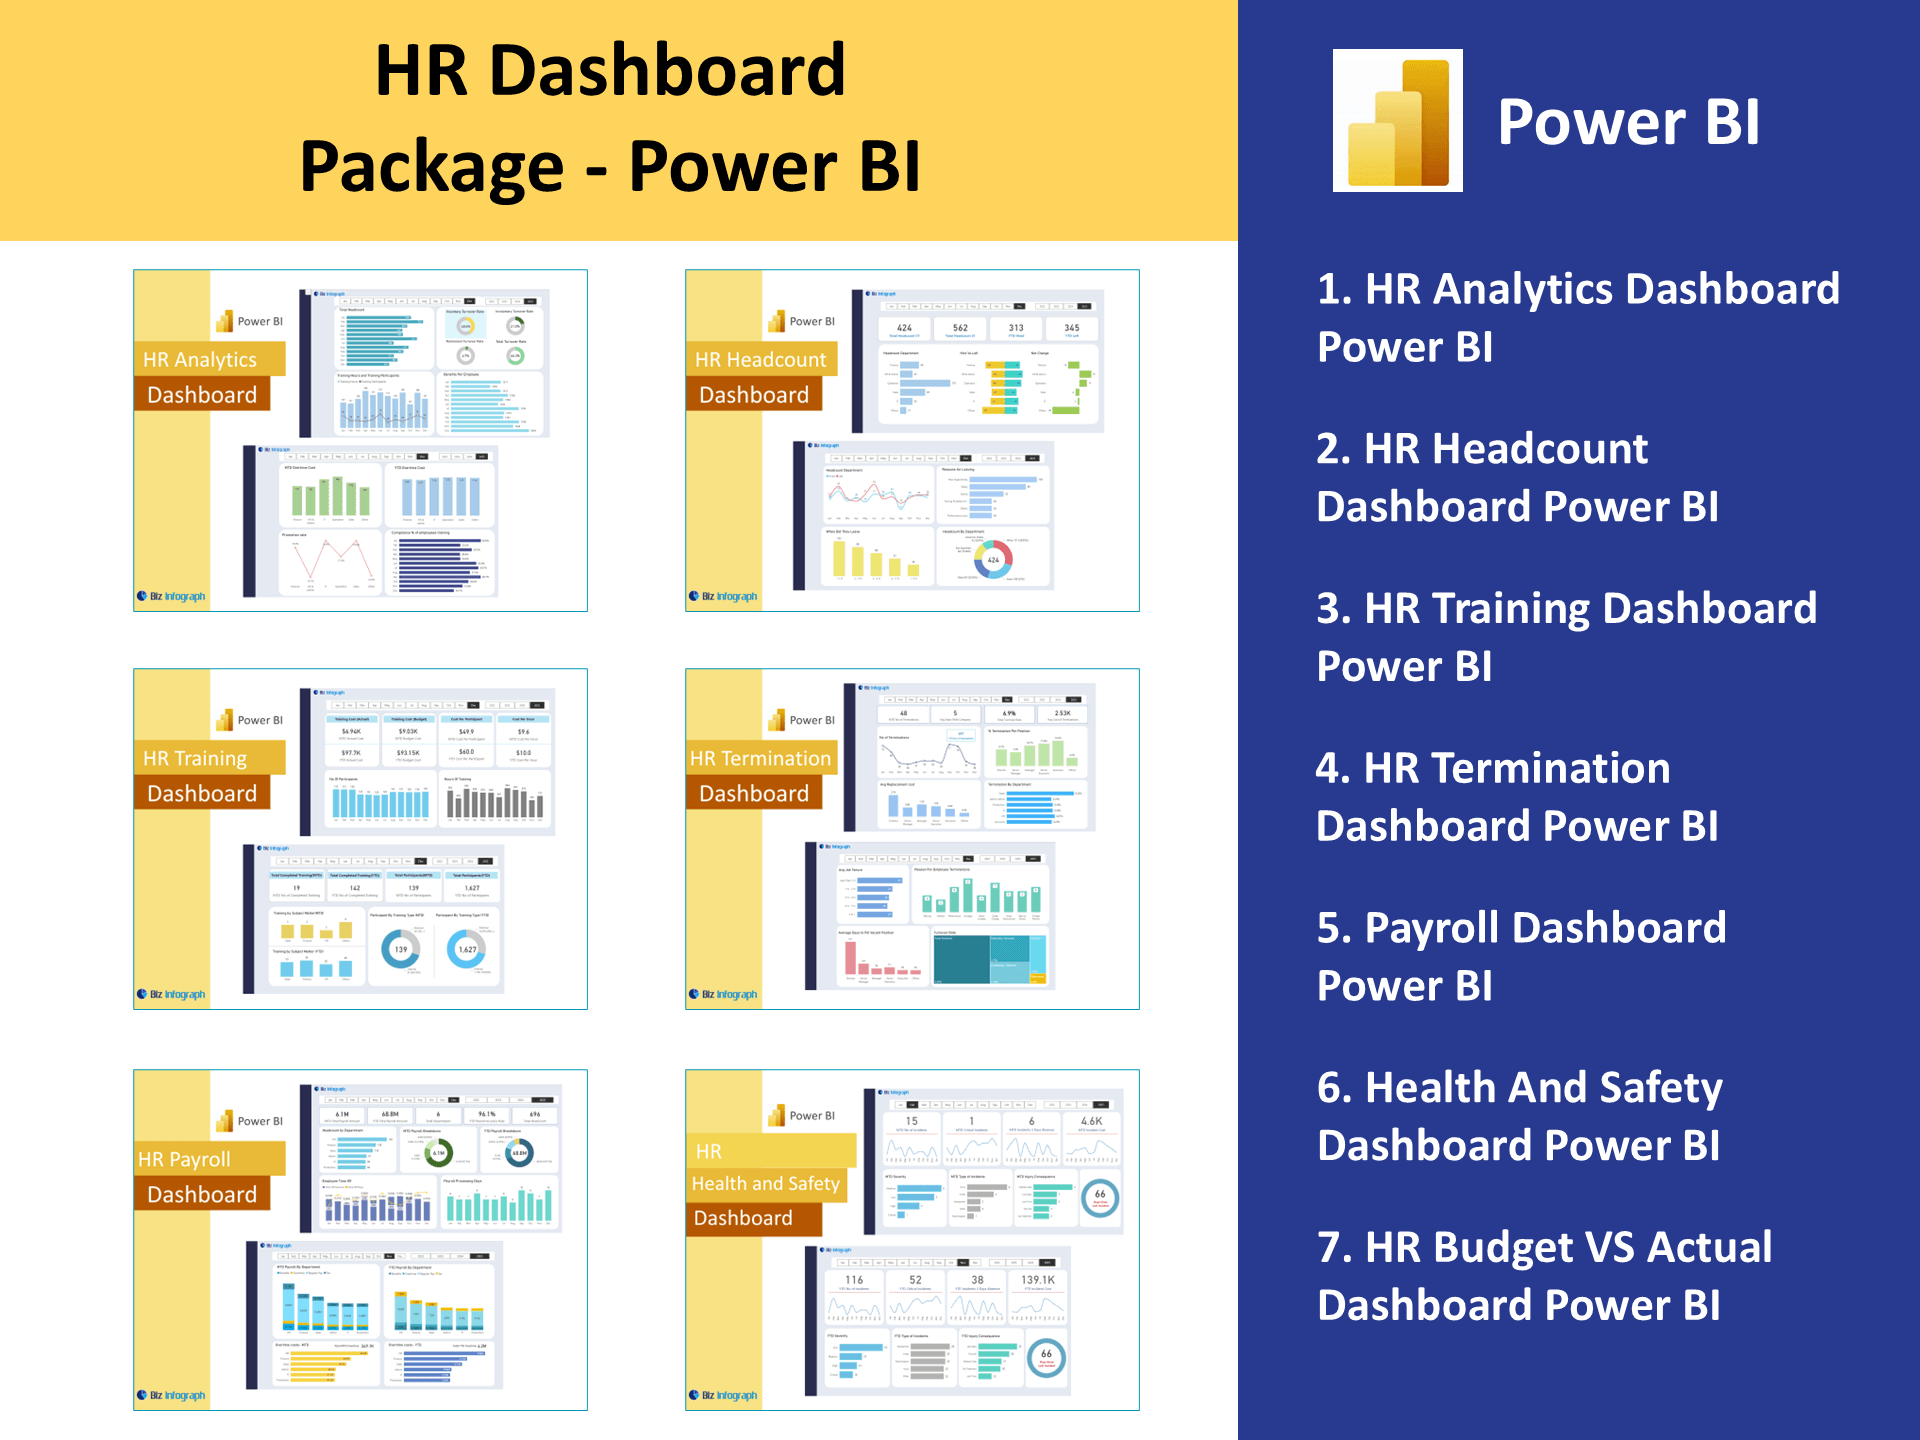
- HR Dashboards
- Data Visualization Charts
- Power BI – Biz Infograph
- Automation – Biz Infograph