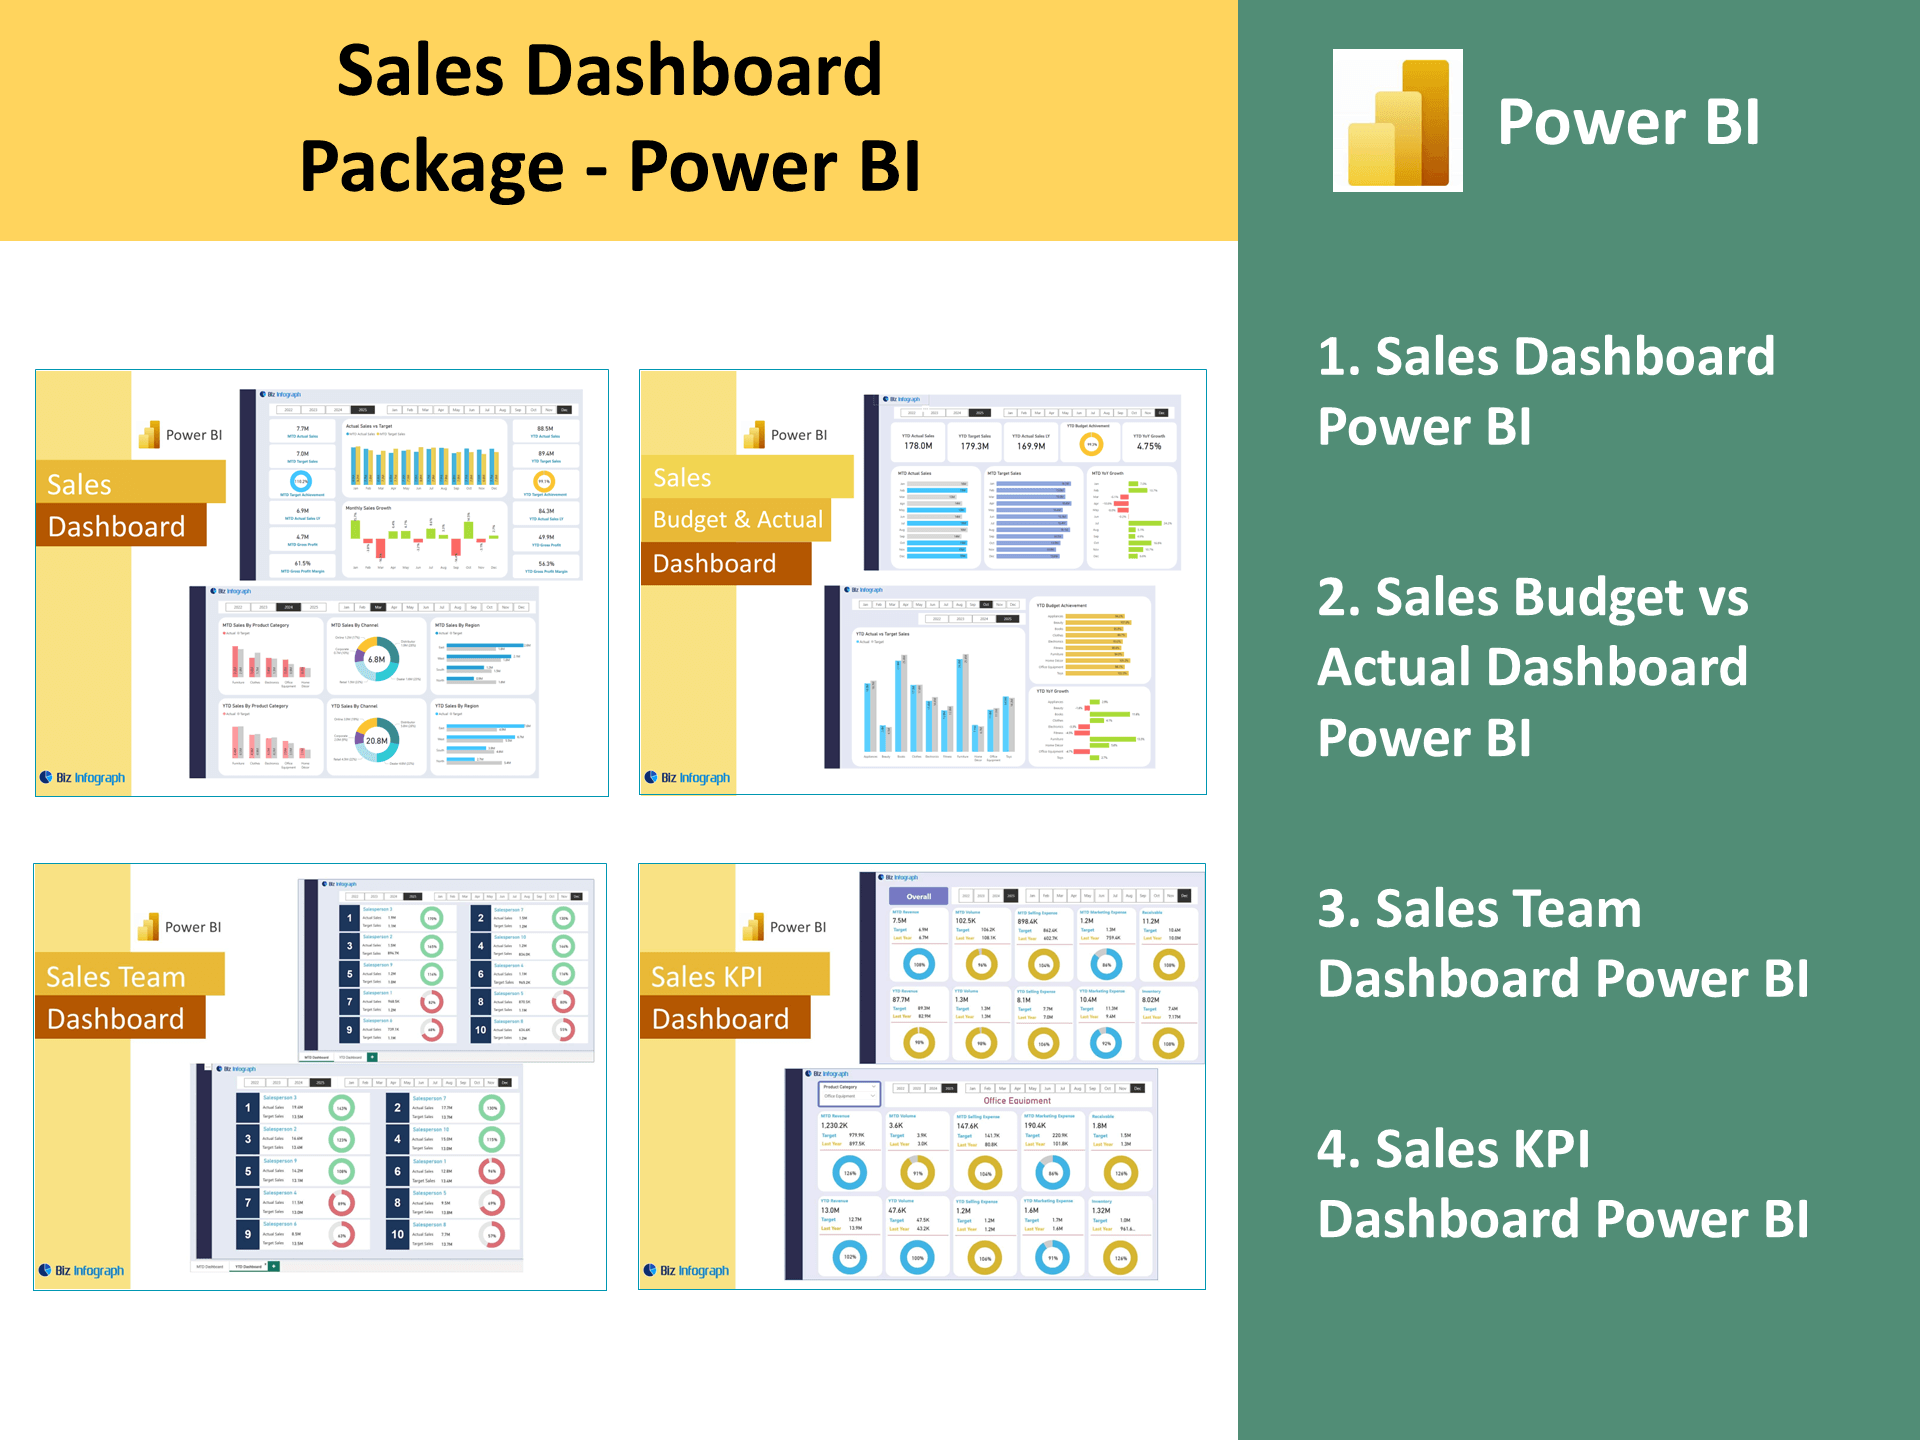
Sales Dashboard Power BI Template
Introduction to Sales Dashboard Power BI Templates
What is a Sales Dashboard Template in Power BI?
A Sales Dashboard Template in Power BI is a pre-built structure that allows users to quickly build a dashboard using pre-configured visualizations and metrics related to sales performance. Designed in Power BI Desktop, these templates serve as a framework for transforming raw data into meaningful reports. Whether tracking revenue, sales targets, or conversion trends, the dashboard provides a clear view into sales KPIs. A good Power BI dashboard template simplifies setup by including predefined visuals, slicers, and metrics—all of which are customizable. These templates save time and ensure consistency across departments, making them essential tools for sales managers, analysts, and business leaders.
Importance of Using Dashboard Templates for Sales Teams
For modern sales teams, dashboard templates streamline reporting and eliminate the need for manual data exports. Sales professionals can make data-driven decisions by instantly accessing key indicators like conversion rates, pipeline velocity, and revenue growth. Templates built in Microsoft Power BI allow teams to connect live data sources like CRMs, spreadsheets, key metrics, or databases and view metrics in real time. Whether you're monitoring progress across a marketing campaign, comparing regions, or evaluating reps, a well-structured dashboard helps explore data efficiently and align actions with goals. This consistent insight delivery supports a robust, adaptive sales strategy.
Benefits of Building Sales Dashboards in Microsoft Power BI
Microsoft Power BI is a leading data visualization tool known for its flexibility and scalability. Building sales dashboards in Power BI offers deep data analytics, seamless integration with cloud-based data sources, and access to interactive reports and dashboards. From revenue trends to customer churn, Power BI empowers businesses to visualize their data in ways that support critical decision-making. Moreover, dashboards can be deployed through the Power BI service, allowing secure access across devices. With a purpose of the dashboard focused on clarity and insights, Power BI is the preferred platform for scalable, modern BI dashboard design.
Key Components of a Sales Analysis Dashboard
Essential Metrics in a Sales Dashboard
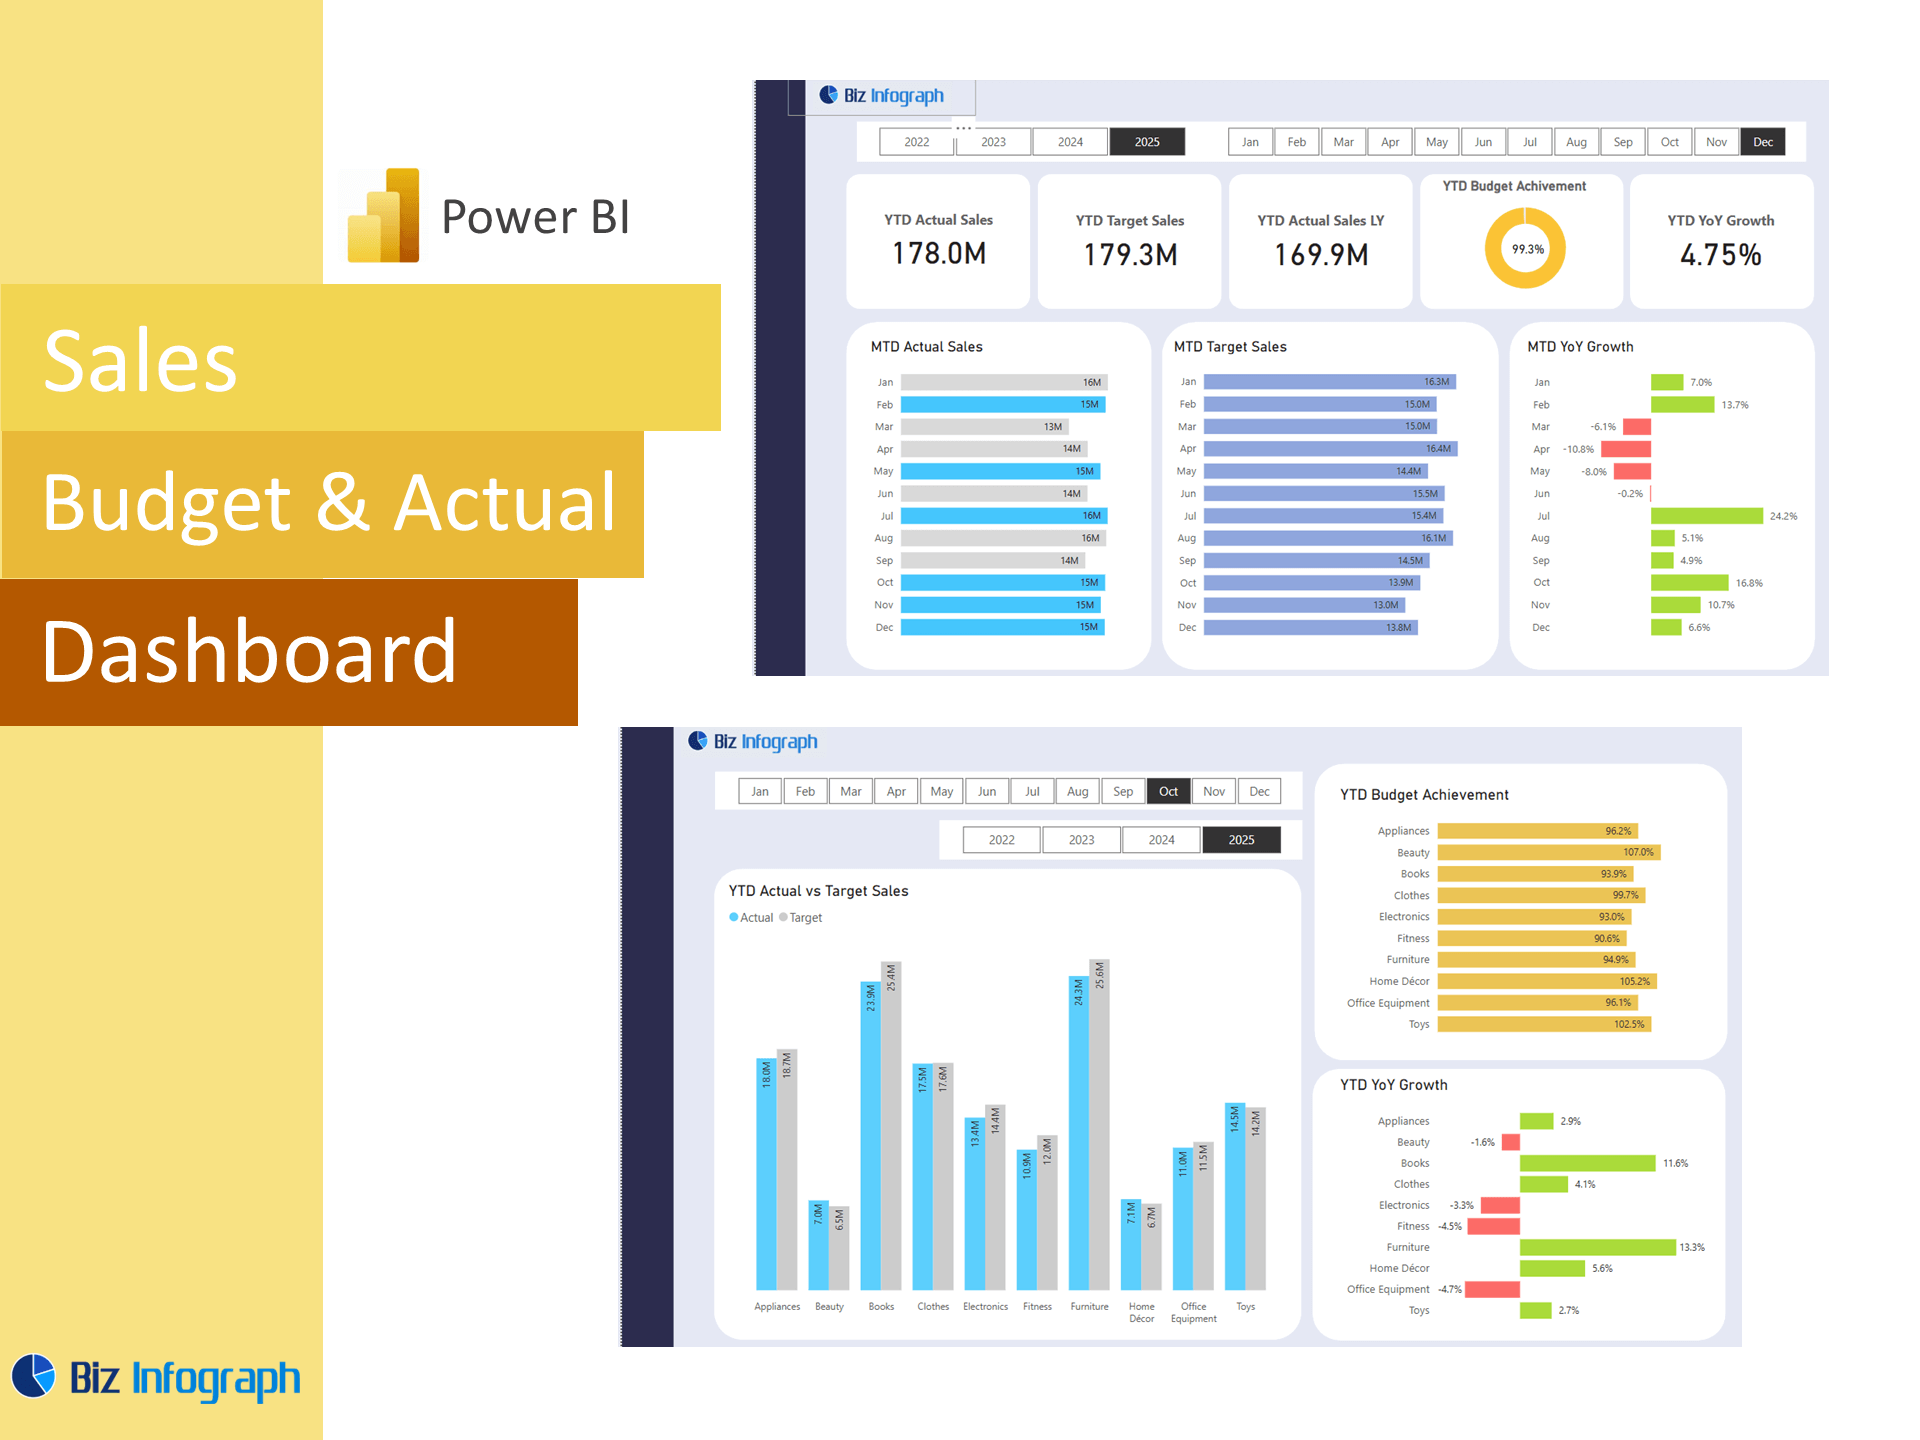
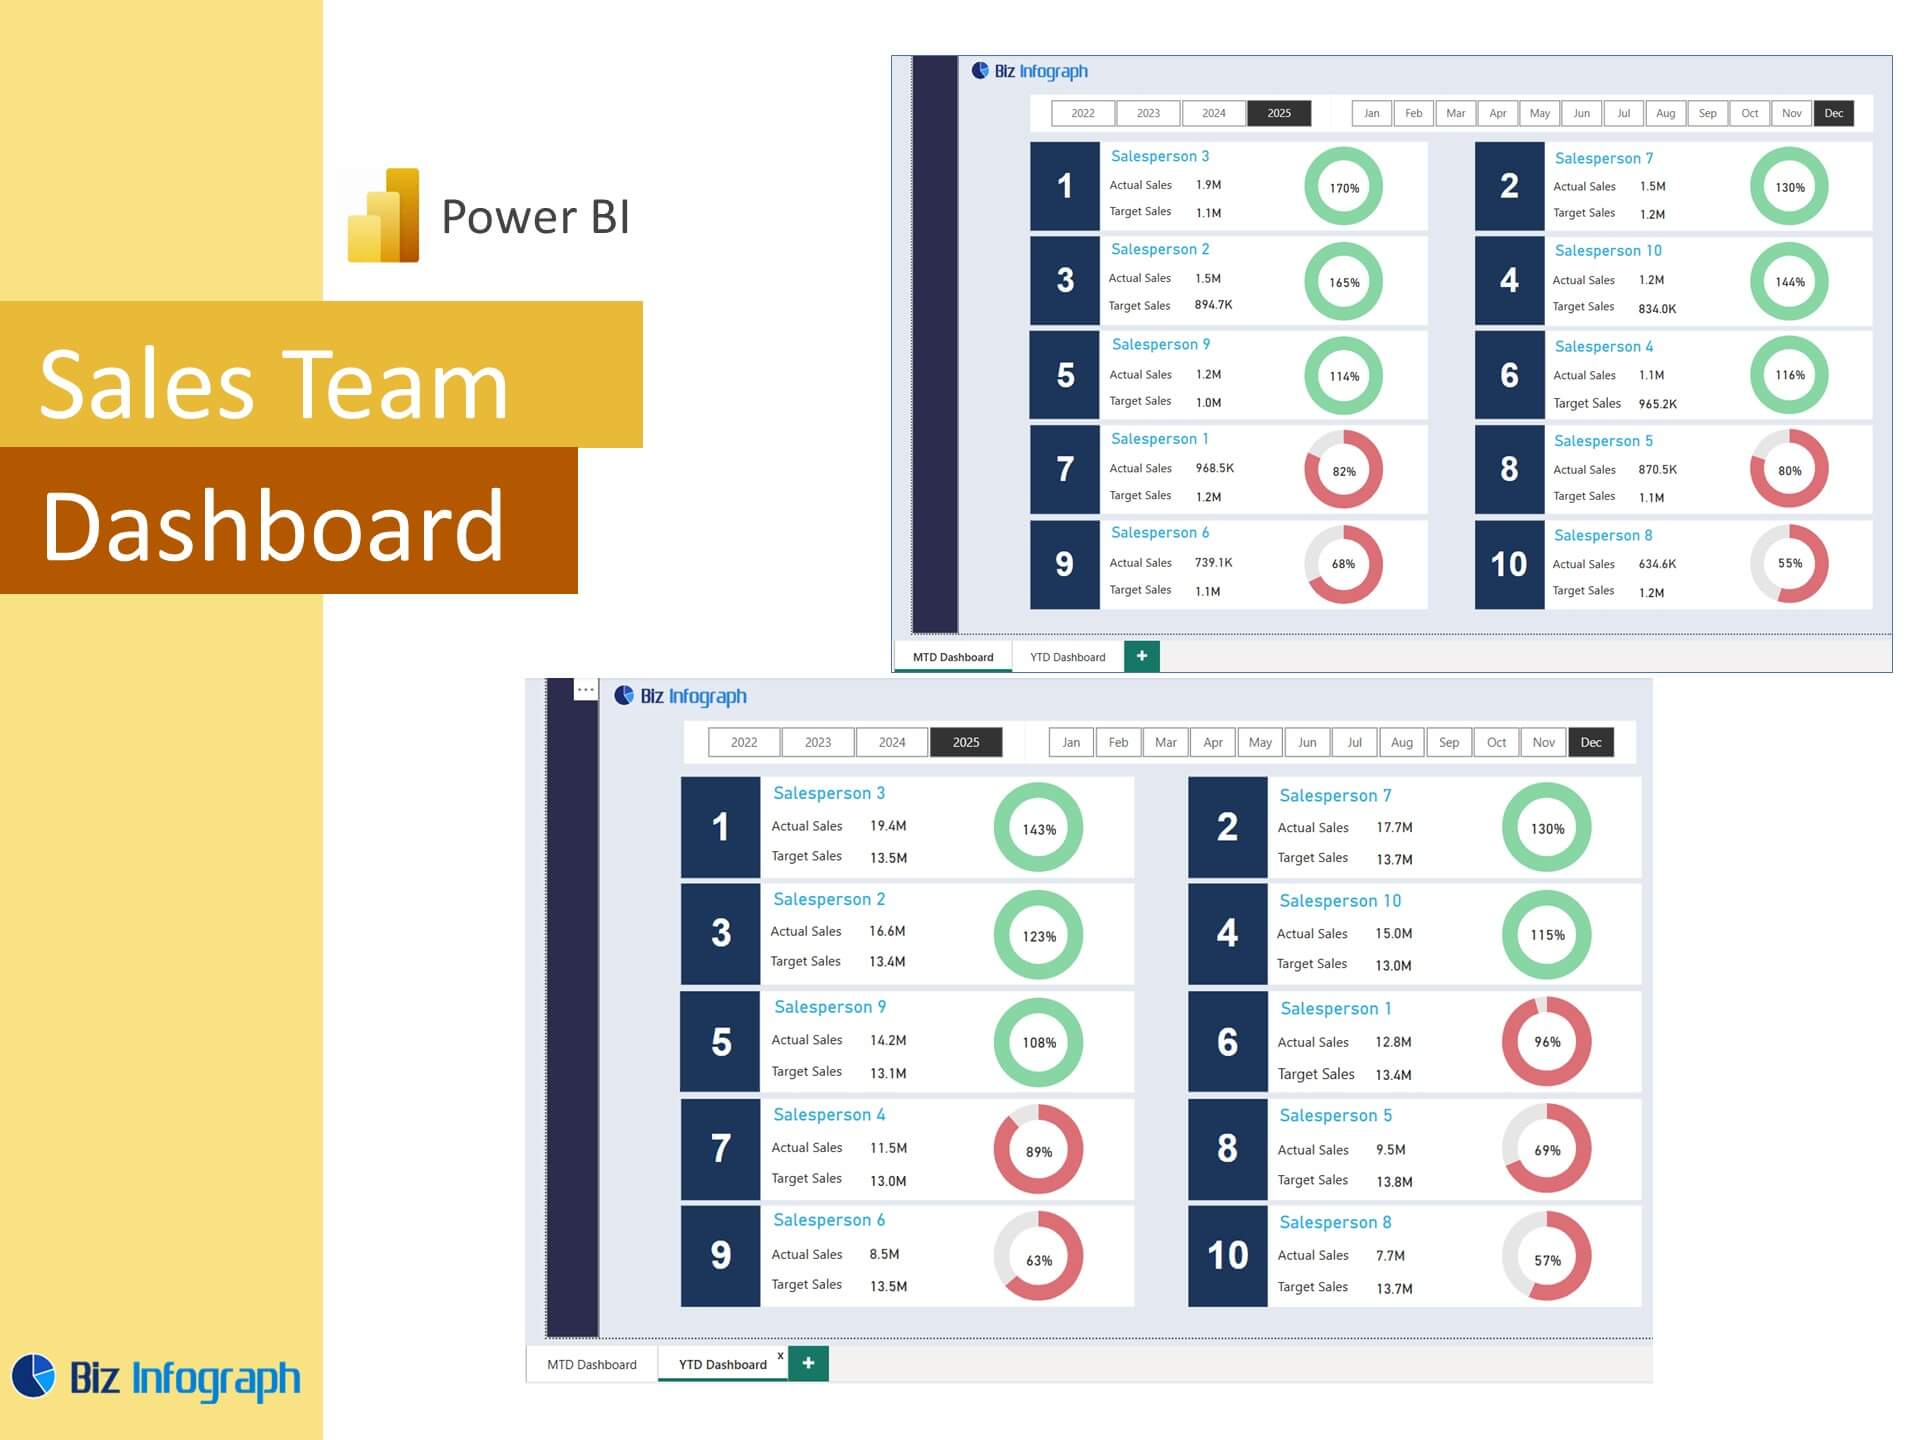
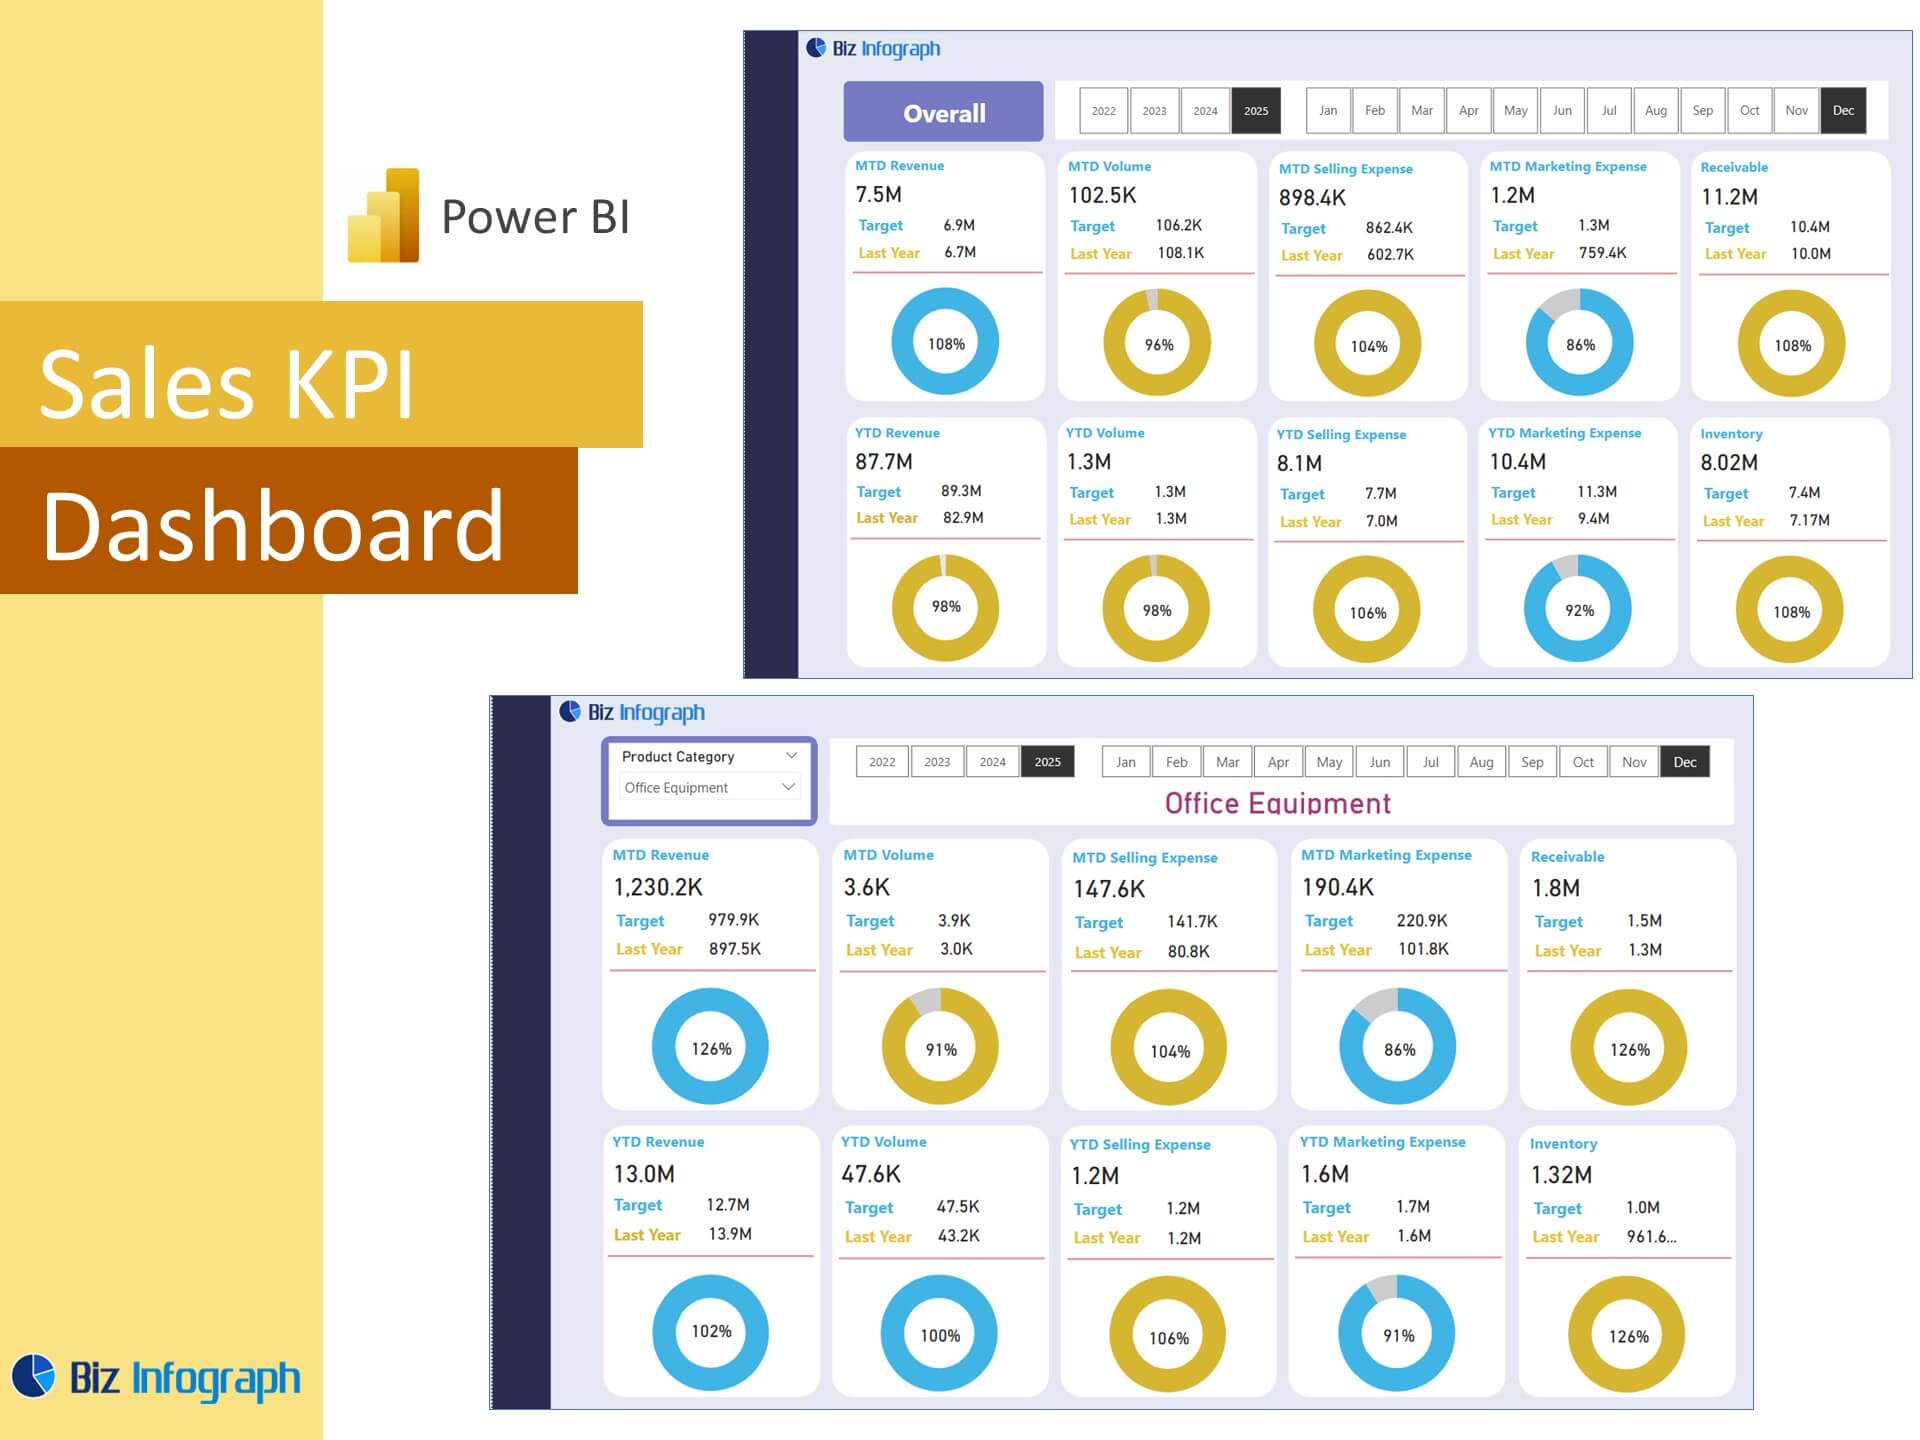
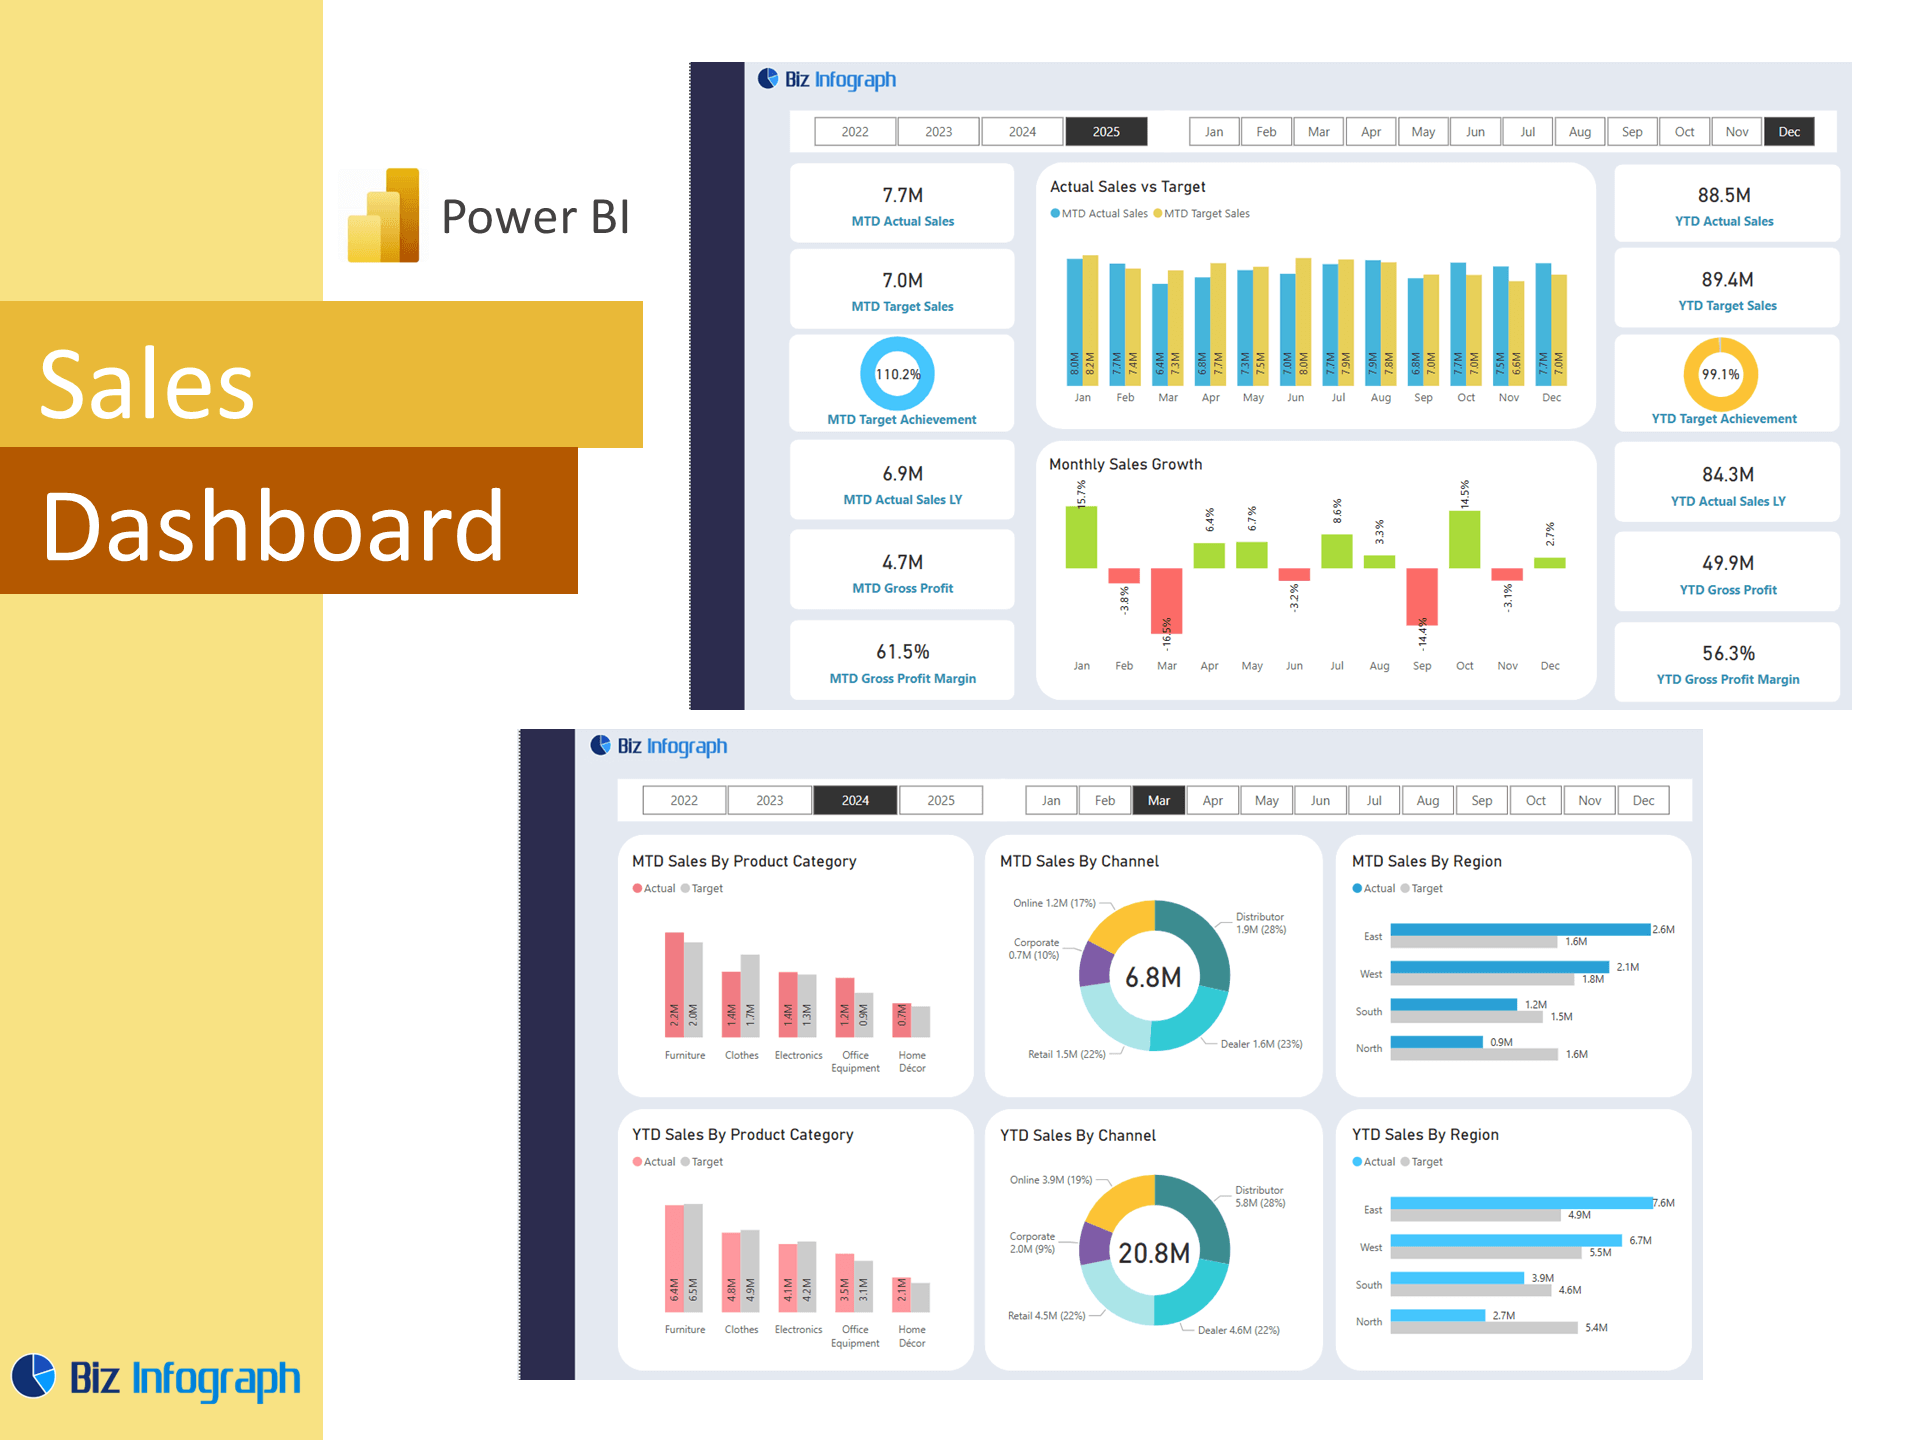
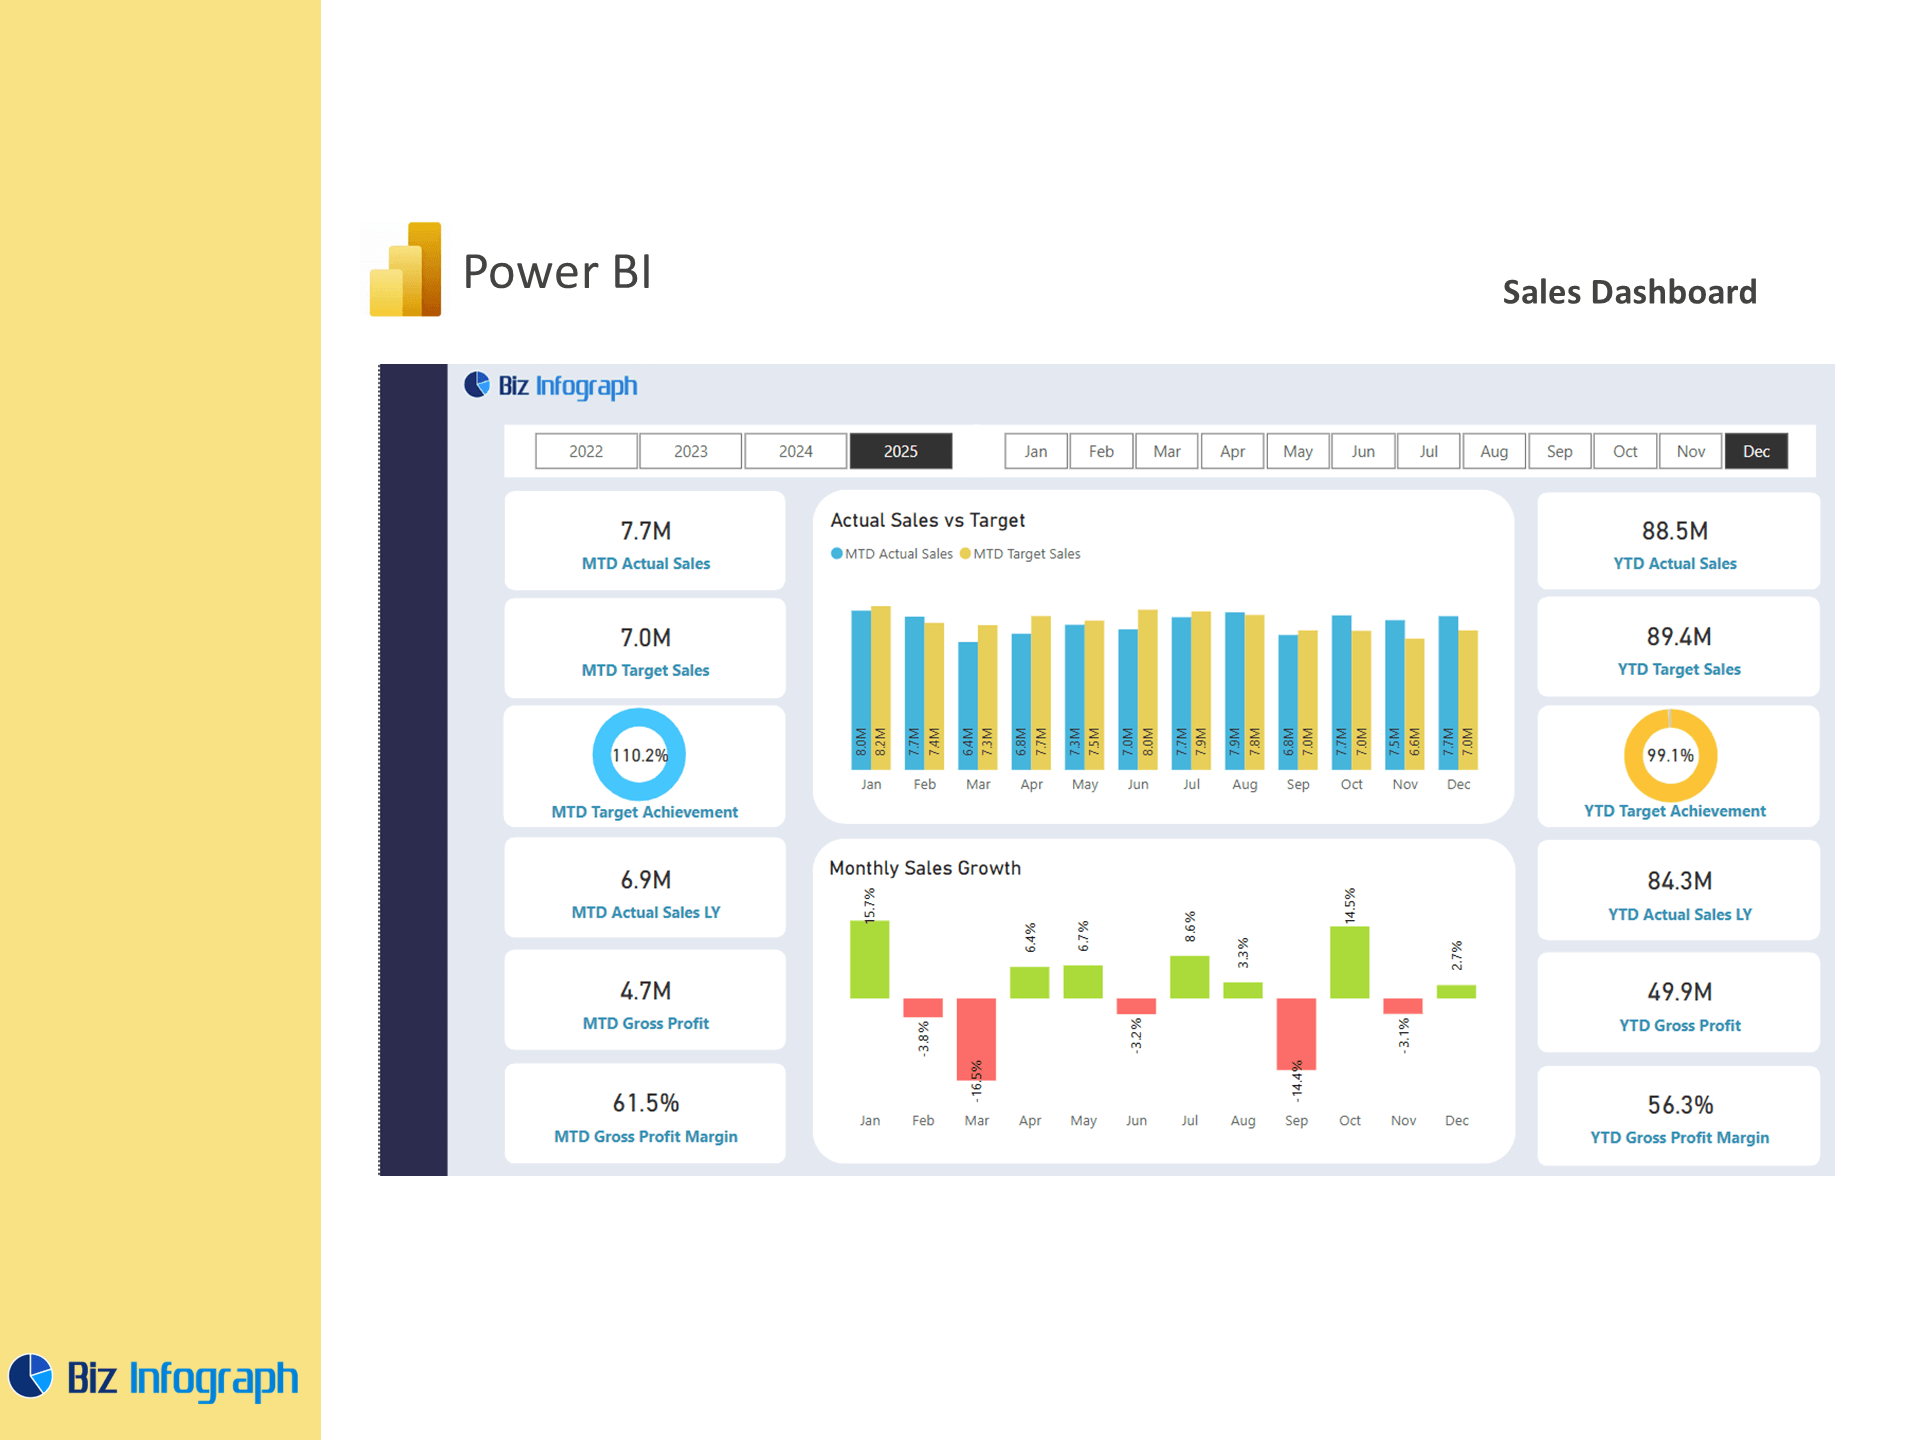
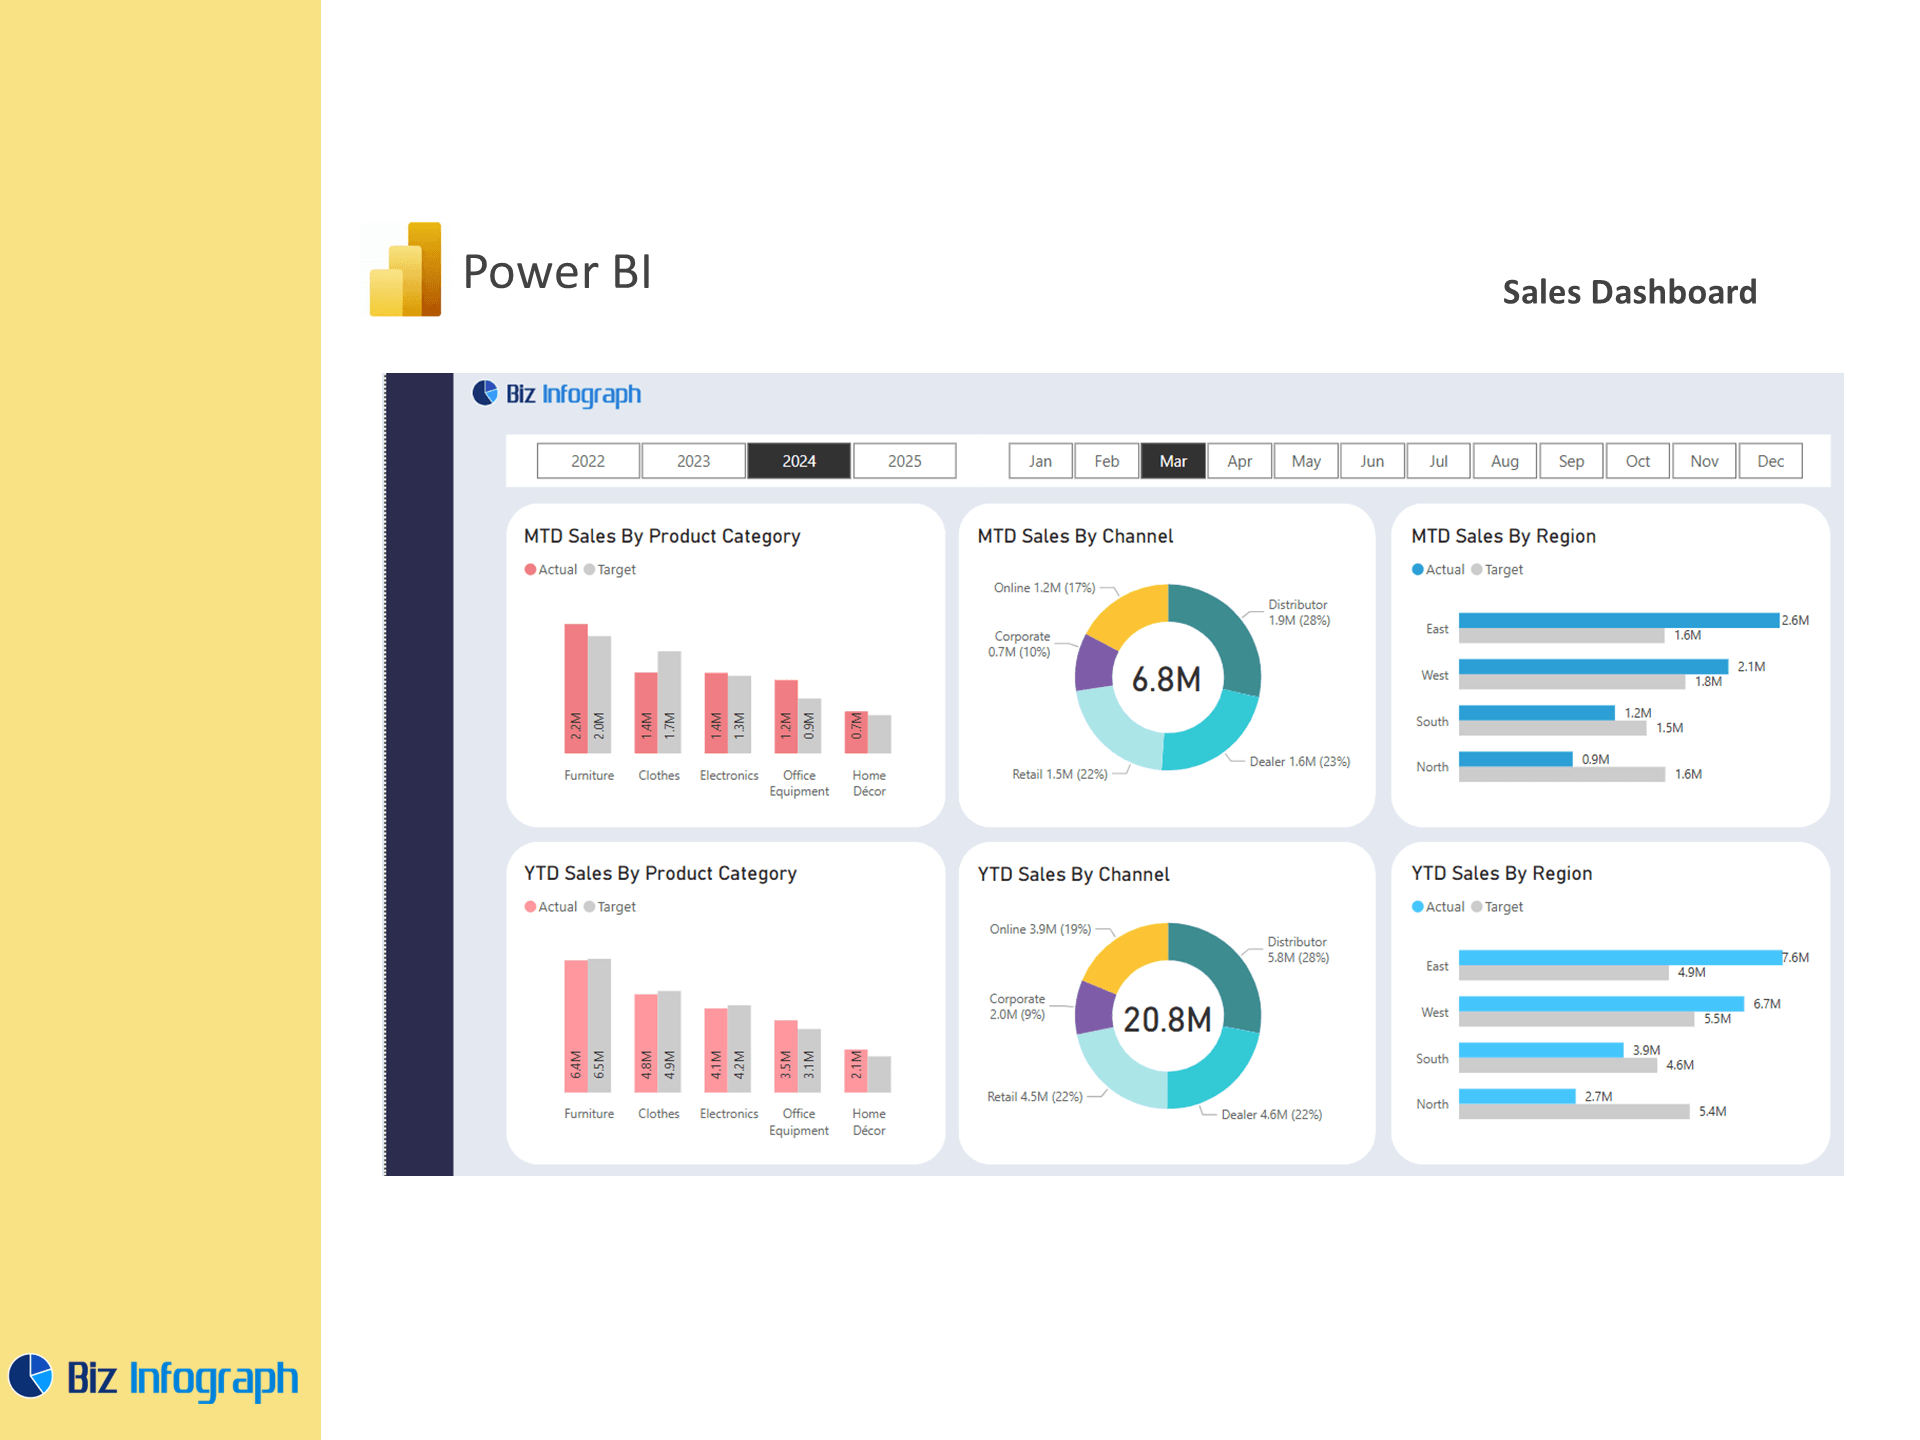
A comprehensive sales dashboard incorporates metrics that drive business growth and performance evaluation. These include sales amount, conversion rate, average deal size, churn, and regional sales split. For sales managers, viewing sales data in real-time helps identify bottlenecks and reallocate resources efficiently. These dashboards also highlight variances between sales targets and actuals, making them critical for ongoing forecasting. Utilizing a kpi dashboard format, Power BI templates consolidate key stats in one screen. This offers a snapshot for leadership and a deep-dive tool for analysts alike—supporting ongoing tracking, refinement, and achievement of strategic sales objectives.
Integrating Sales Analytics for Data-Driven Insights
Sales analytics involves examining sales data to uncover patterns, predict outcomes, and optimize performance. By integrating data from various systems—like CRM platforms, marketing platforms, and ERP tools—Power BI users can perform advanced data analysis using a unified data model. This allows companies to go beyond tracking performance and start shaping it. Sales dashboards built on strong analytics foundations reveal trends over time, offer data visualization for comparisons, and identify key customer behaviors. These insights dashboards offer a complete view that helps teams make informed decisions, reduce missed opportunities, and personalize sales strategies.
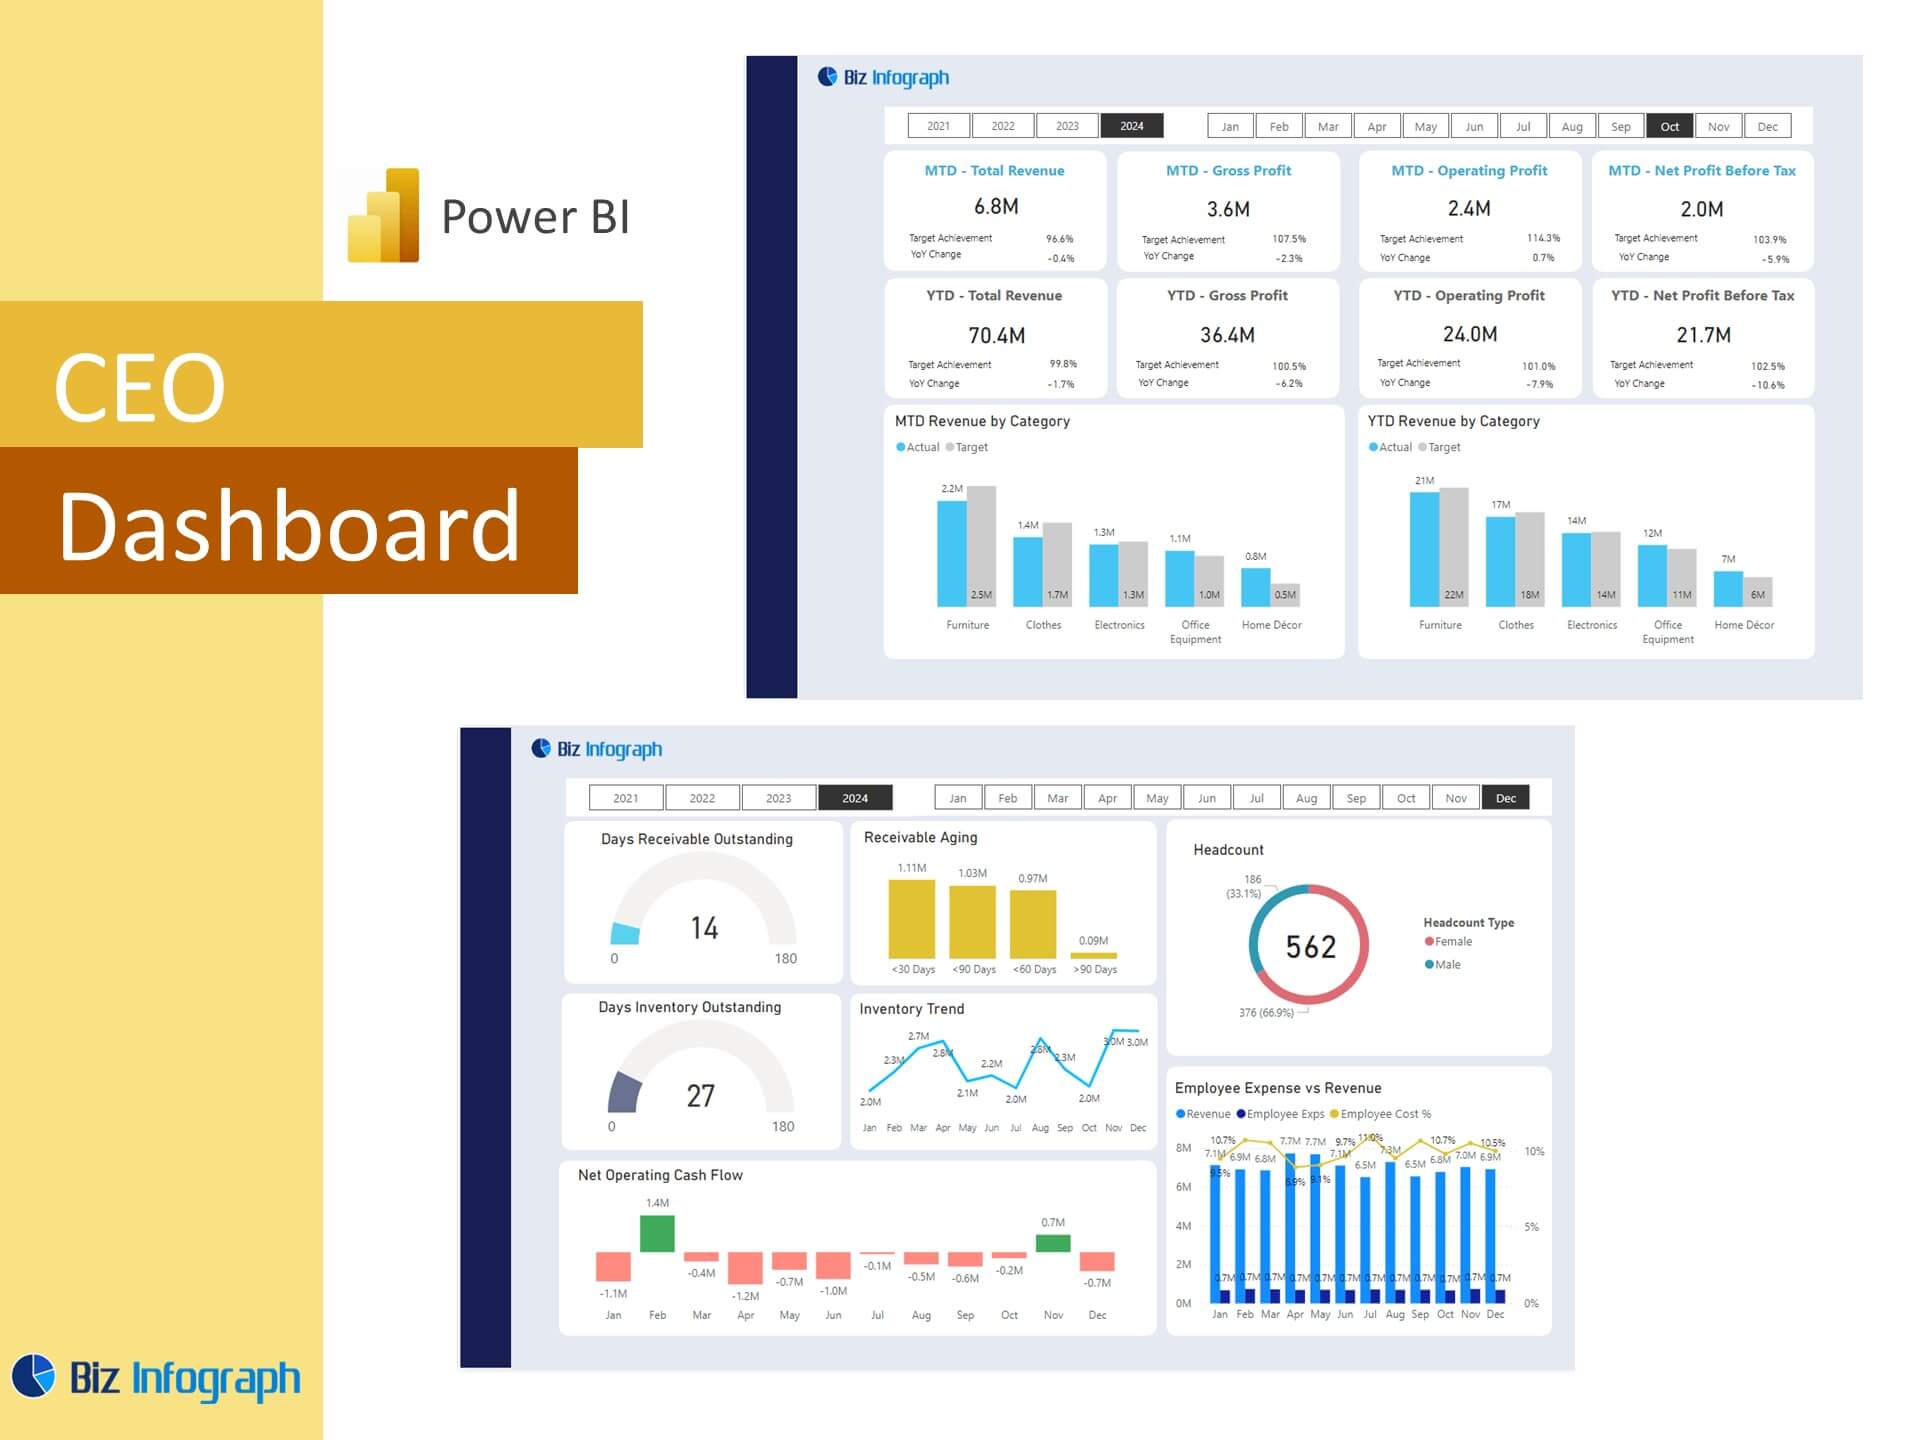
Role of Overview Dashboards and Executive Dashboards
An overview dashboard or executive dashboard presents high-level data tailored to leadership. It summarizes performance, forecasts, and progress toward quarterly goals—offering a bird’s-eye view without diving into granular metrics. Ideal for boardroom presentations, this dashboard type includes metrics like financial performance, recurring revenue, and YoY growth. The dashboard allows filtering by product line, territory, or customer segment. Executive dashboards also often incorporate visuals like overview reports, performance indicators, and callouts for high-priority KPIs. By comparing actual performance to forecasts, leadership can make informed decisions on strategy and investment with confidence.
Designing with Power BI Dashboard Templates
Choosing the Right Power BI Template for Sales
The right Power BI dashboard template depends on your business goals, data maturity, and use cases. Whether you need a high-level sales overview or a drill-down analysis dashboard, choosing the right starting point ensures meaningful insights. Sales dashboard templates with built-in filters and cards are ideal for day-to-day reporting. Specialized templates like google ads dashboards, logistics dashboards, analytics dashboard, or finance dashboards help bring in data from vertical-specific sources. Power BI offers these through its online gallery or as part of consulting packages. Selecting from templates in 2025 ensures compatibility with the latest Power BI dashboard features and capabilities.
Customization Options in Power BI Dashboard Templates
Templates serve as a launchpad—but customization is where the real power lies. You can adapt a Power BI sales dashboard to fit your sales cycle by modifying KPIs, updating data connections, or changing visual styles. For example, you might incorporate customer satisfaction scores, spend analysis dashboards, or additional visualizations for customer analysis dashboards. These changes align the dashboard more closely with departmental goals. With features like drag-and-drop editing, conditional formatting, and real-time filtering, Power BI provides an intuitive interface that’s accessible to both data analysts and business users. This flexibility is why Power BI stands out among top Power BI platforms.
How to Use Templates for Marketing, Finance, and HR Dashboards
Sales dashboards can be extended for multi-department use. Marketing teams might leverage a Facebook ads dashboard or SEO dashboard to evaluate campaign impact. Finance departments use templates like the finance dashboard to track margins and net income, while HR teams benefit from HR dashboards that include retention and hiring KPIs. The beauty of Power BI is its ability to serve as a unified platform across departments. BI reporting templates connect shared KPIs, such as budget alignment or conversion metrics. This cross-functional usage supports cohesive planning and enables project management across the organization.
Examples and Use Cases of Sales Dashboards
Best Power BI Dashboard Examples for Sales Analysis
Some of the best Power BI dashboard examples include industry-specific dashboards for retail, SaaS, and services. These may feature detailed visuals on sales performance, segmentation, and campaign ROI. For example, a sales analysis dashboard for a SaaS company might show recurring revenue, CAC, LTV, and churn alongside quarterly trends. Another example might integrate data from Google Ads to correlate traffic with revenue spikes. The dashboard is designed to help sales and marketing leaders act on real-time feedback. Studying these examples of Power BI dashboards can provide inspiration for tailoring your own.
Sales Dashboard Templates vs. Manual Data Exports
Manual reporting is not only time-consuming but error-prone. Sales dashboard templates built in Power BI eliminate the need for constant manual data exports. These dashboards automatically refresh with new inputs from live data connectors and cloud-based data sources. Unlike spreadsheets, they maintain version control, reduce duplication, and allow multi-user access. This upgrade from traditional methods enhances agility, reduces risk, and enables faster reporting cycles—empowering sales professionals to respond to trends and challenges instantly.
Cross-Functional Use Cases: Customer Analysis, Marketing Campaigns, and More
Dashboards are no longer limited to a single function. A customer analysis dashboard might connect NPS with product usage, while a marketing campaign dashboard could link budget with conversion rates and ROI. These tools enable a holistic view of operations, helping organizations evaluate customer journeys, optimize advertising spend, and forecast demand more accurately. Templates like the ads dashboard template can be quickly adapted to track multi-channel performance across platforms. Whether used by operations, marketing, or sales, these tools offer a centralized approach to data visualization and analysis.
Reporting and Insights from Power BI Dashboards
Creating Effective Power BI Reports from Dashboard Data
An effective Power BI report distills key findings into digestible visuals that are easy to interpret and share. These reports should highlight critical metrics like sales performance, funnel movement, and geographic trends. You can create paginated reports or use bookmarks and tooltips to build interactive, self-service experiences. The reports can then be published to the Power BI service for access across devices and stakeholders. These dynamic reports promote better collaboration and provide a reliable source of truth for decision-making.
Insights Dashboards for Recurring Revenue and Customer Satisfaction
Insights dashboards focused on recurring revenue help subscription-based businesses understand growth drivers, retention issues, and customer lifetime value. Incorporating customer satisfaction scores, churn risk indicators, and contract renewal status, these dashboards become predictive tools rather than just historical summaries. Tracking such insights helps sales teams identify at-risk clients, upsell opportunities, and deliver proactive account management. These dashboards directly support long-term financial performance and sustainable growth strategies.
Leveraging the Power BI Service for Automated Analysis Reports
The Power BI service allows users to schedule data refreshes, automate report distribution, and enable real-time collaboration. Teams can set alerts for thresholds, share insights via Microsoft Teams, and access dashboards through mobile apps. Reports built on dashboard templates can also include embedded overview reports and drill-down analysis. By moving reporting into the cloud, Power BI simplifies version control, boosts security, and facilitates faster feedback loops—especially vital for globally distributed teams.
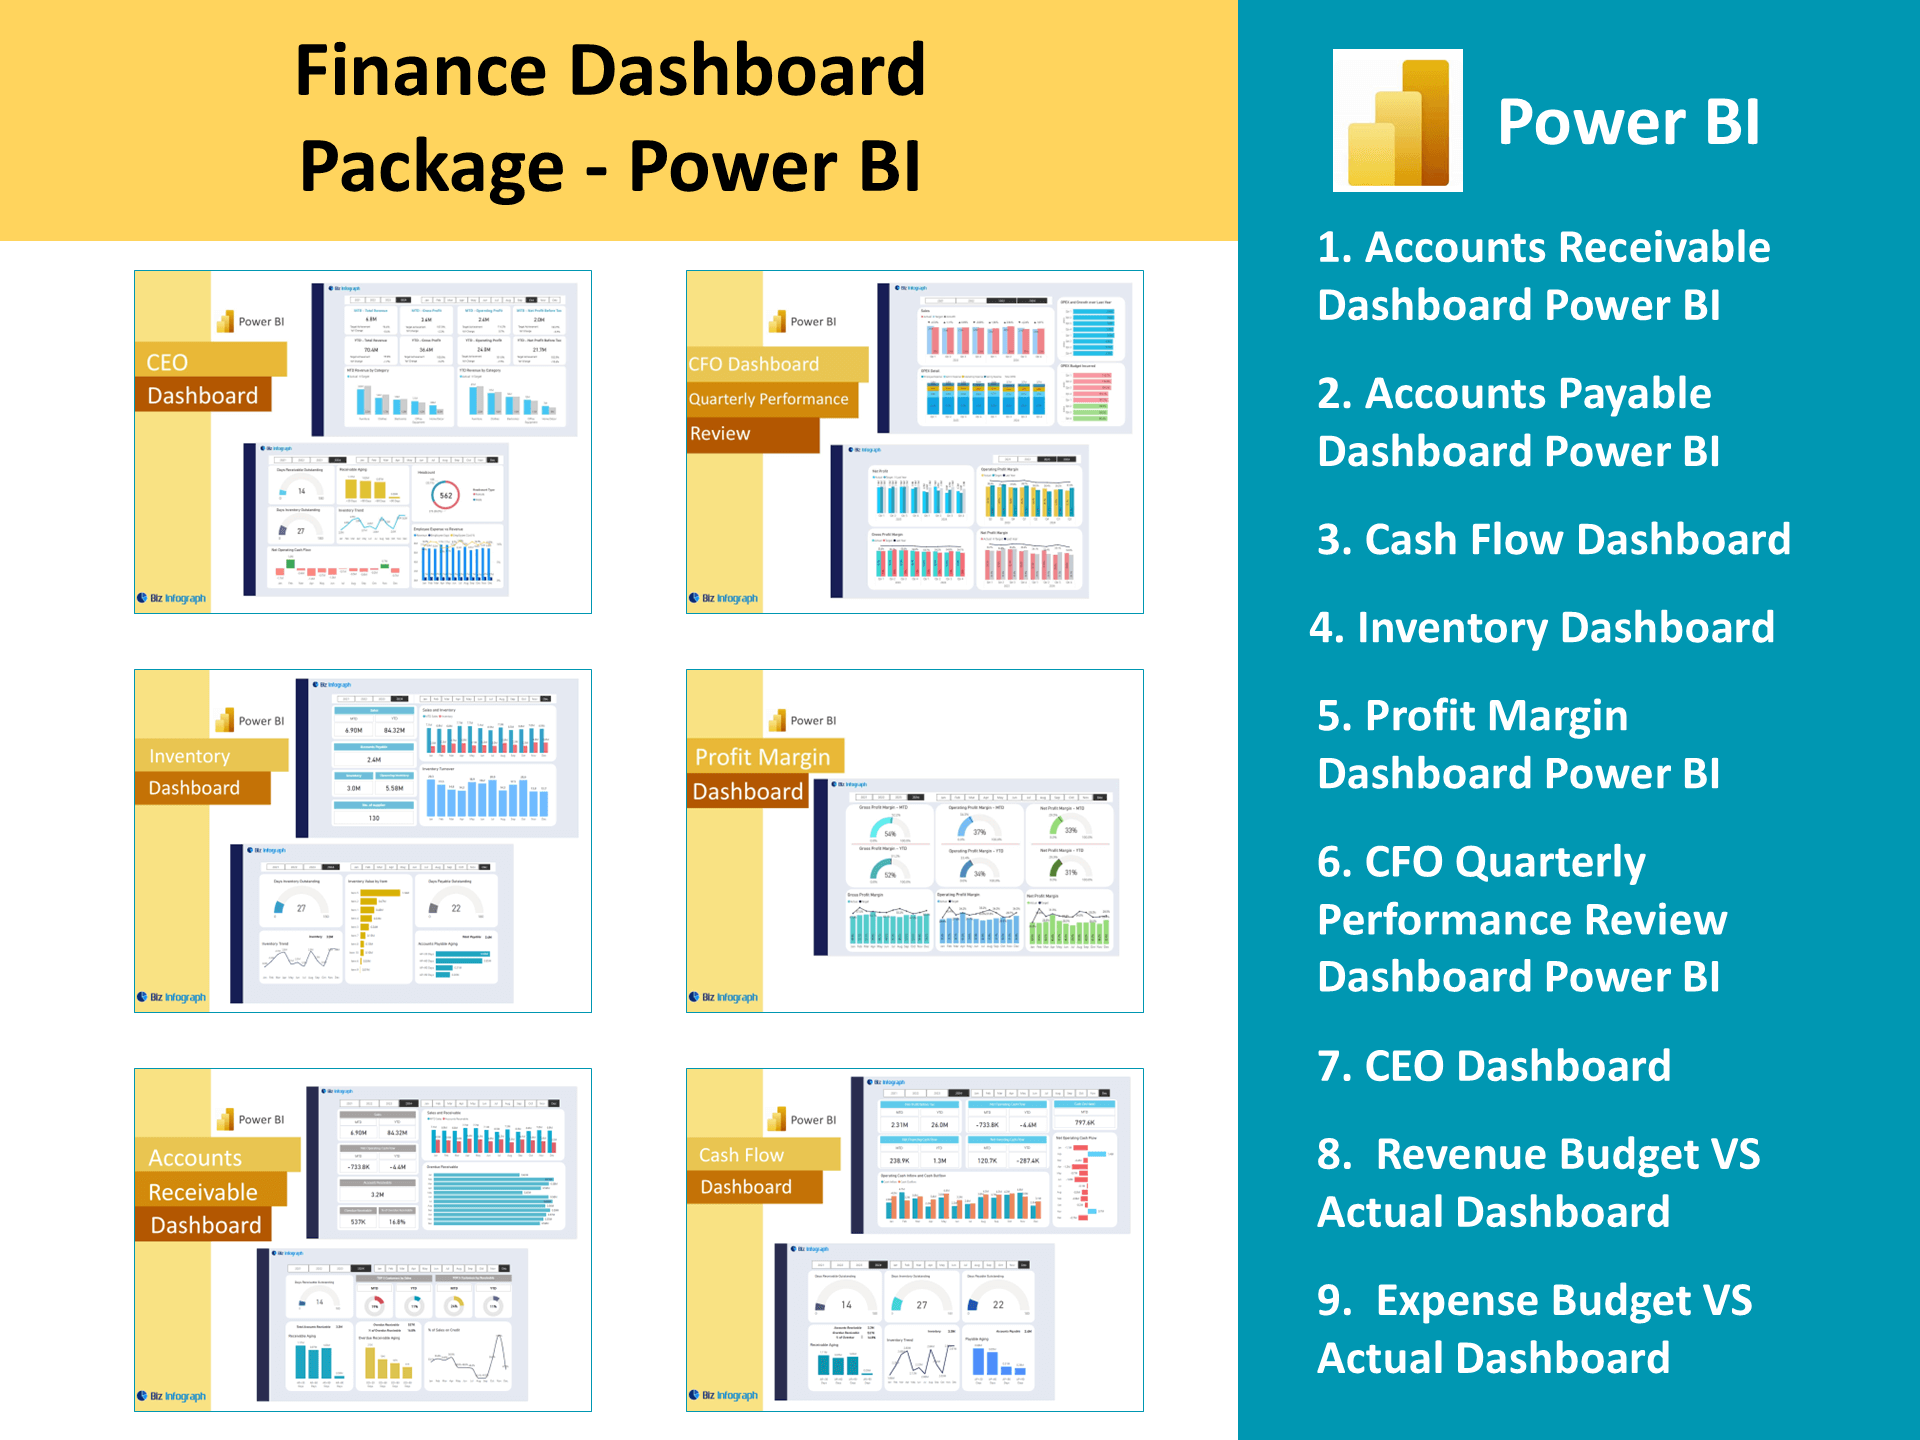
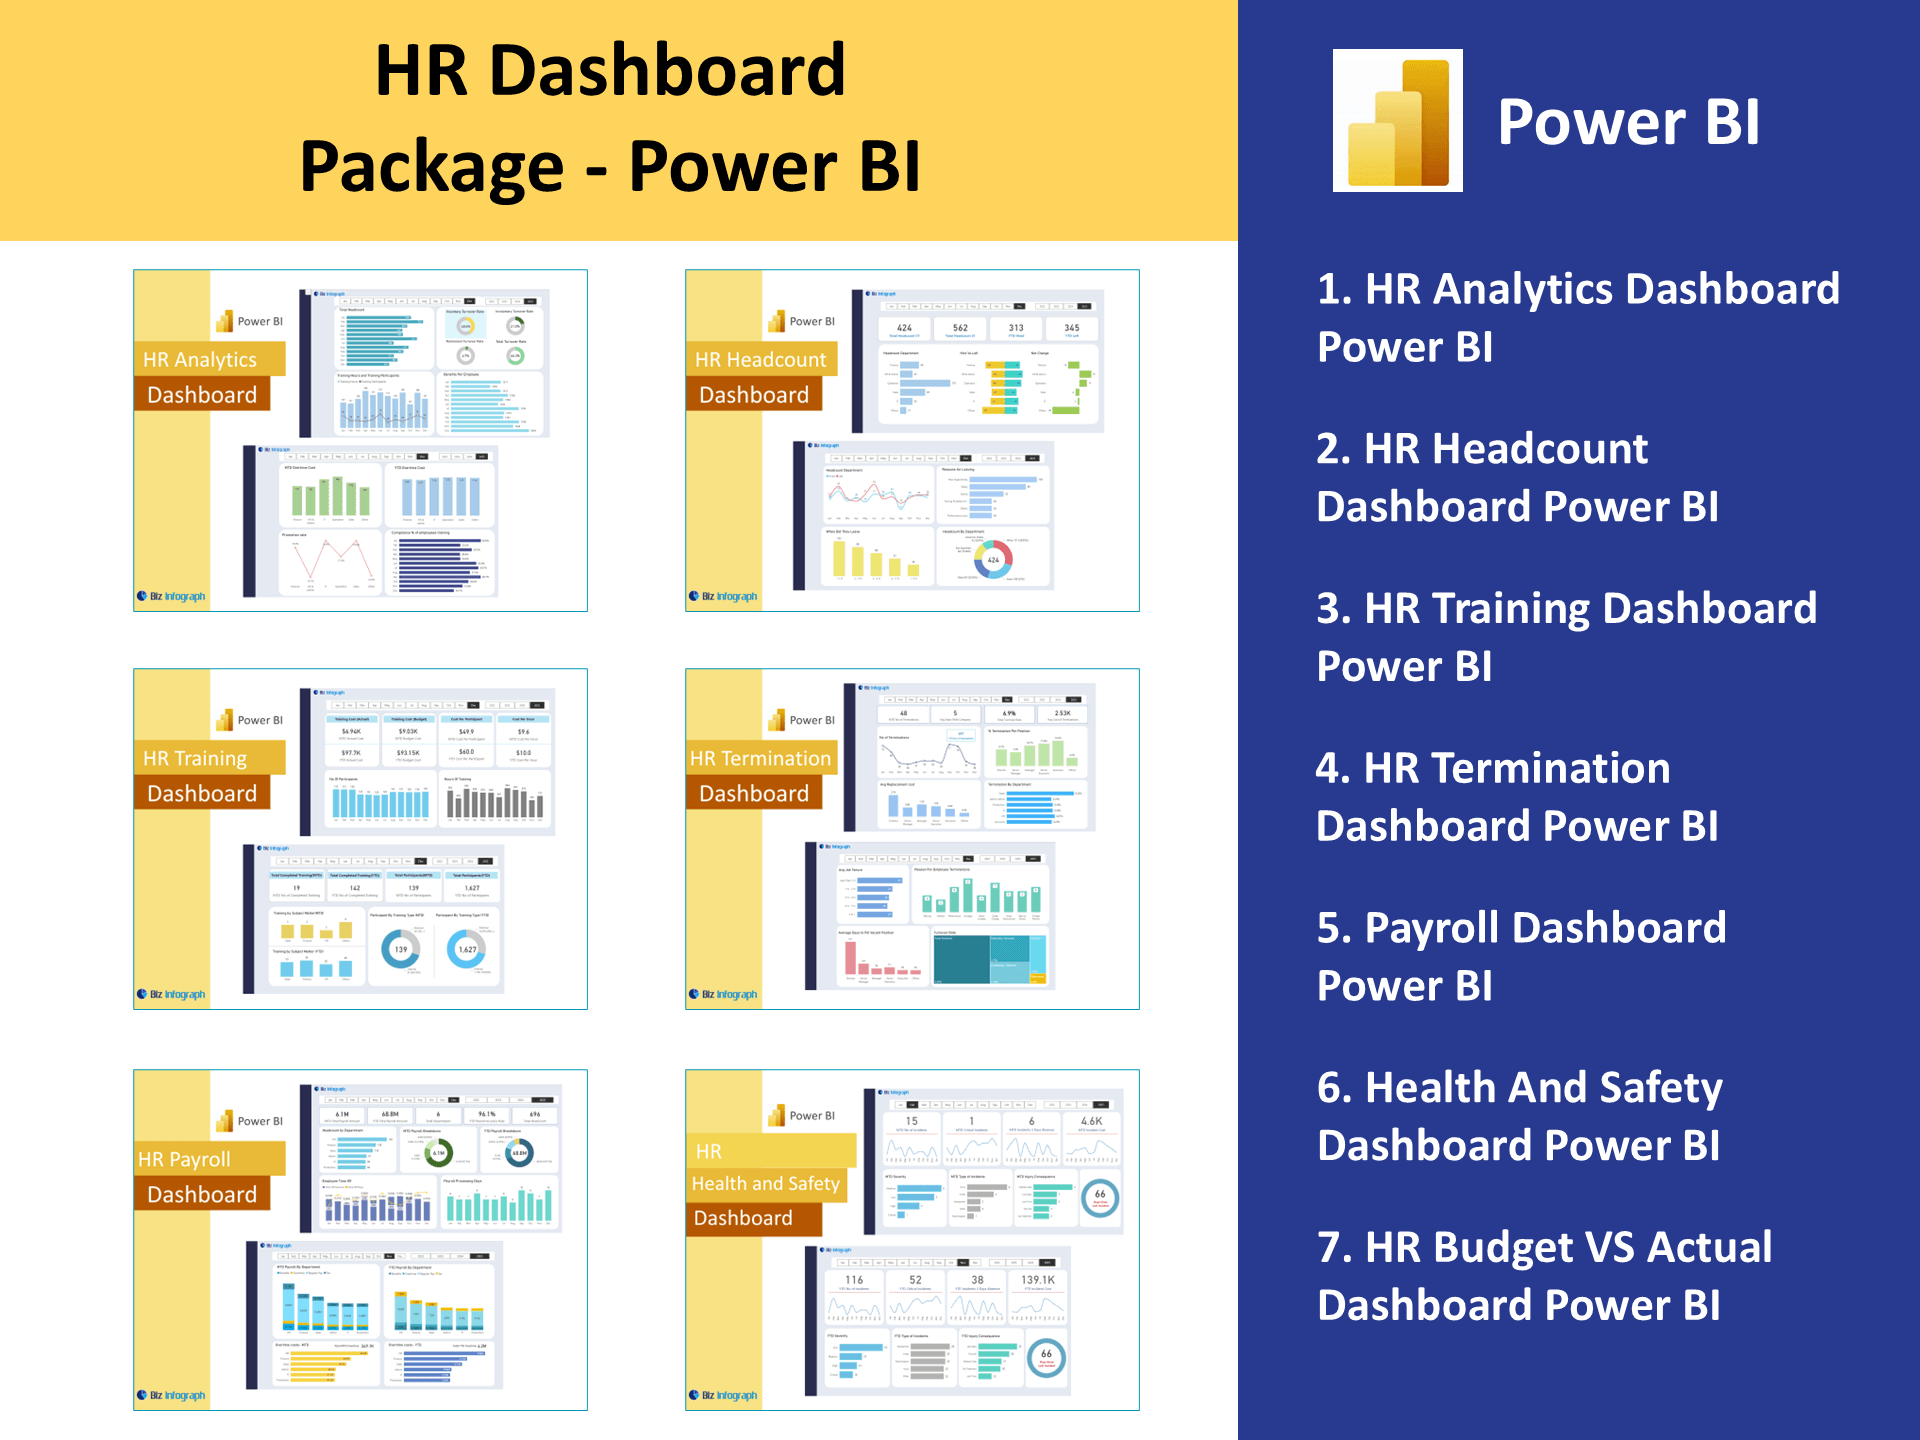
For ready-to-use Dashboard Templates:
- Financial Dashboards
- Sales Dashboards
- HR Dashboards
- Data Visualization Charts
- Power BI – Biz Infograph
- Automation – Biz Infograph