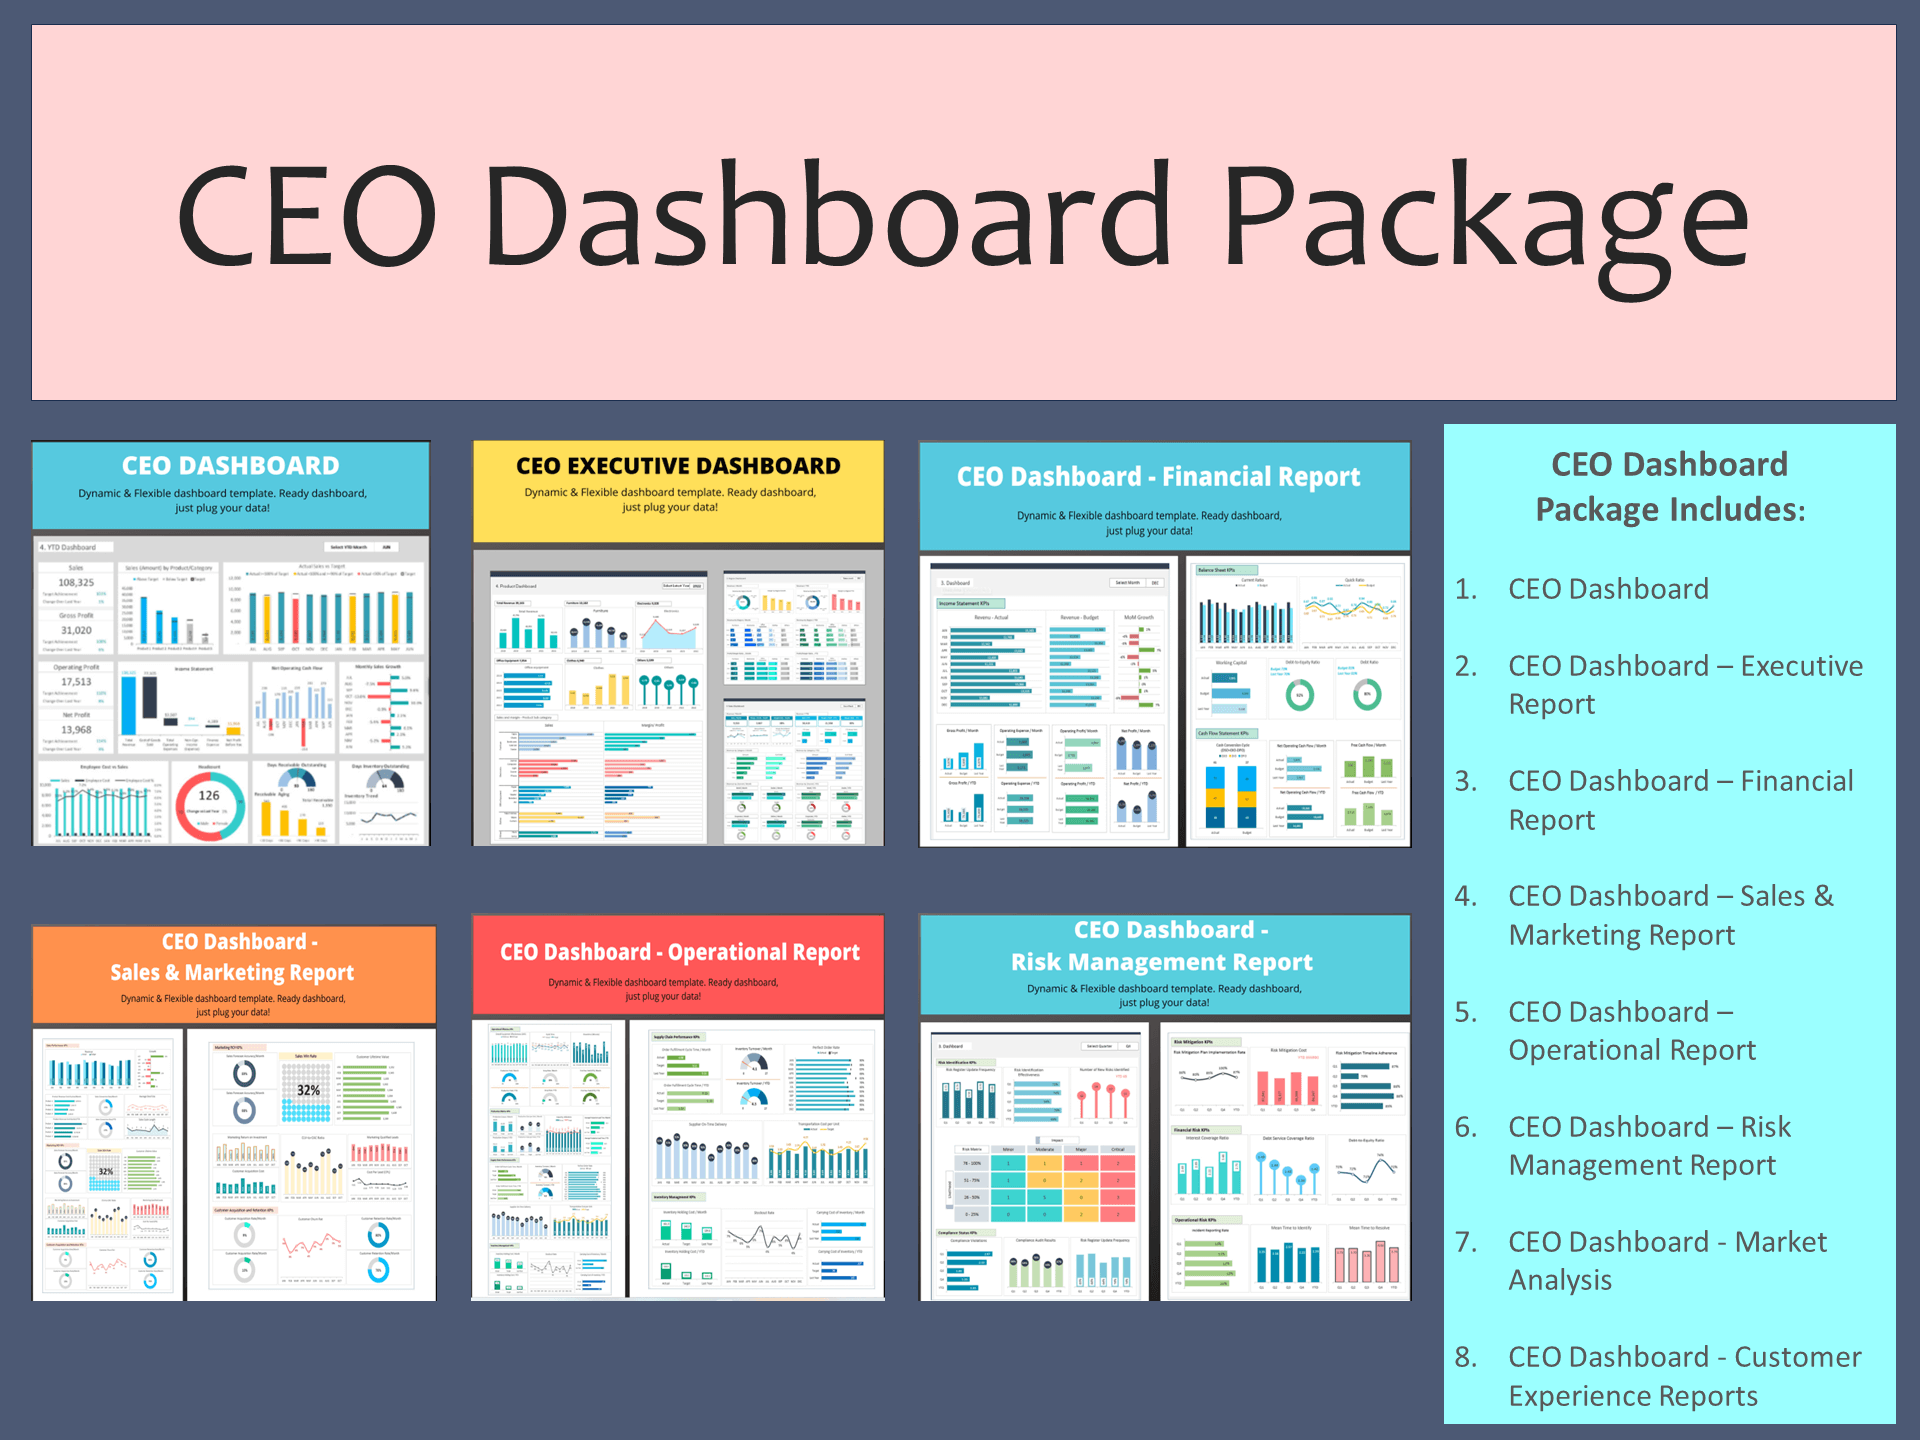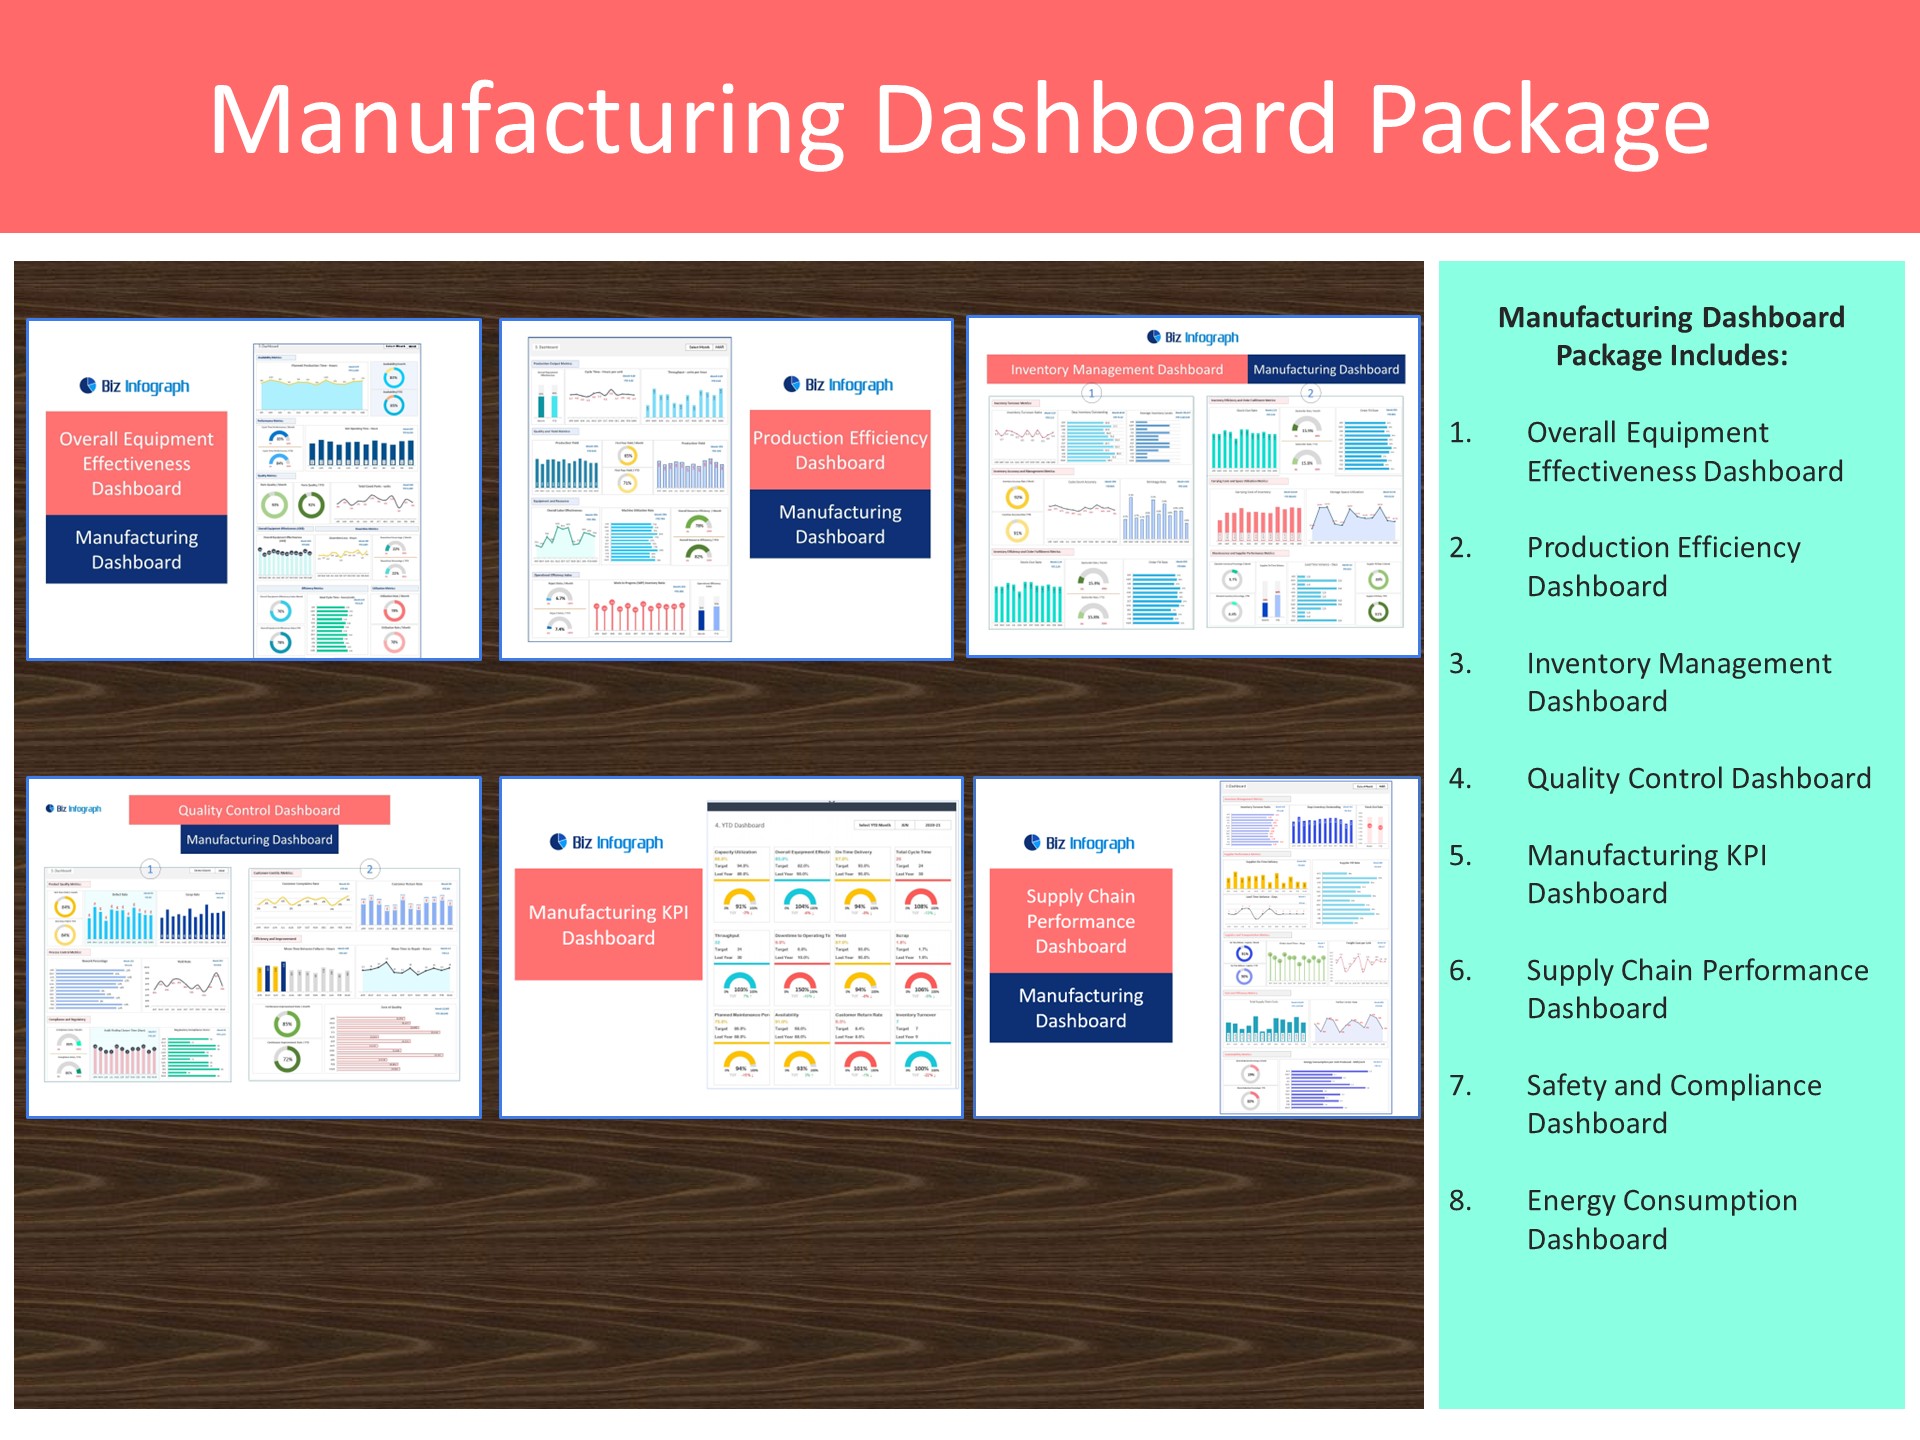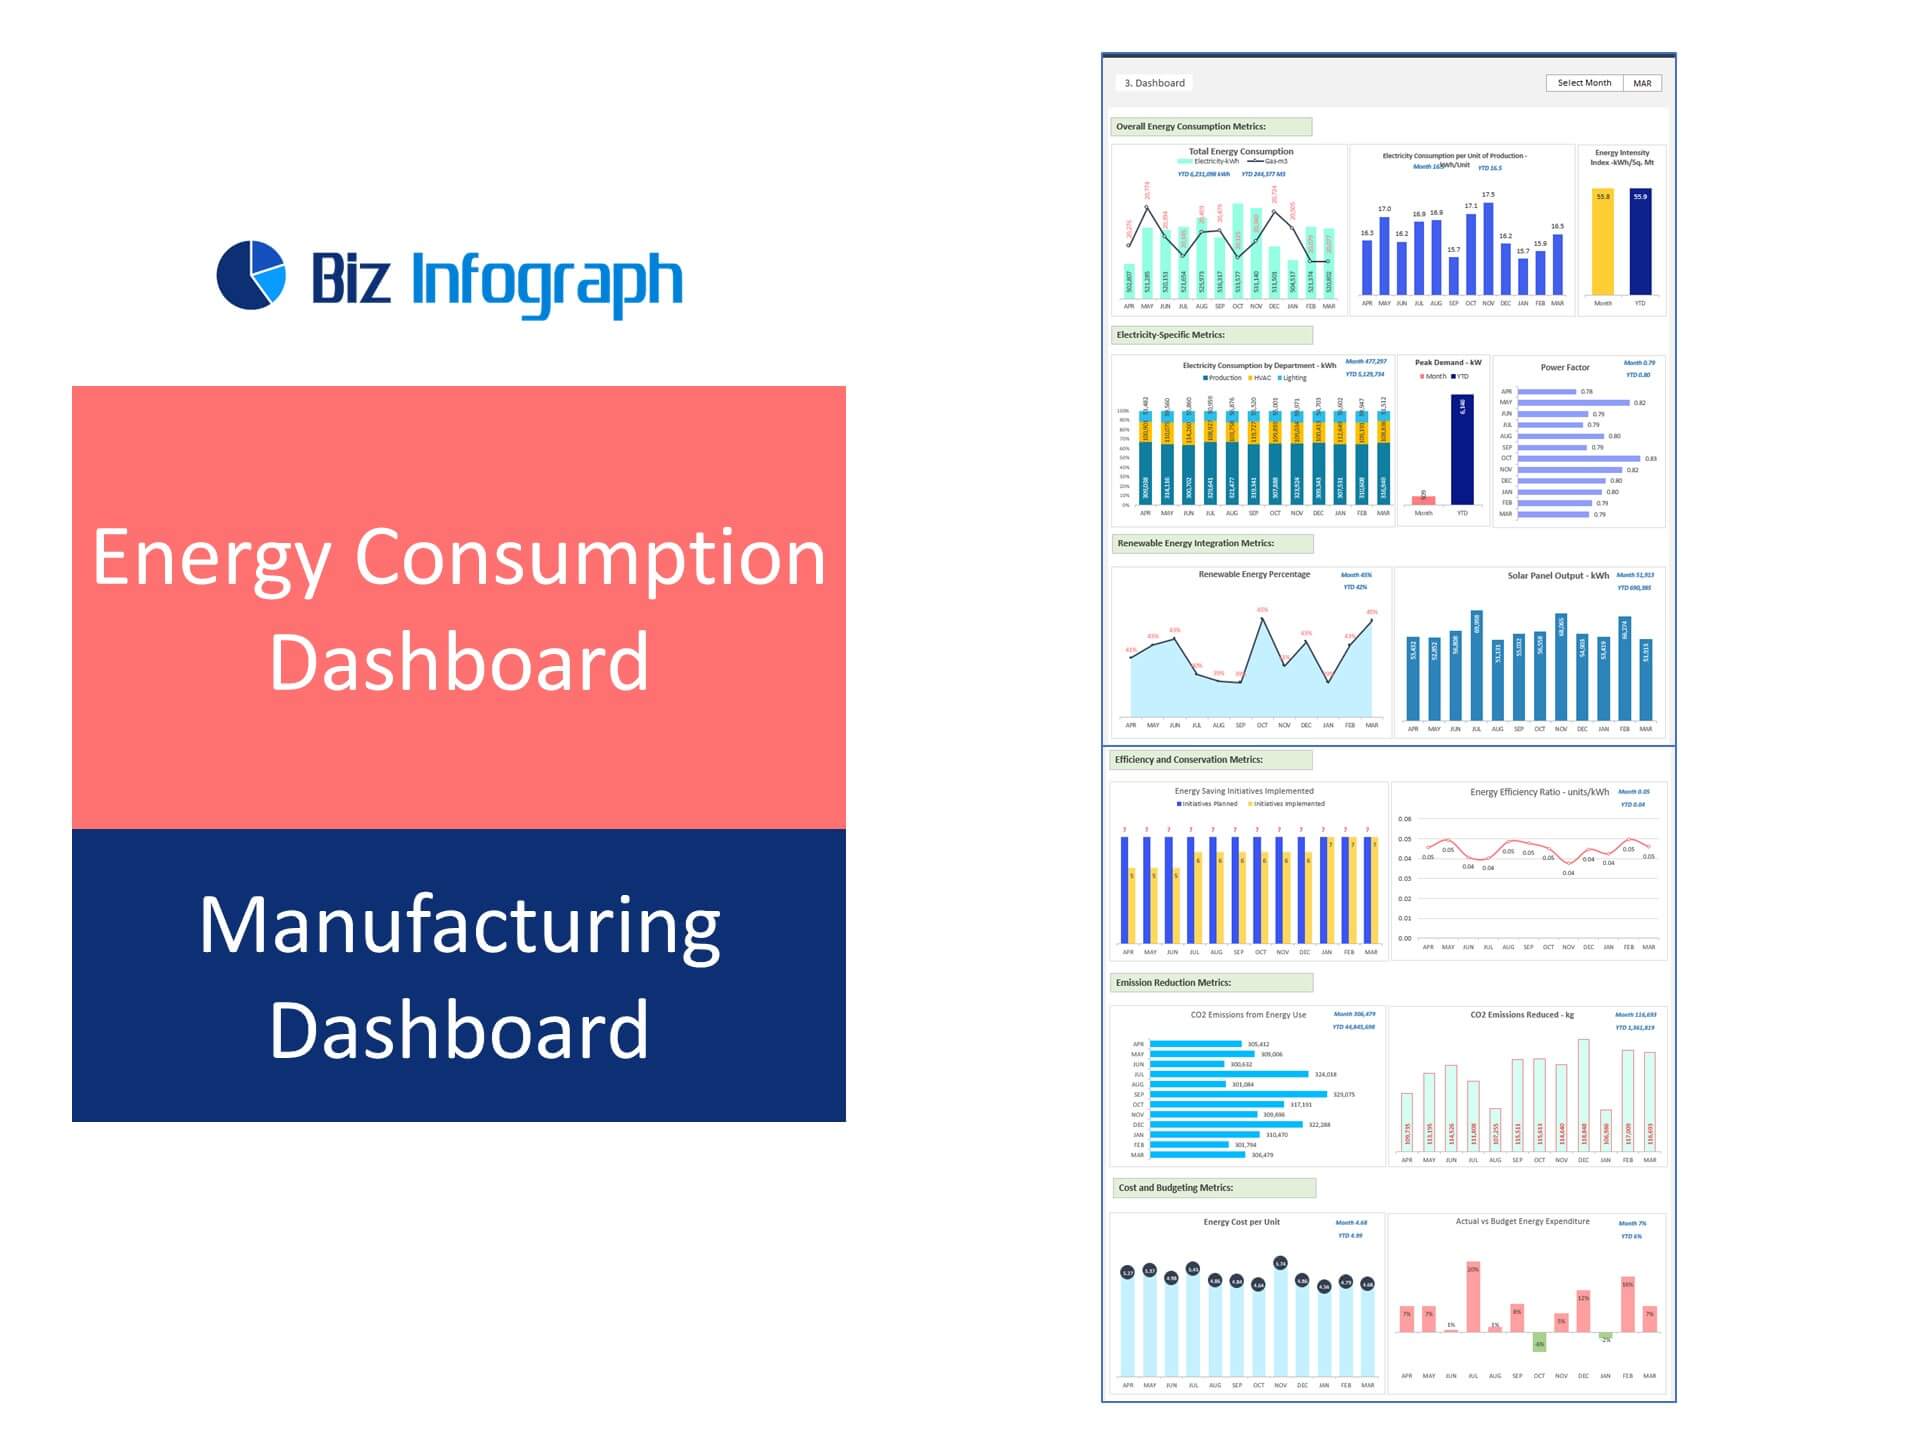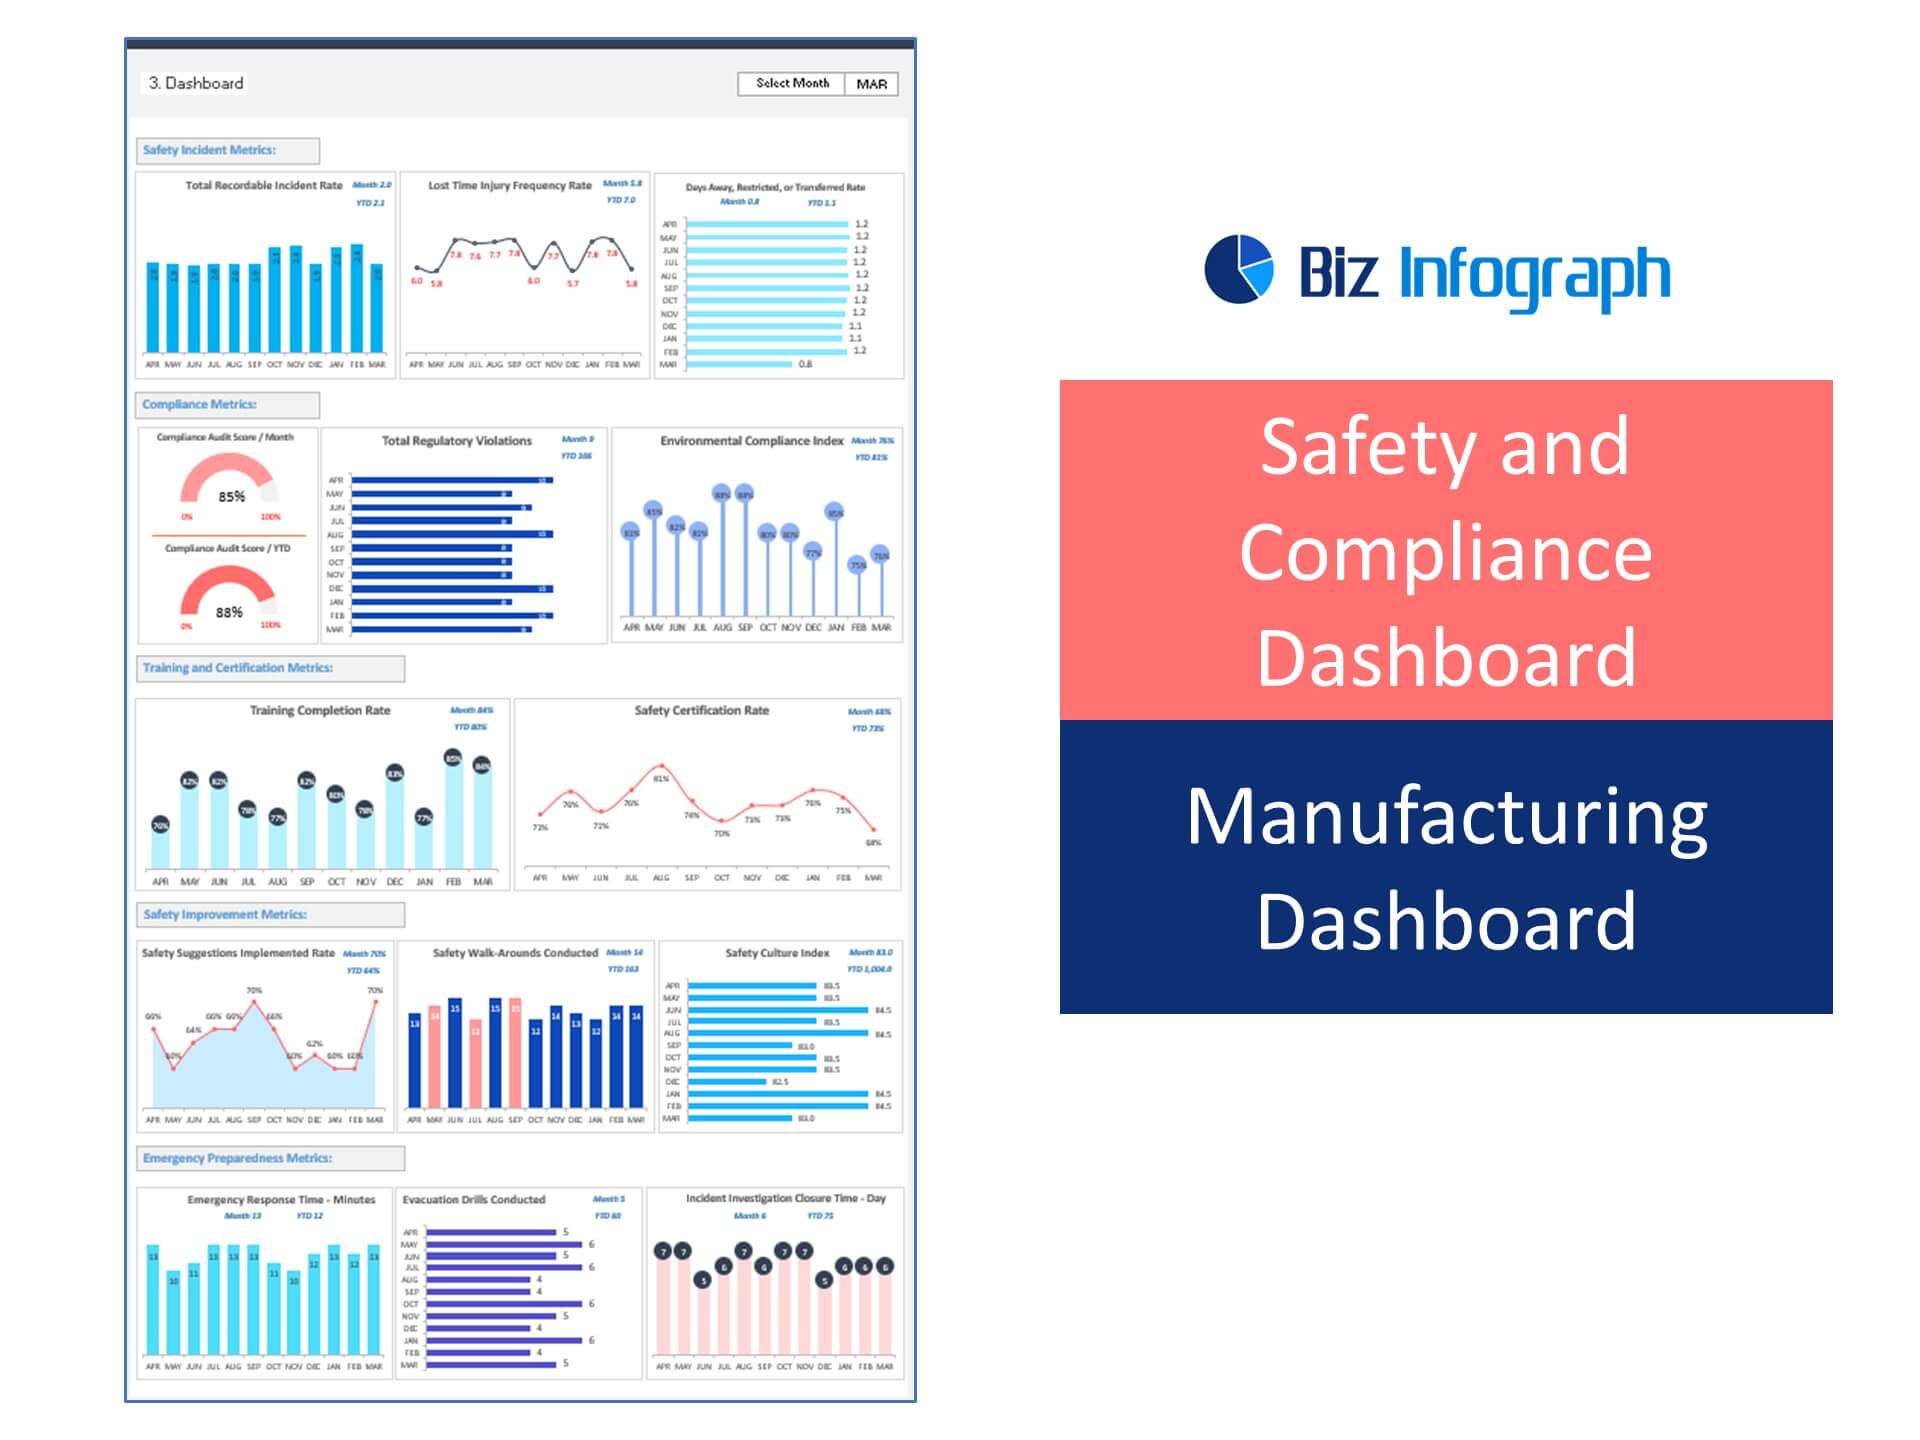
Manufacturing KPI Dashboard Excel Template is designed to track the 12 most important Key Performance Indicators for manufacturing operations. This Excel spreadsheet helps you to maximize your data by organizing and comparing all in one place. Easily interpretable 3-color graphics stand out in professional presentations and make reporting more effective.
Manufacturing KPI dashboard template Excel helps to enhance the analytical efforts related to major HR aspects of your organization. Major metrics covered in the Manufacturing KPI dashboard are:
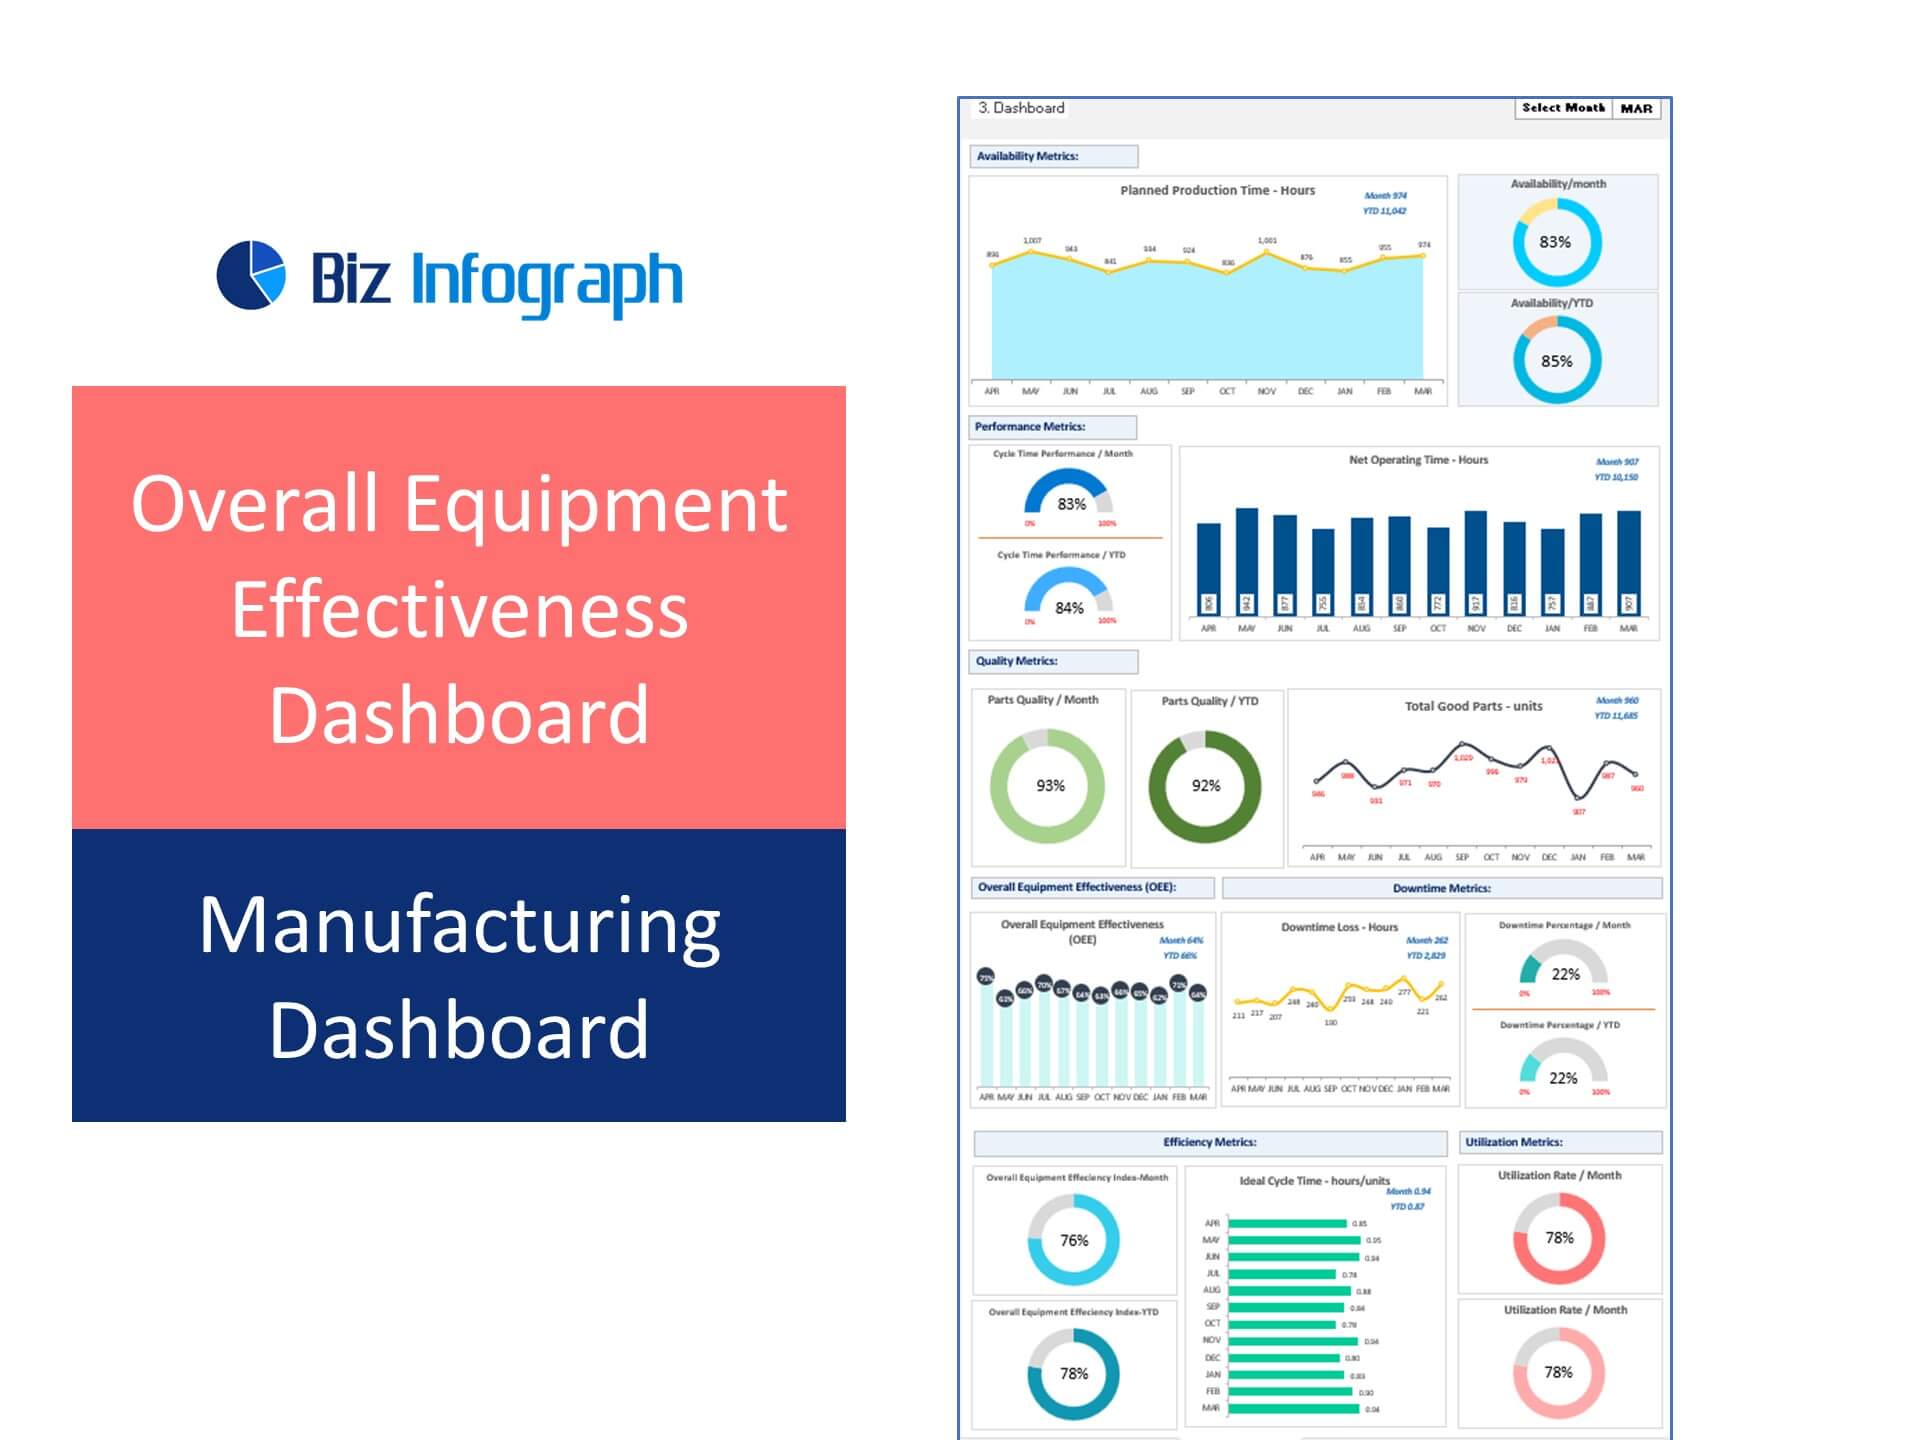
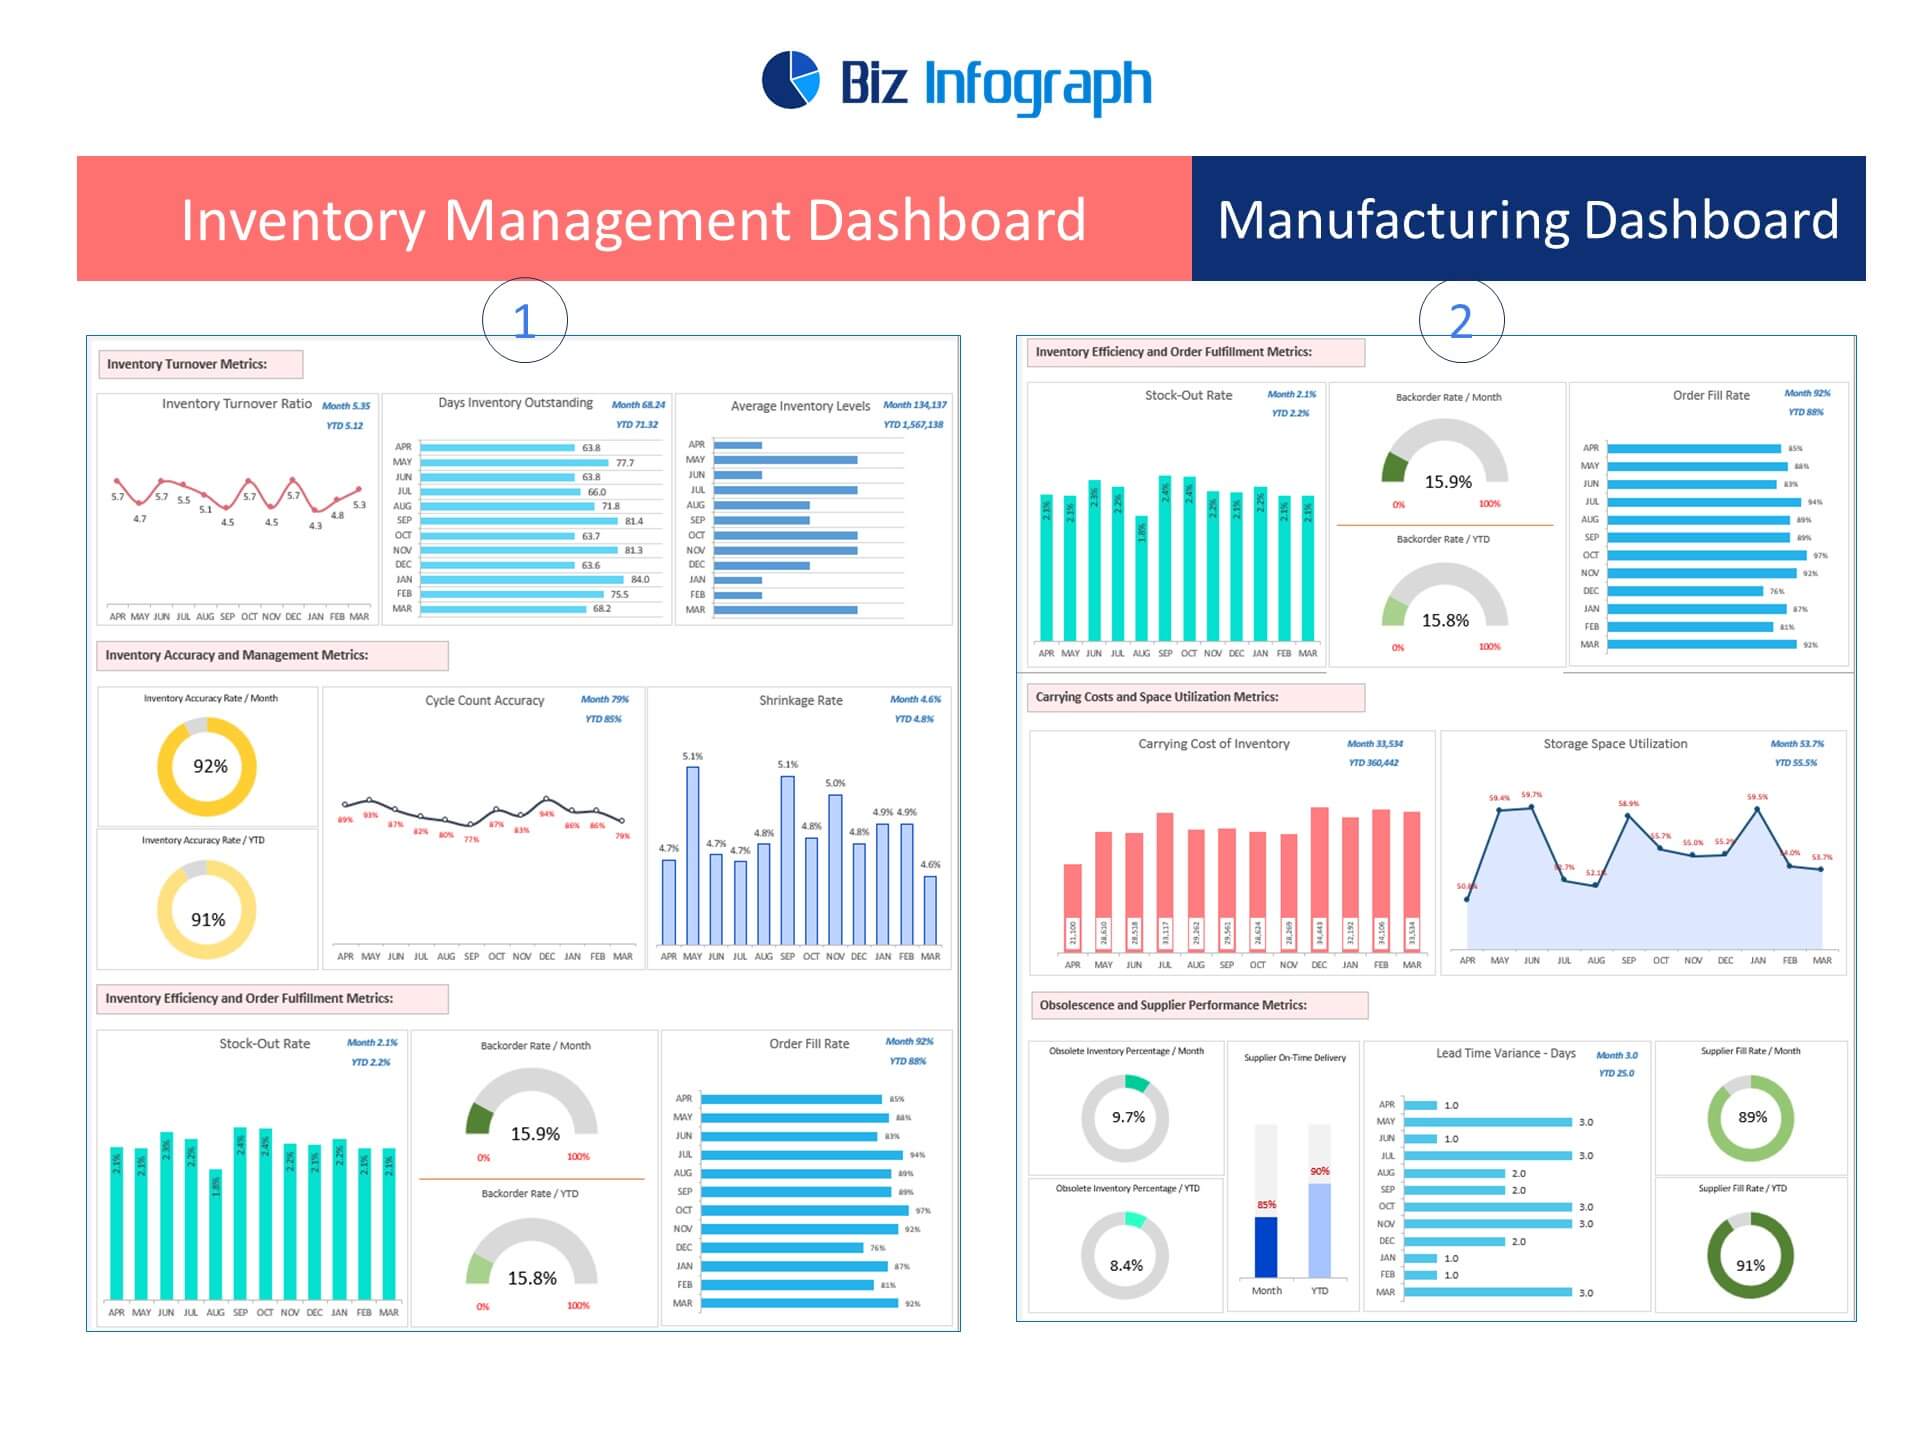
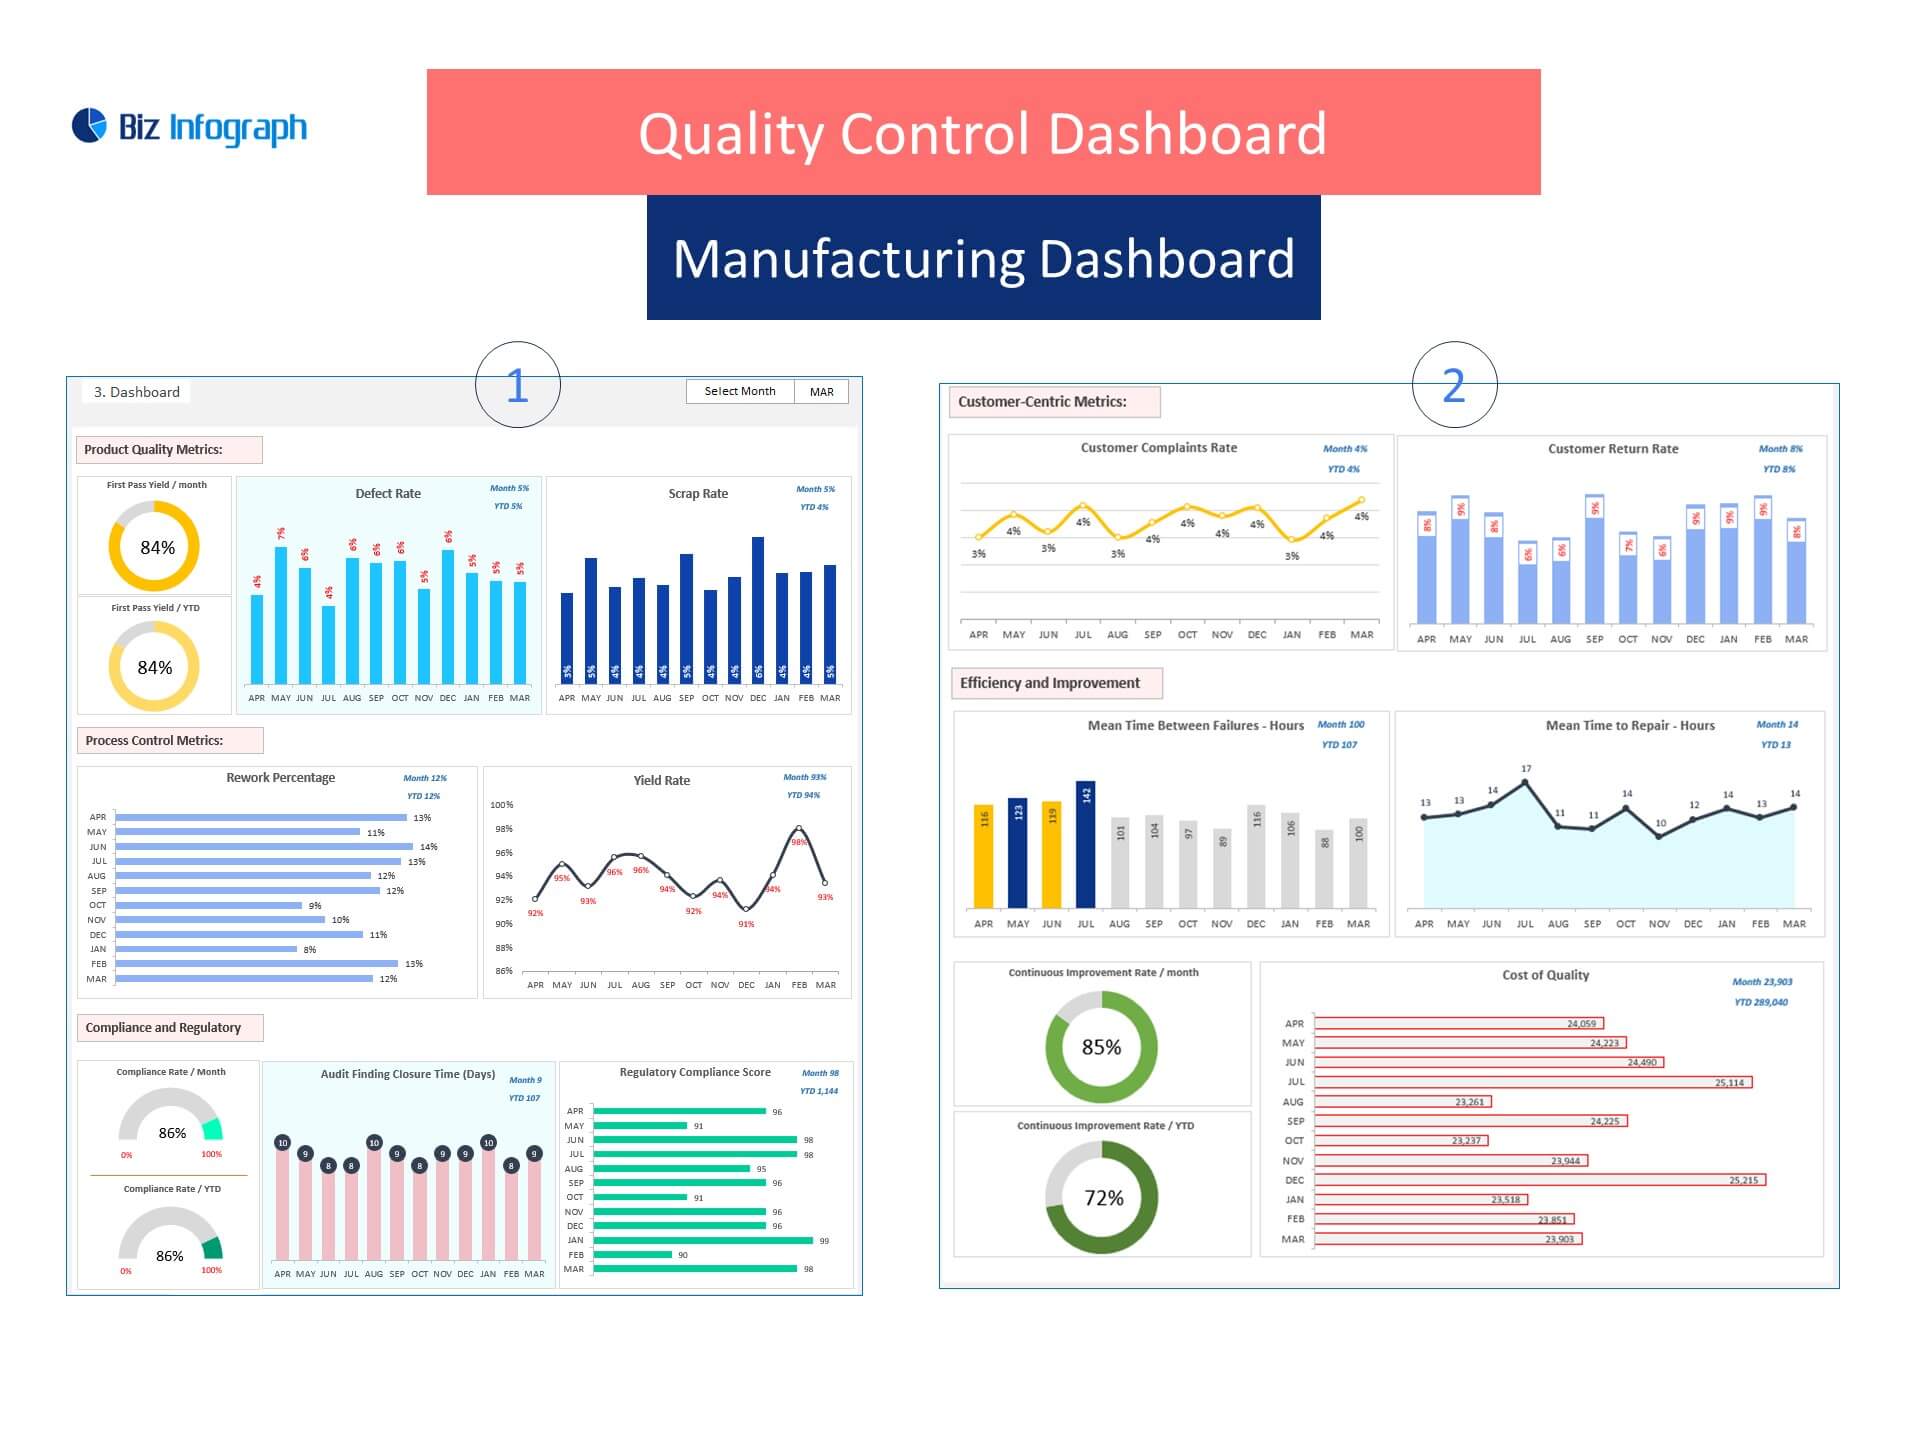
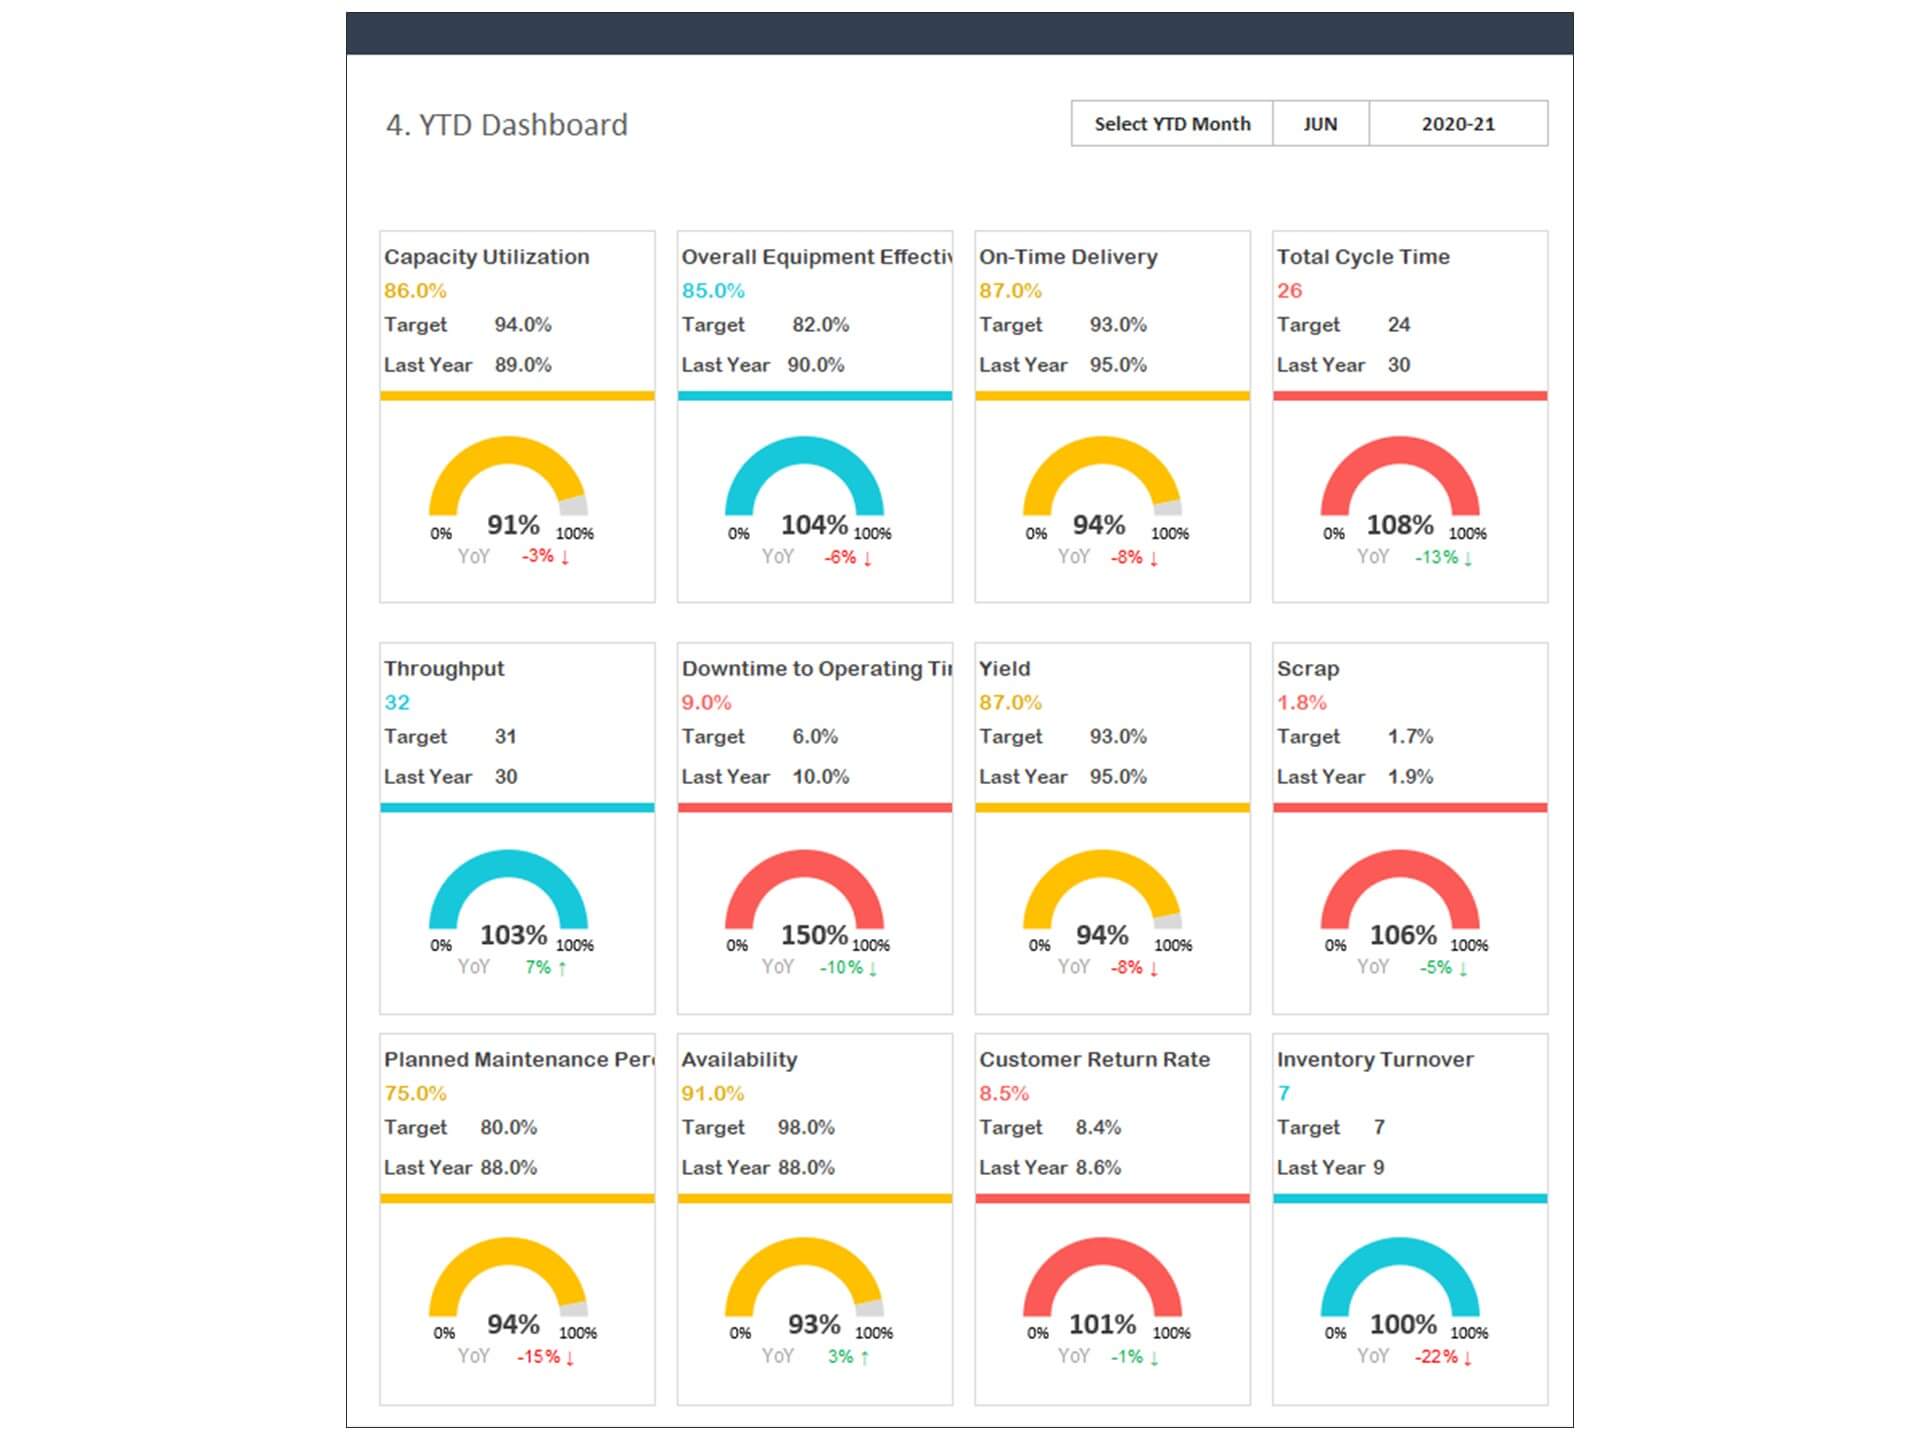
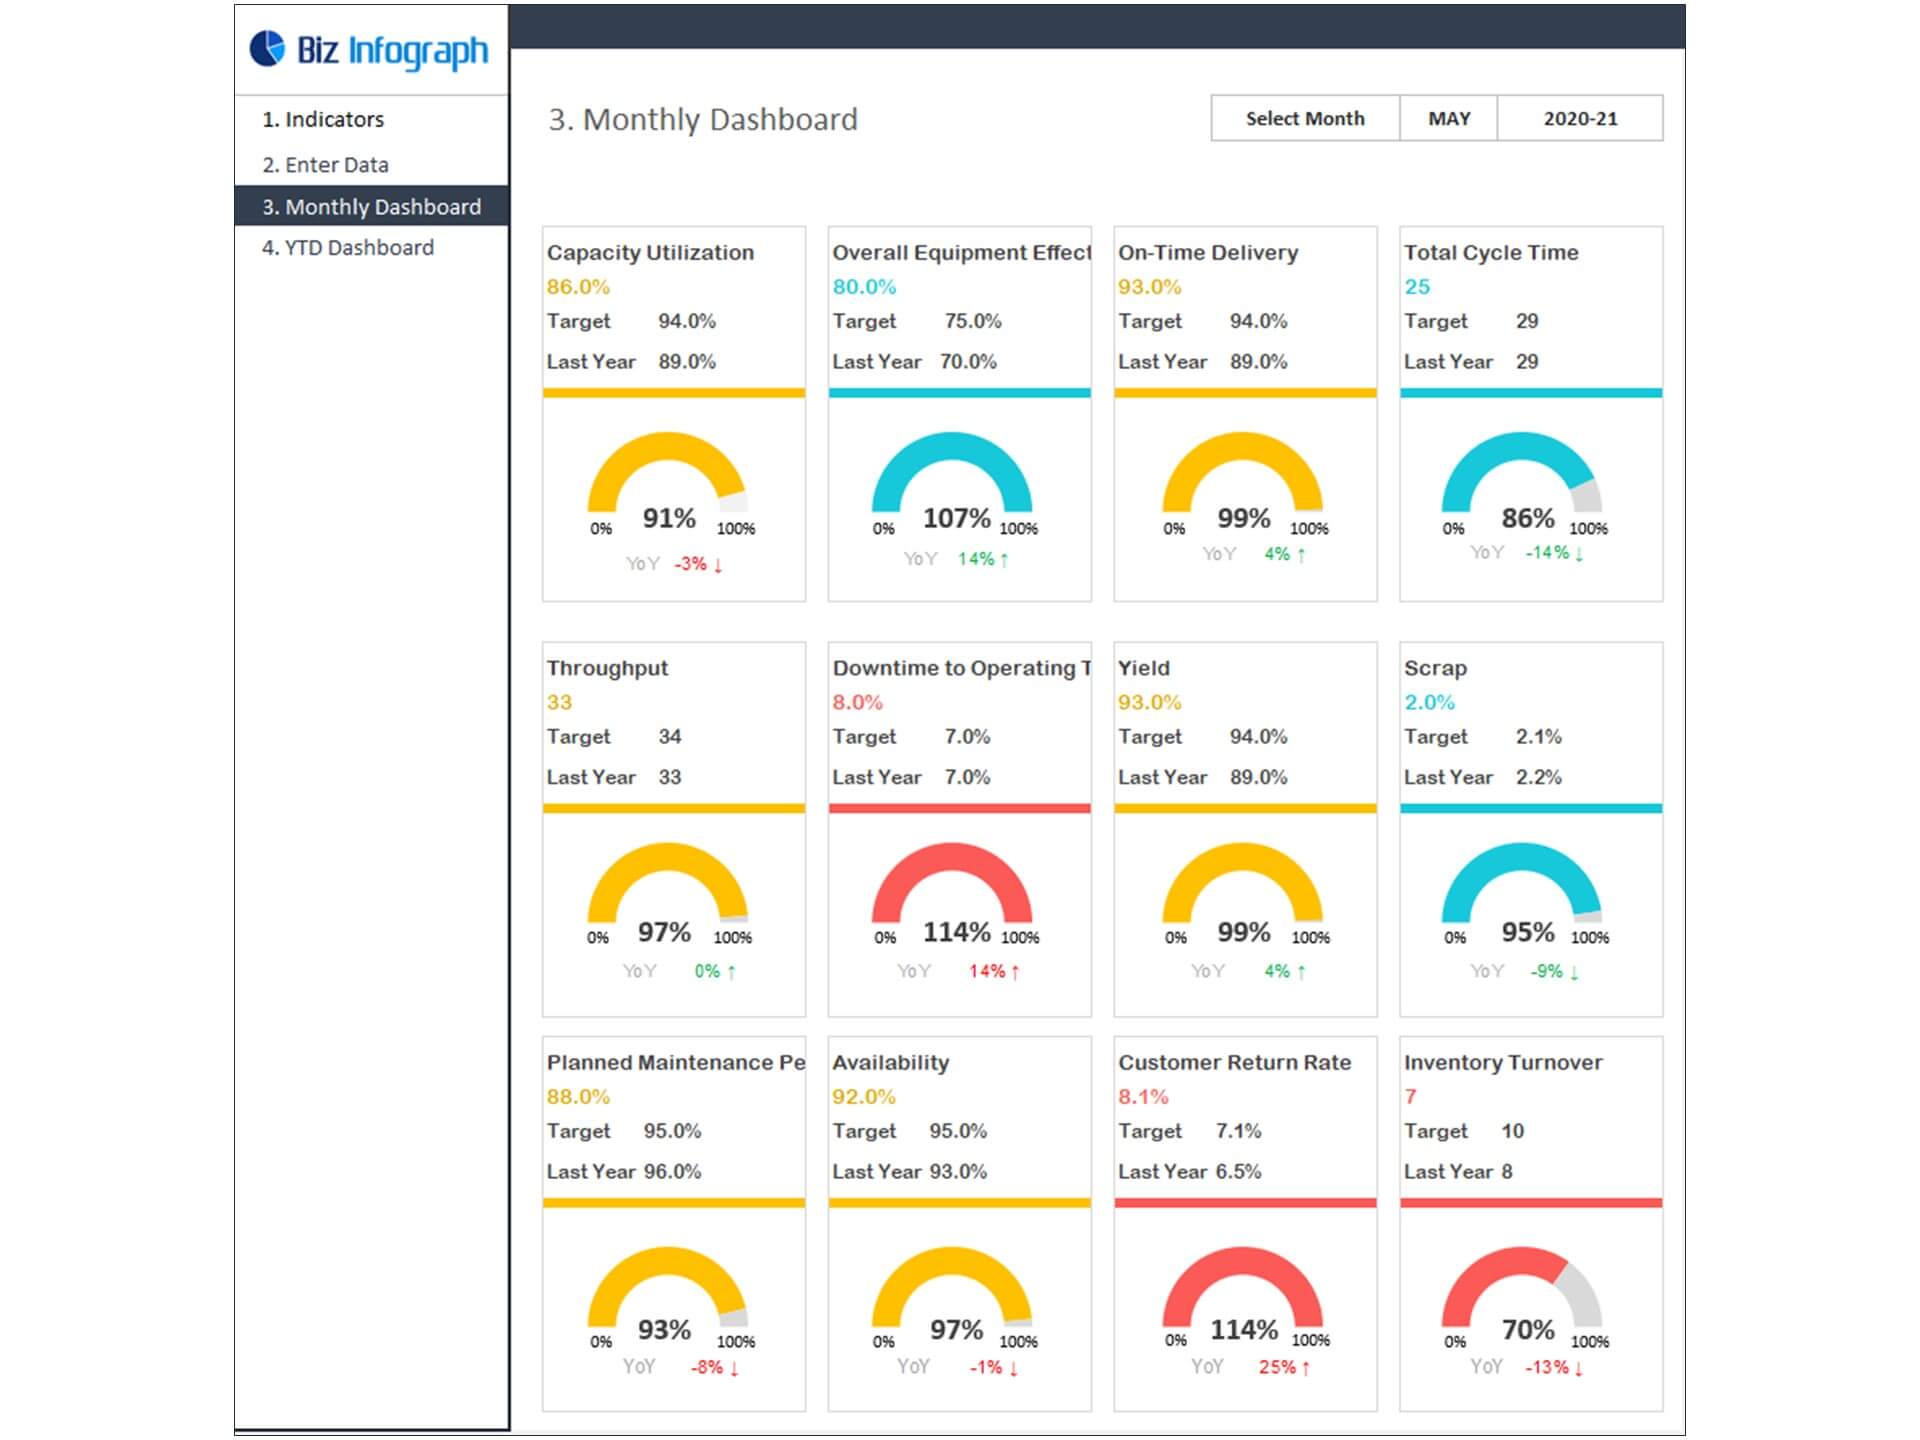
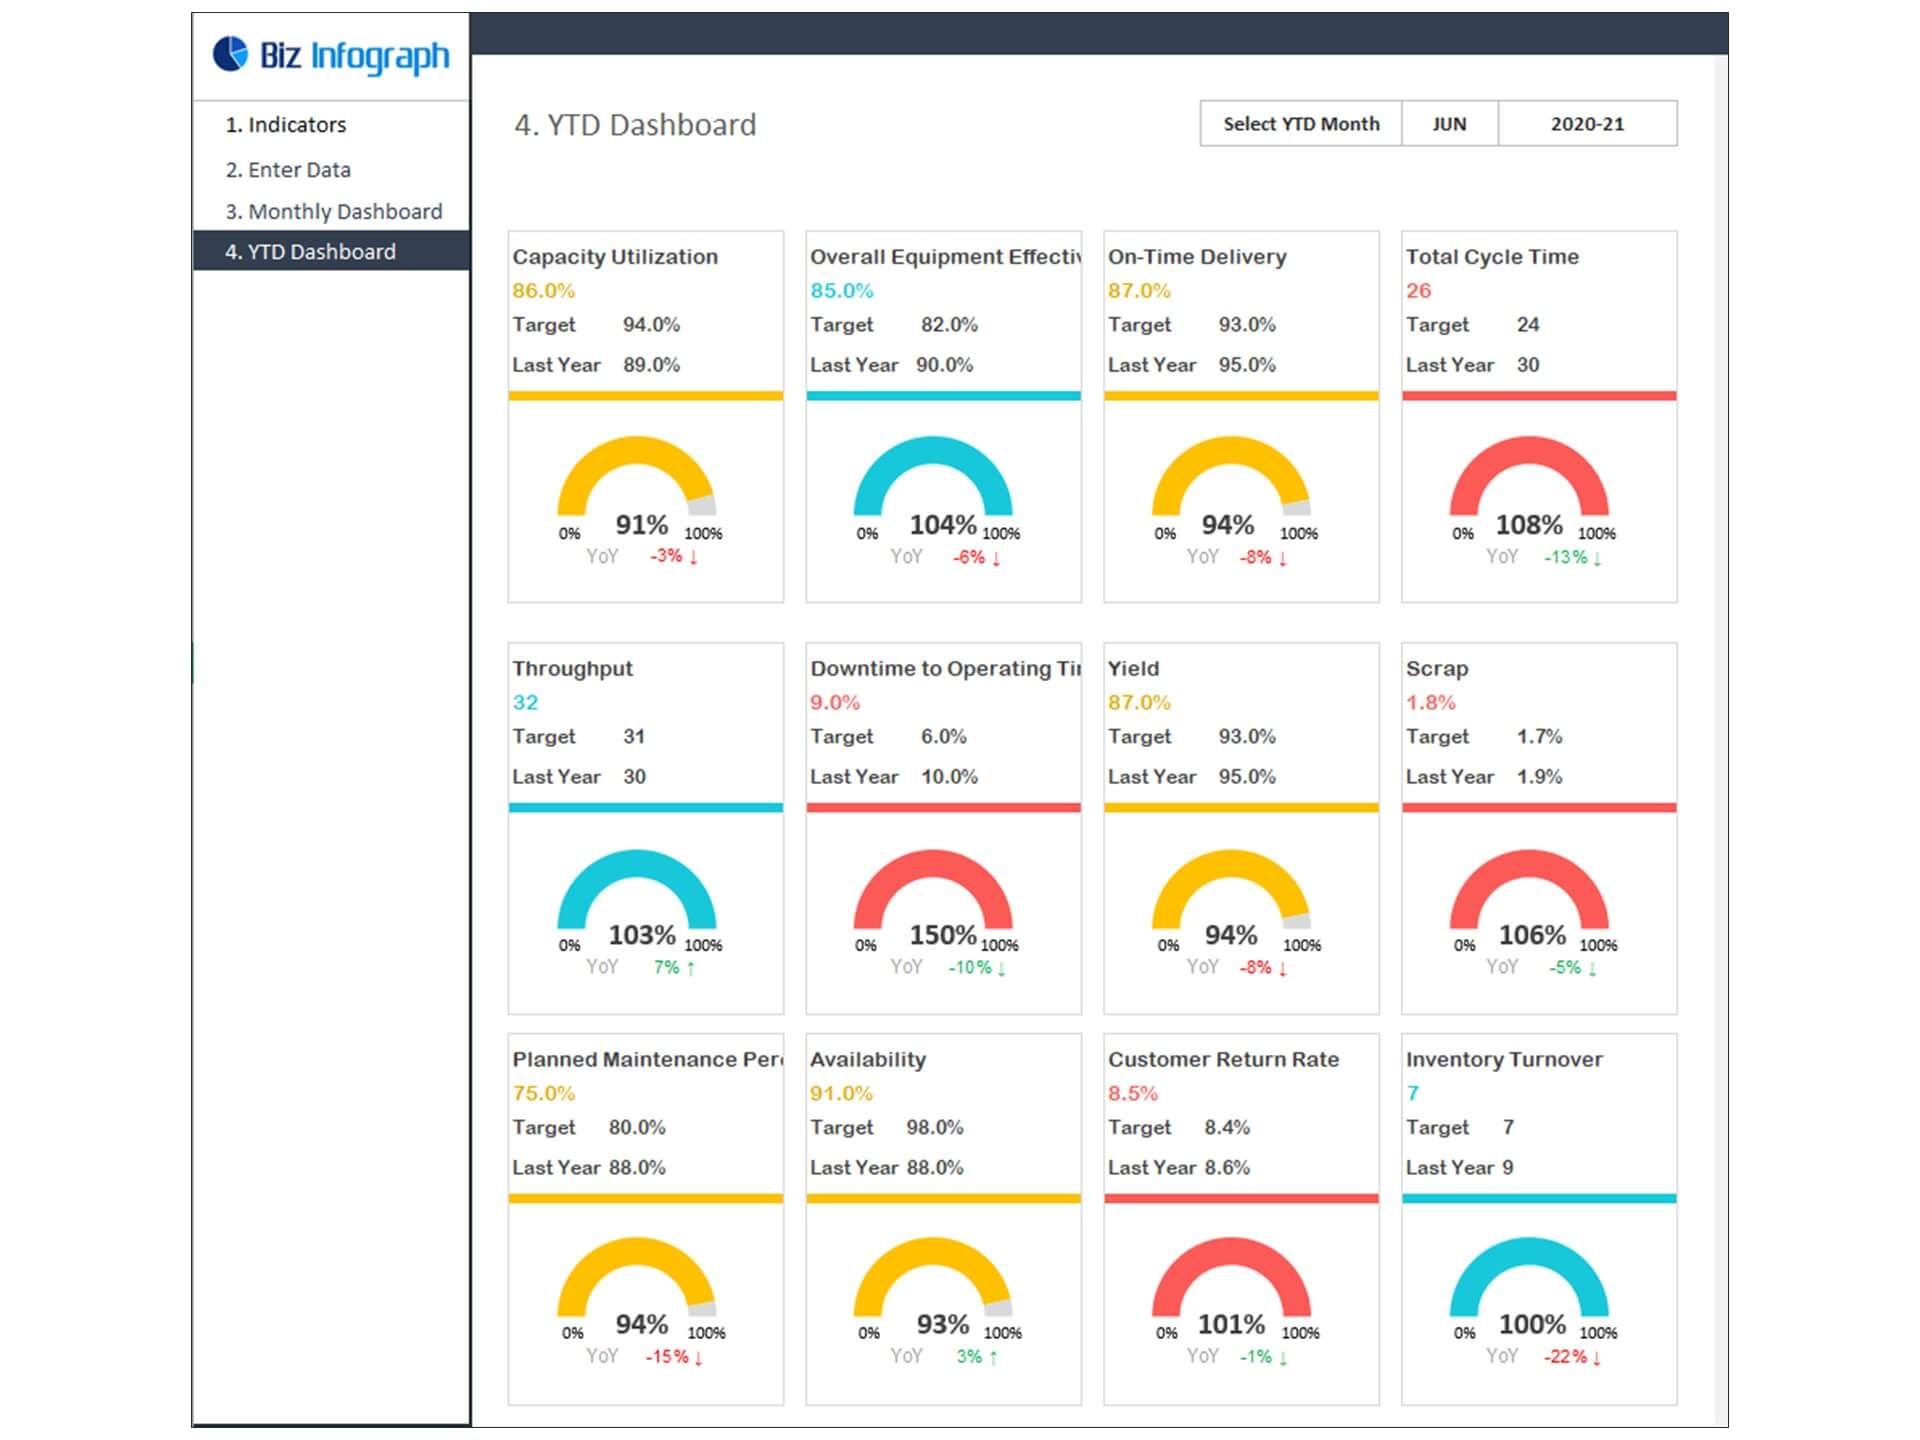
- Capacity Utilization: = (Actual Level of Output ÷ Maximum Level of Output) X 100
- Overall Equipment Effectiveness: = Availability X Performance X Quality
- Operating Time ÷ Planned Production Time = Availability%
- Total Parts Produced ÷ Capacity = Performance%
- (Total Parts Produced – Total Scrap) ÷ Total Parts Produced = Quality%
- On-time Delivery: = Work Orders Delivered by the Original Schedule Date ÷ Original Schedule Work Orders Due
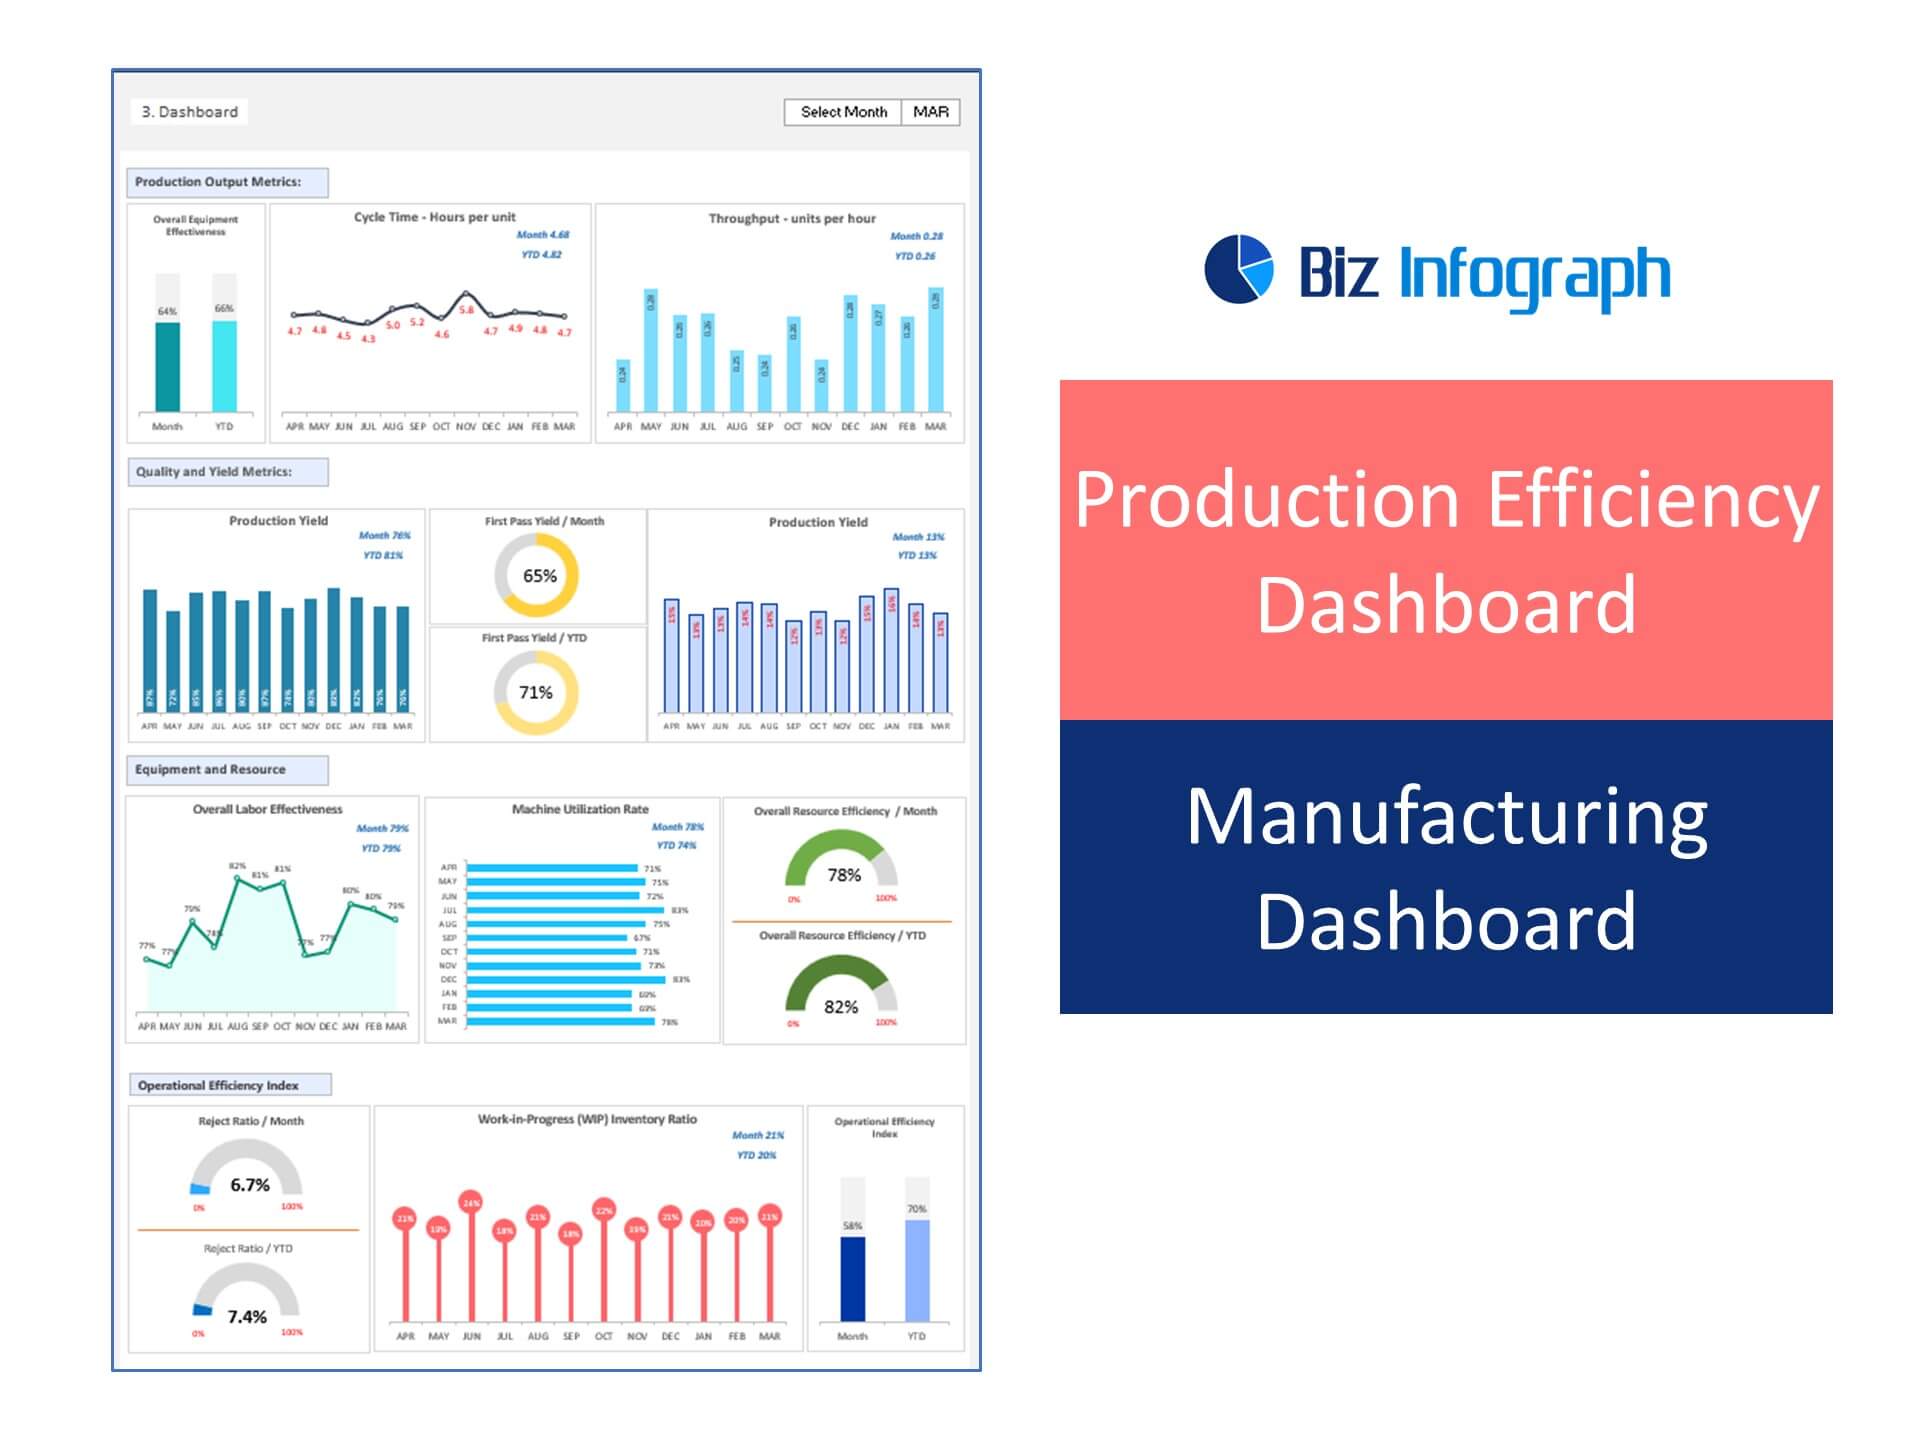
- Total Cycle Time: = (Total Parts Produced ÷ Production Run Time). It is measured as Actual Cycle Time Per Minutes.
- Throughput: = Units Produced ÷ Time [e.g. 1000 units ÷ minute]
- Downtime to Operating Time: = Downtime ÷ Operating Time
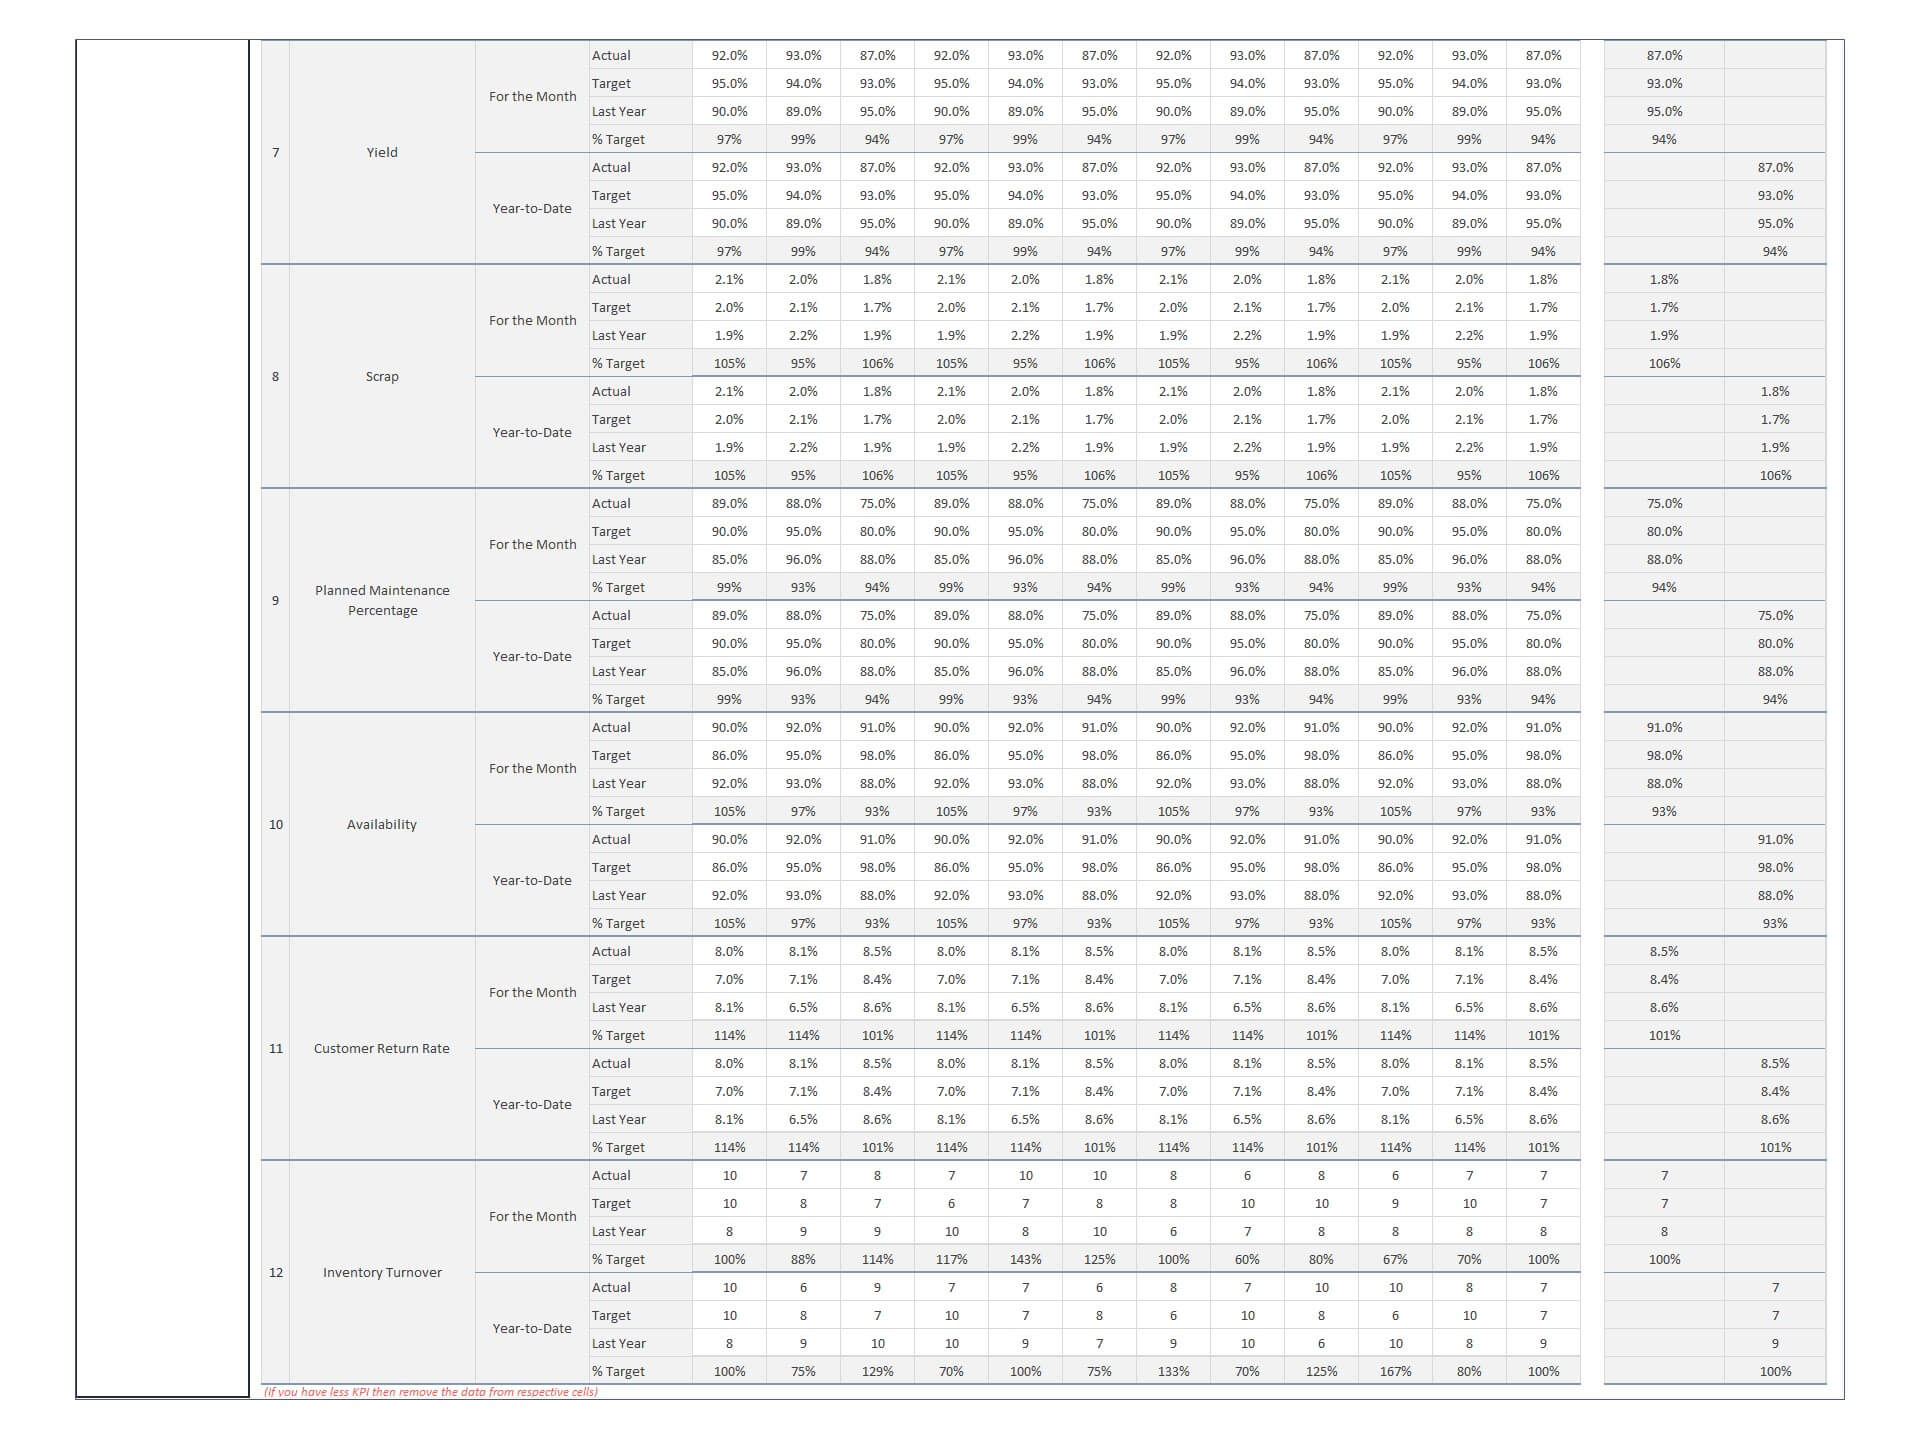
- Yield: = Good Parts Produced ÷ Total Units Produced
- Scrap: = Total Scrap ÷ Total Product Run
- Planned Maintenance Percentage: = Planned Maintenance Time ÷ Total Maintenance Time
- Availability: = Uptime ÷ (Uptime + Downtime)
- Customer Return Rate: = Rejected Goods ÷ Total Number of Goods Delivered
- Inventory Turnover: = Cost of Goods Sold ÷ Inventory
Key Features:
- Provides key insights for the Manufacturing team with details of targeted vital performance indicators
- Beautiful dashboard and reports to display performance KPI’s
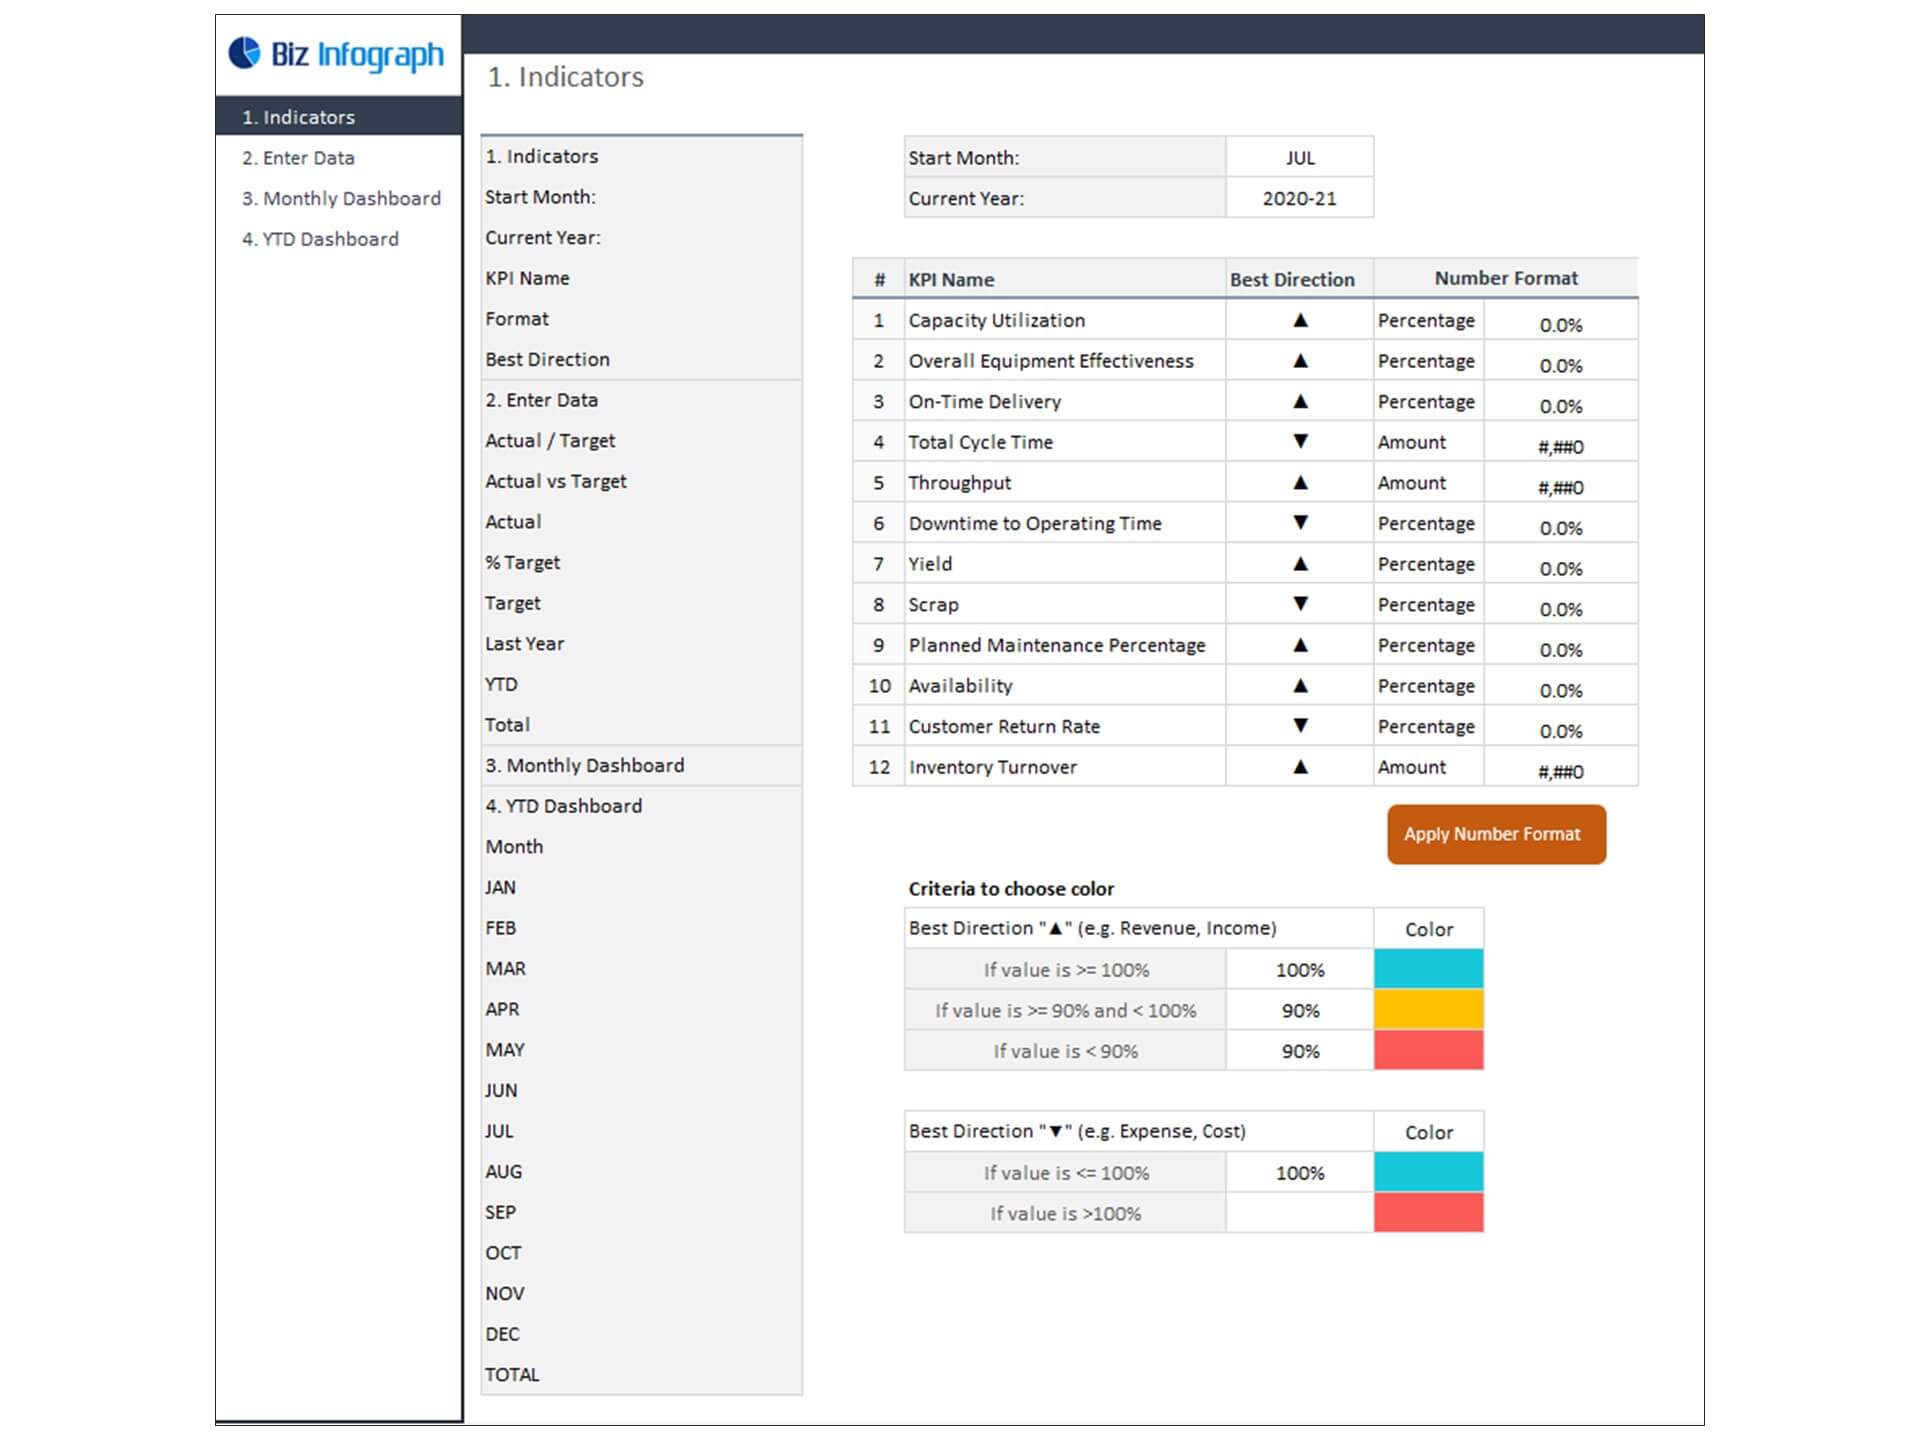
- Allows you to register up to 12 indicators
- Fully editable, easy to use, template with sample data
- Eye-catching design and customizable
- Change the sample data with your data
- Spreadsheets ready for printing without Biz Infograph logo
- Consolidate key financial performance indicators in one dashboard
- No monthly fees
- Immediate download
- No VBA, no Macro
- No installation necessary
- Professionally designed
What is included in this dashboard template?
- Just plug your data, the dashboard will be ready instantly and start using.
- A text file which contains a password to view and edit the formula
- A guide to unlocking all the elements in the dashboard
Professional Support:
- Video tutorial guide on how to navigate and use Manufacturing KPI Dashboard Template
- Professional service to customize dashboard template in excel as per business need
- Help and support in post-purchase
- Payment secured by Stripe and PayPal (no PayPal account needed)
A brief guide to using the dashboard template:
- Open the dashboard template
- Go to ‘Indicators’ menu – choose the start month of the fiscal year (i.e. Jan, Feb, Jul, etc.)
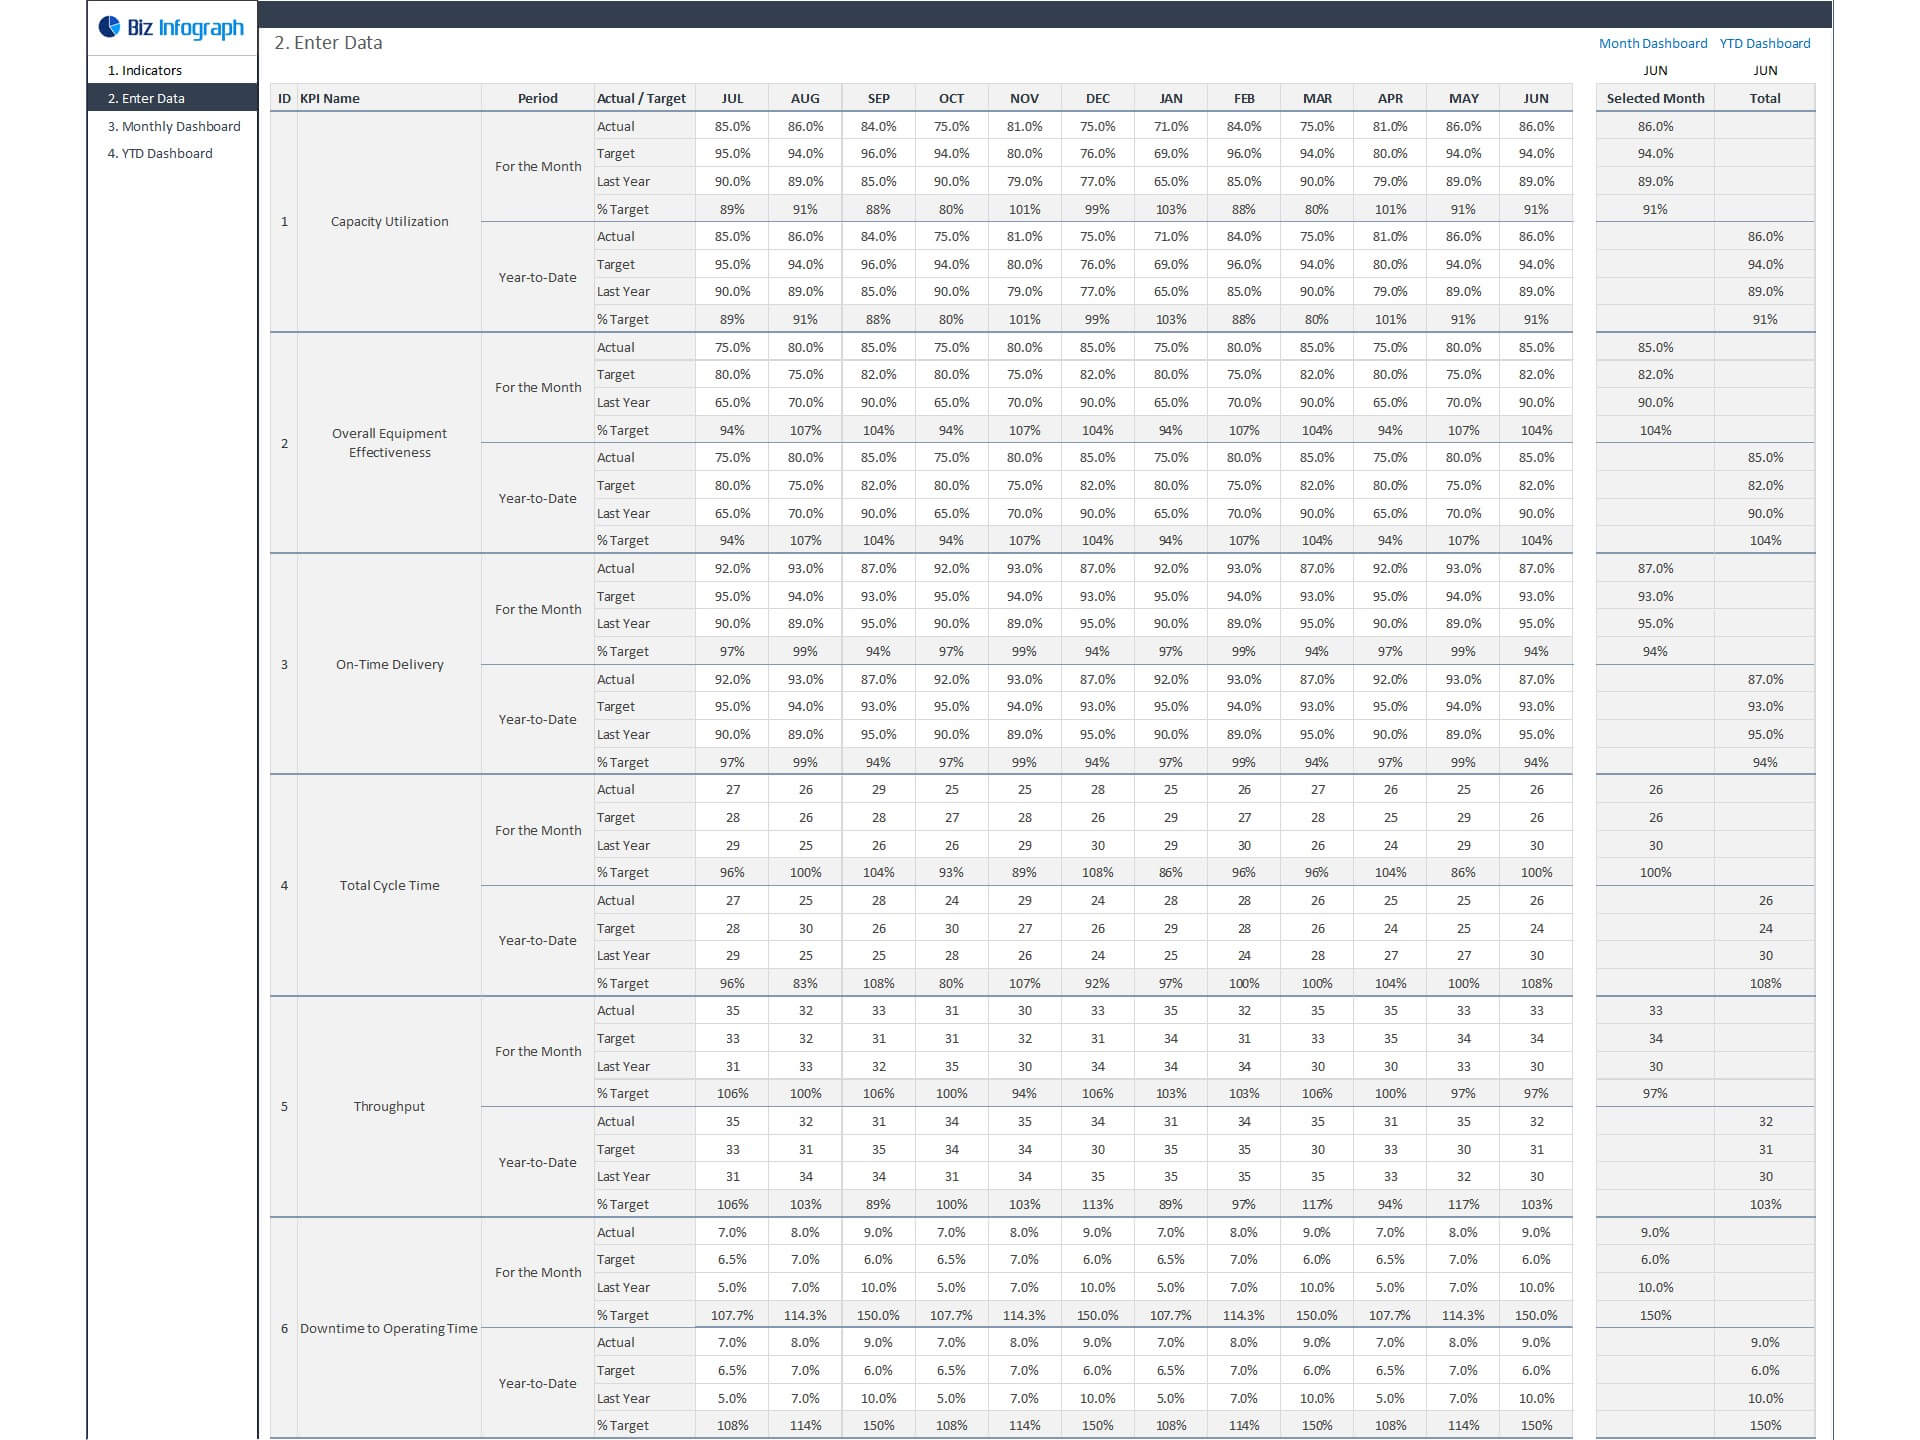
- Go to the ‘Enter Data’ menu – remove the sample data and give your actual data in the respective cells. Formula cells are locked, and you cannot edit it without a password.
- Go to the ‘Monthly Dashboard’ menu – select the month name from the drop-down to see the monthly picture of performance indicators
- Go to ‘YTD Dashboard’ menu - select month name from the drop-down to see the year-to-date picture of performance indicators
- Each page is ready for printing – just press CTRL+P
This Excel dashboard template is password-protected to avoid mistakes, such as accidentally deleting formulas. When you completed the purchase, the password will be available.