A chart isn’t advanced just because it looks polished. Advanced Excel charts and graphs make data easier to interpret, compare multiple data sets, or…


A chart isn’t advanced just because it looks polished. Advanced Excel charts and graphs make data easier to interpret, compare multiple data sets, or…

A polished chart can’t rescue a dashboard built on messy data. An Excel dashboard with slicers helps you track sales, budgets, projects, or KPIs,…
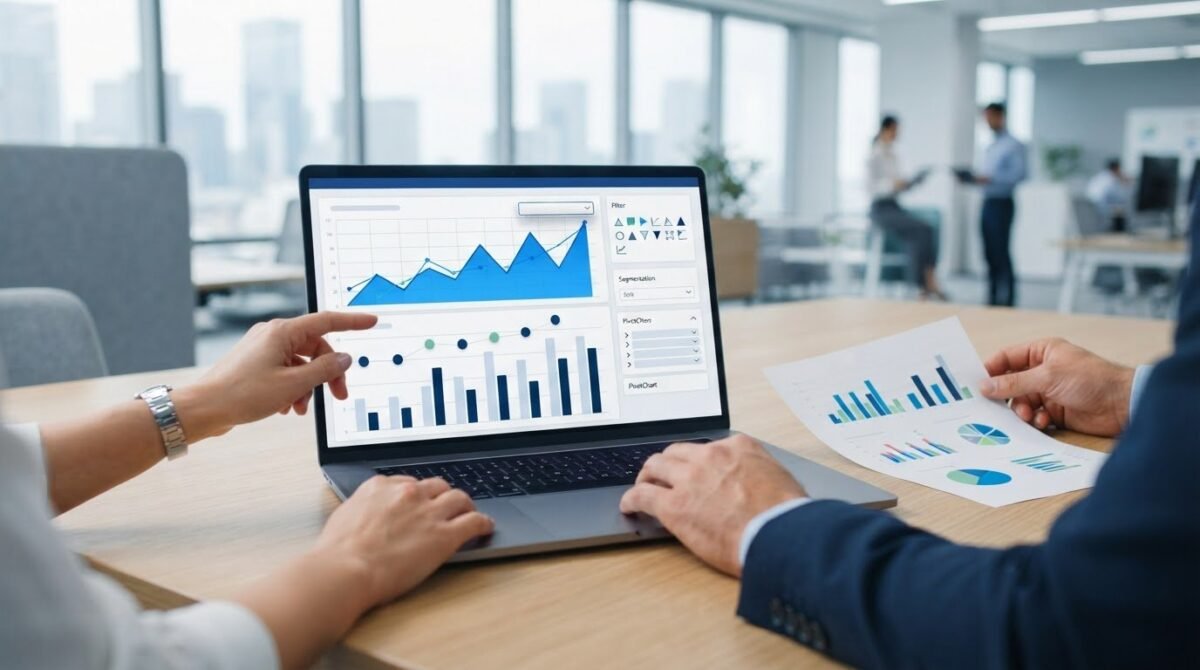
What if an interactive chart needs just one thoughtful control, not a complicated dashboard? Interactive charts in Excel can let colleagues explore…