

A polished marketing plan PowerPoint presentation does more than make a strategy look good: it shows how objectives, audience insights, tactics, budgets, timelines, and KPIs fit together. A well-organized deck helps stakeholders follow the plan and understand what the team should do next.
It’s easy to see why a clear structure matters. When decisions and supporting information are spread across dense slides, the strategy can be harder to understand and act on. A focused presentation gives stakeholders a shared view of the priorities, resources, and measures of progress.
Learn what to include, how to connect objectives with budgets and performance measures, and how timelines can turn strategy into action. You’ll also see how templates can help organize the story and present your marketing plan with confidence.
Key Takeaways
- Connect your objectives, audience insights, strategies, and implementation timeline so stakeholders can see how the plan moves from direction to action.
- Use brand positioning and competitor analysis to clarify who the plan serves and what makes its approach distinctive.
- Match campaign KPIs to the objective, then show how budget allocation and timing support those measures.
- Choose a PowerPoint or Google Slides template that helps organize the plan and present its information clearly.
What Makes a Good Marketing PowerPoint?
A strong marketing plan presentation connects its goals, audience, strategy, tactics, budget, and timeline. Each element should help the audience understand the plan and the next decision.
Marketing Plan Structure and Strategy
A marketing plan presentation can organize the strategy into an executive summary, situation analysis, target market, goals, programs, financial plan, implementation, and appendices. This structure shows how evidence informs each recommendation. Use customer feedback, demographic data, and internal analysis to explain the situation. Then define the target market, brand positioning, and goals before introducing channels or campaign details. A purpose-led opening and clear contents sections make the presentation easier to navigate.
Strategies, Tactics, and Implementation Timelines
A strategy sets the direction; tactics describe the actions that put it into practice. For example, a strategy to build awareness might use social media content, email, and search marketing. Add a timeline that connects each activity to its launch, owner, and sequence. For social media, show platform-specific plans alongside a content calendar, performance goals, and example posts. This helps the audience see what happens and when.
Marketing Mix Strategies
The marketing mix organizes programs around product, price, place, and promotion. These elements show how the offer reaches and serves the target market. A presentation might explain the product’s customer value, pricing approach, sales channels, and promotional messages together. Keep the choices connected: promotion should reflect the offer and audience, while distribution should support how customers access it. This makes the strategy feel coherent rather than like a set of separate activities.
Building the Presentation Step by Step
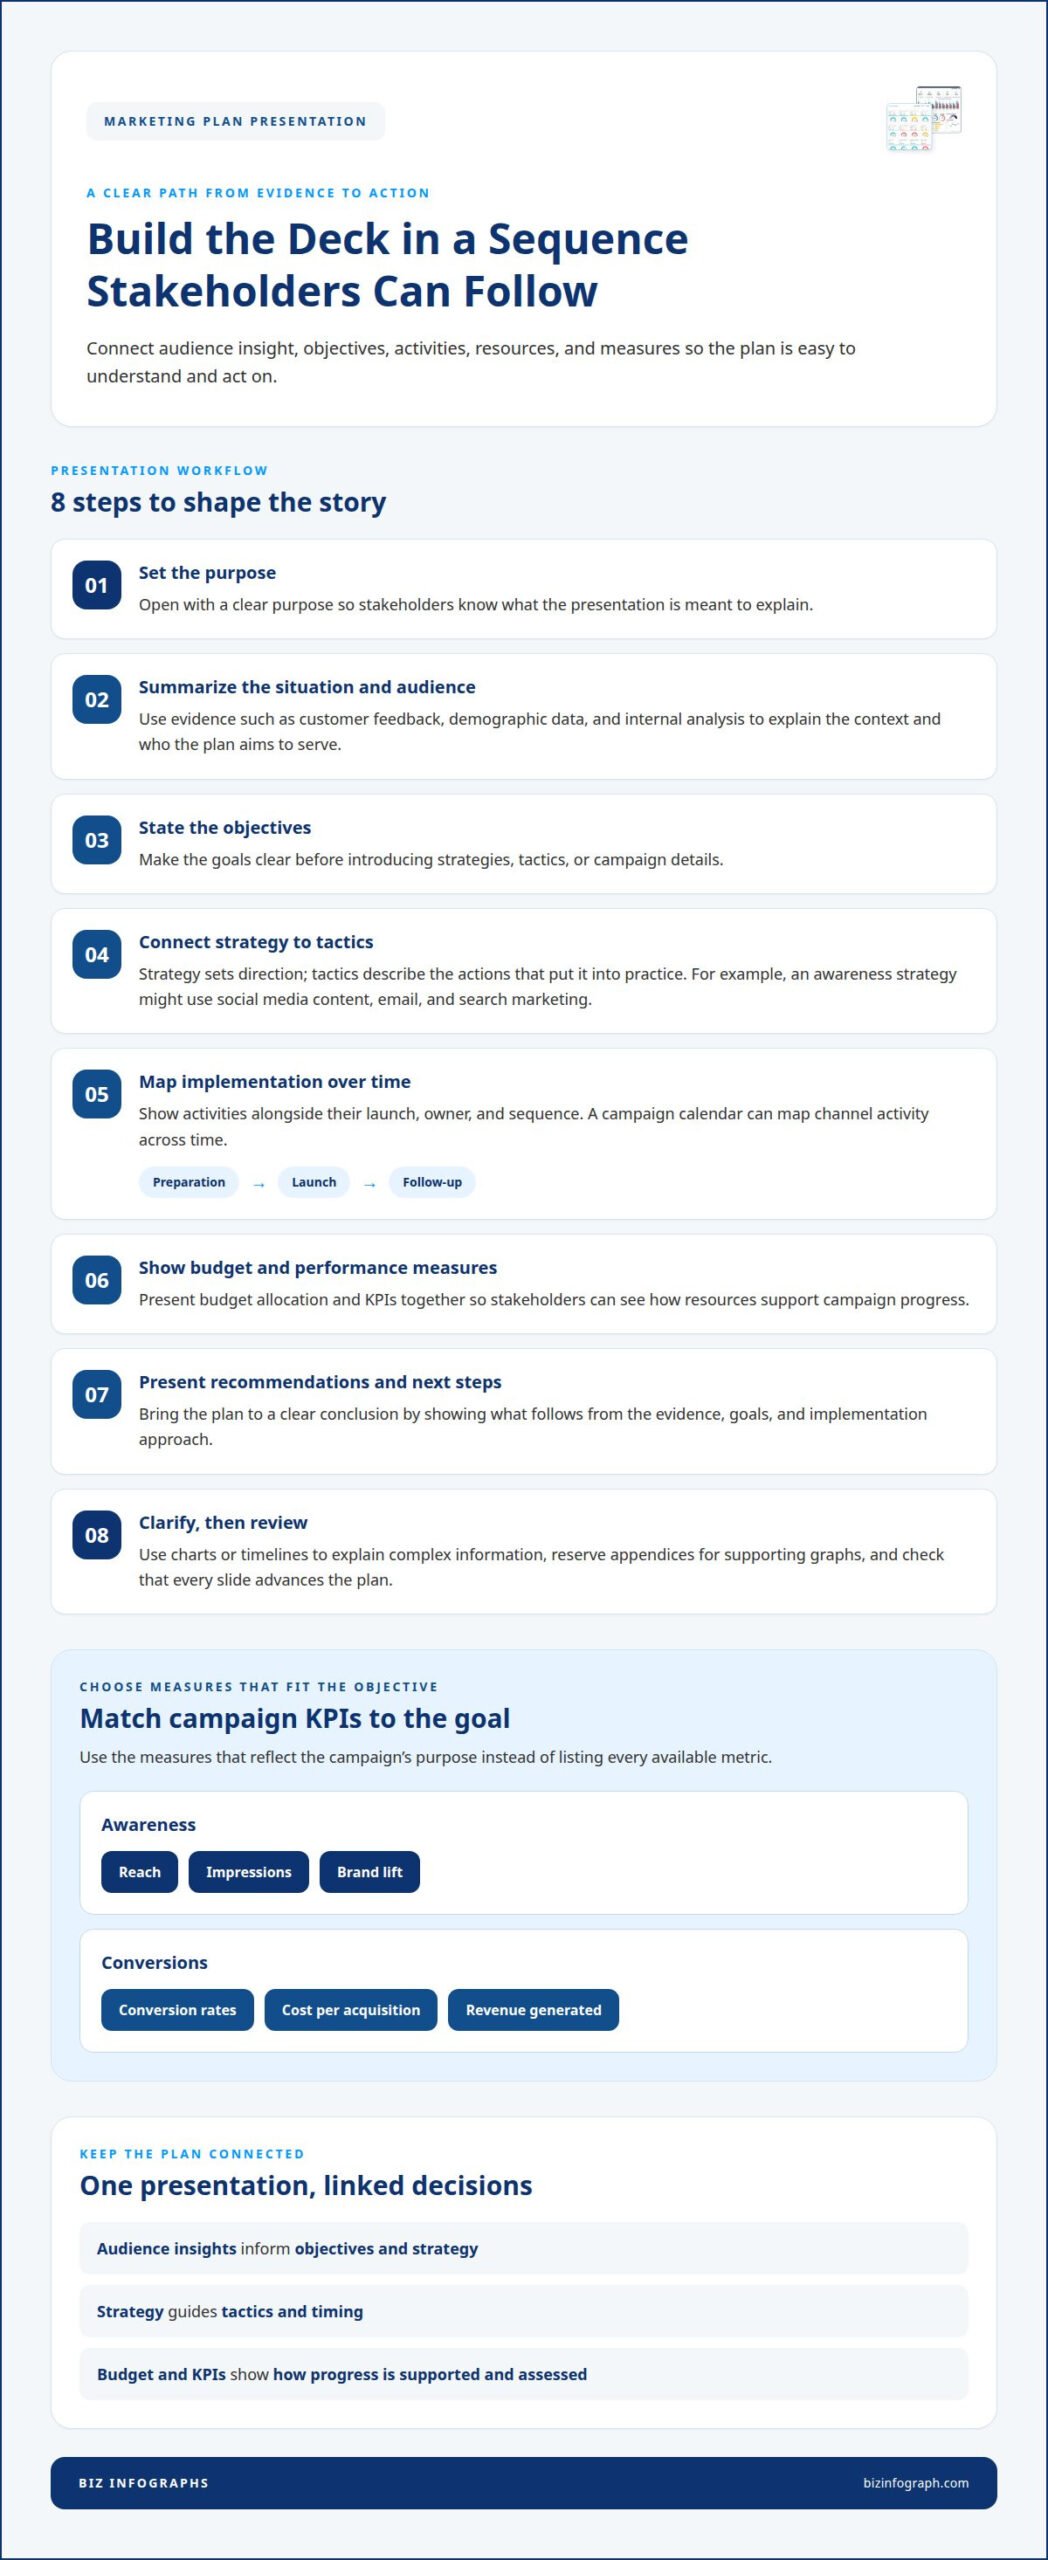
To create a marketing plan presentation, start with its purpose, then shape the evidence and actions into a clear sequence. Summarize the situation and target audience first. Next, state objectives, strategies, tactics, and the implementation timeline. Show budget allocation and performance measures, followed by recommendations and next steps. Use charts or timelines to clarify complex information, and reserve appendices for supporting graphs. Review every slide to ensure its message advances the plan.
What is a Marketing Plan?
A marketing plan describes the market, target customers, and activities intended to meet business goals. Present audience needs first, then explain the brand positioning and strategy those insights support.
Business and Market Situation Analysis
A situation analysis examines external conditions, customers, and the business itself. These three perspectives provide context for marketing decisions. For example, an external review can describe market conditions, while customer analysis summarizes feedback and demographic data. Internal analysis can show the business’s products, capabilities, and current marketing activity. Together, these findings explain why the plan focuses on particular opportunities or challenges.
Target Audience Analysis
Target audience analysis describes the customers a plan aims to reach and serve. Audience needs shape the offer, messages, and channel choices. Use customer feedback and demographic data to build a practical profile. For example, distinguish existing customers from prospective buyers, then describe each group’s priorities. Connect each profile to a relevant need instead of relying on broad labels alone.
Brand Positioning
Brand positioning explains how a business wants its offer to be understood by its target market. Clear positioning guides consistent choices across marketing messages and programs. State the product or service, its audience, and the value it provides. A positioning map can show how customers may perceive the offer alongside alternatives. Pair the visual with a concise statement of the brand’s intended place in the market.
Competitor Analysis
Competitor analysis compares other market offers with the business’s own position and intended audience. This comparison can reveal opportunities to differentiate the offer. Use a comparison map to show meaningful differences, such as audience focus or product features. A SWOT analysis can organize strengths, weaknesses, opportunities, and threats. Tie each observation to the marketing decision it informs, rather than presenting comparisons without a clear implication.
Campaign objectives, budgets, KPIs, and timelines
Campaign plans connect objectives to budgets, measures, and launch timing. Present these elements together so stakeholders can see how resources support progress.
Campaign Charts and Calendars
A campaign calendar maps activities across channels and time, while charts make priorities and results easier to interpret. These visuals help teams understand what launches when and how activities connect. For example, a seasonal calendar can align social posts, email messages, and promotions around a holiday period. A timeline can also show preparation, launch, and follow-up stages.
Choose chart types that fit the objective. Awareness campaigns can highlight reach, impressions, and brand lift. Conversion-focused charts can show conversion rates, cost per acquisition, and revenue generated. An infographic can summarize budget allocation by channel, while a calendar shows the sequence of planned content. Label each visual clearly and explain the decision it supports.
Campaign Planning and Progress Tracking
Campaign planning links objectives, budget allocation, KPIs, and timelines to agreed performance standards. Teams need a shared way to assess implementation and decide whether adjustments are needed. For awareness, track reach and impressions; for conversions, focus on conversion rates, cost per acquisition, and revenue. Choose measures that reflect the campaign’s goal instead of listing every available metric.
Show planned activities, channel allocation, and the measurement approach together. During implementation, compare performance with the standards in the plan. A seasonal promotion, for example, may need coordinated content before its key period and follow-up messaging afterward. Make these dependencies visible in the timeline so teams can spot delays or gaps and respond with relevant changes.
After the campaign, explain what the results mean, not just what happened. Compare outcomes with the objective, identify useful insights, and state the next action. If awareness was the goal, interpret reach and brand lift; if sales were the goal, connect conversions and revenue to the campaign’s intent. Clear recommendations turn reporting into a practical decision about what to continue, change, or test next.
Marketing plan PowerPoint and Google Slides templates
The best marketing plan presentation examples make the strategy easy to scan and adapt. Choose a template that fits the plan’s purpose, then organize the slides around the executive summary, market analysis, goals, strategies, and action items. Templates for PowerPoint and Google Slides can provide this structure, while brand colors, logo, and typography help make the deck consistent.
Template examples suit different audiences and visual styles. The Memphis Marketing Plan template comes in 4:3 and 16:9 formats, useful when presentation dimensions matter. The Elegant Real Estate Marketing Plan Slides template uses a 16:9 aspect ratio. For a compact restaurant example, the Minimalist Restaurant Marketing Plan Slides template contains 16 slides. The French Fashion Aesthetic Marketing Plan Slides template contains 15 slides.
Use examples as starting points, not fixed plans. A real estate presentation might emphasize its target market, positioning, channels, and campaign calendar. A restaurant plan could foreground customer insights, promotional activity, and budget priorities. A fashion marketing plan might give more space to brand identity and content direction. In each case, align the slide sequence with the decisions the audience needs to make.
Before choosing a template, match its layouts to your content. Check whether it can show a market overview, an objective, a budget, a timeline, and performance measures without crowding. Replace sample text with your plan, and adapt colors and typography to your brand. Give a chart or calendar its own clear slide when it carries a key point, and label it well. Keep supporting graphs or miscellaneous material in an appendix so the main story stays focused.
A well-matched template saves you from building every layout from scratch, but the plan still needs clear content. Choose a format and visual style that help your audience understand the strategy, then tailor each slide to the information they need to act.
Biz Infographs: PowerPoint Infographic Templates
Biz Infographs offers PowerPoint Infographic Templates to help you present marketing plans with clear, polished visuals. They’re useful for communicating objectives, budget details, timelines, or campaign results in a focused slide deck.
Use an infographic template to give key information a visual structure, then adapt the content to your audience and plan. For related reporting, Excel Dashboard Templates and Power BI Templates help present data, while Automation Templates support workflow tasks. Choose the format that matches the information you need to communicate, whether it’s a strategy overview or campaign performance.
Explore Biz Infographs’ PowerPoint Infographic Templates to find a visual format for your marketing plan.
Give Your Marketing Plan a Clear Next Move
A useful presentation should lead to a decision, not simply end when the slides run out. Treat your marketing plan PowerPoint presentation as a working tool: close by naming the choice stakeholders need to make, who will own it, and what information will guide the next review. That gives the plan a practical path beyond the meeting.
Before sharing the deck, consider what each audience needs to do with it. Leaders may need to approve priorities, while campaign teams need a clear view of the work ahead. Biz Infographs offers PowerPoint Infographic Templates, Excel Dashboard Templates, and Power BI Templates for presenting plans and data visually.
Ready to take the next step with your presentation? Contact Biz Infographs for presentation help. Bring your strategy to the room with clarity and confidence.
Frequently Asked Questions
What should a marketing presentation include?
Include the information your audience needs to understand the decision and act on it. For a product launch, that could include the customer problem, intended audience, launch message, channel roles, required resources, and approval needed. Keep supporting evidence close to the recommendation it informs. This helps stakeholders connect the proposal with its business purpose.
What is a marketing plan and what should it include?
A marketing plan is a working document that sets out how marketing activity supports business goals over a defined period. It connects the business’s offer with its intended customers and planned activities. For example, a service business might document a new audience, the customer need it addresses, the outreach approach, resource requirements, and how the team will assess progress.
What is the ideal marketing plan PowerPoint presentation structure?
The ideal structure follows the audience’s decision path, rather than forcing every plan into an identical slide count. Open with the decision or purpose, establish the business context, then present the audience, strategic choice, resources, timing, and measures. Close with the approval or action required. For a leadership meeting, bring the recommendation forward; supporting analysis can follow or sit in an appendix.
Where can I find free marketing plan PowerPoint templates?
Start with the template options available in your presentation software, including PowerPoint or Google Slides, and look for layouts designed for business plans. Check whether a template lets you edit its text, charts, and colors to suit your needs. Biz Infographs also offers PowerPoint Infographic Templates, but don’t assume a product is free unless its listing clearly says so.
What market research and competitor analysis should a marketing plan include?
Include evidence that explains customer needs, market conditions, and the business’s position. Customer feedback and demographic information can reveal who the plan should serve; internal and external analysis add business and market context. For competitor analysis, compare relevant offers and audience positioning. Then explain what the comparison means for your choices, such as refining the message or focusing on a distinct customer need.
How do you set marketing goals, KPIs, and a budget?
Start with the business outcome, then define a goal that describes the intended change. Select KPIs that show progress toward that outcome, and allocate budget across activities expected to contribute. For example, a campaign focused on customer inquiries should track inquiry-related results, rather than relying only on visibility measures. Explain the assumptions behind each allocation so stakeholders understand the rationale.