Introduction to Revenue Budget vs Actual Dashboards
What is a Budget vs Actual Dashboard in Power BI?
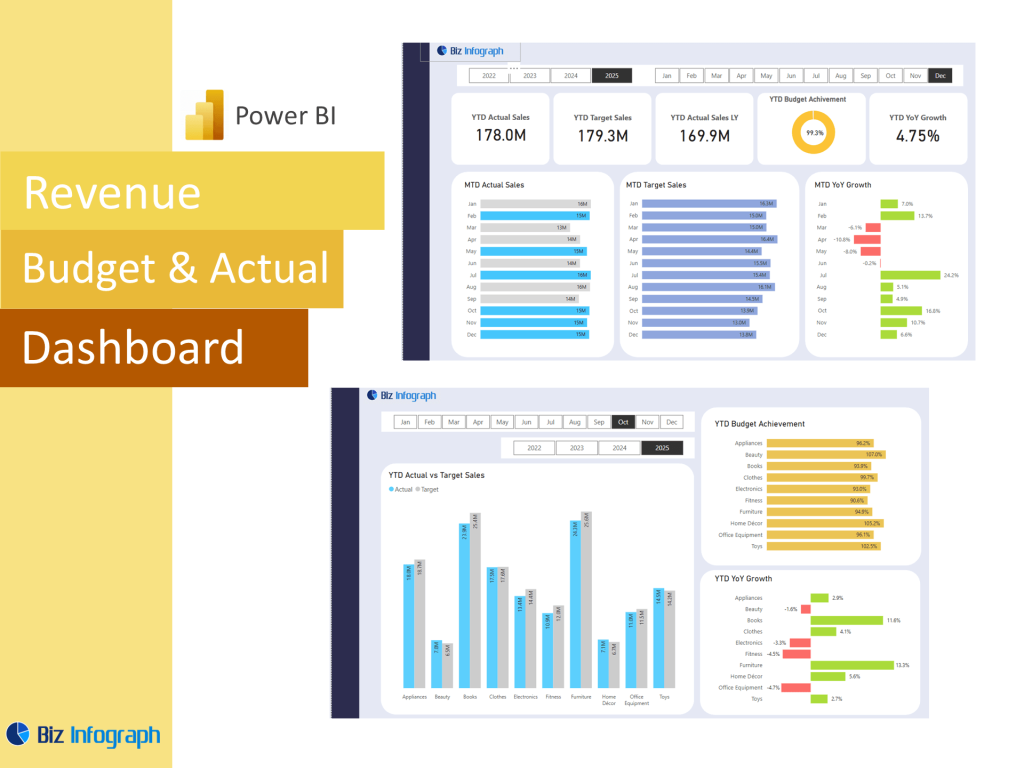
A budget vs actual dashboard in Microsoft Power BI is a powerful business intelligence tool that provides organizations with a clear comparison between budgeted forecasts and actual results. Using a dashboard in Power BI, finance teams and decision-makers can track actual revenue, actual expenses, and sales amount against projected targets. This type of dashboard helps users identify trends, monitor financial performance, and make data-driven decisions. Built with Power BI dashboard templates, these tools integrate budget data, actual figures, and forecast data from various data sources into a single, interactive view.
Importance of Tracking Revenue Against Budgeted Forecasts
Monitoring actual vs budget outcomes is essential for maintaining fiscal discipline and strategic alignment. Whether it’s comparing actual sales to sales targets or tracking departmental expenditures, this practice helps identify areas of over- or under-performance. A budget vs actual dashboard enables businesses to understand how close they are to revenue goals, assess cost of goods sold, and evaluate the return on marketing or sales investments. By integrating sales performance by comparing actual revenue with forecasts, the dashboard ensures ongoing accountability and supports mid-year adjustments.
Benefits of Using Microsoft Power BI for Budget Dashboards
Microsoft Power BI offers a wide range of features that make it ideal for building budget vs actual dashboards. The platform supports real-time data refreshes, seamless integration with financial data systems, and powerful calculations using DAX. Users can interact with dashboard templates featuring bar charts, line charts, and KPI cards, all of which enhance understanding of financial gaps. Power BI dashboard templates make it easy to plug in your data and visualize differences. This ease of use combined with analytical depth makes Power BI budget vs actual dashboards a preferred solution for finance teams worldwide.
Core Elements of a Budget vs Actual Dashboard
Key Metrics to Include in a Revenue Budget vs Actual Dashboard
Every effective revenue budget vs actual dashboard in power bi should include key metrics such as actual revenue, actual expenses, sales amount, gross margin, and income and expense variance. Other key financial metrics may involve EBITDA, net income, or departmental budgets. A good dashboard provides both a high-level summary and the ability to drill into detailed actual numbers. For instance, users can examine how sales performance varies across products or compare budget data against actuals by department. These kpis offer actionable insights and help decision-makers refine strategy.
Building an Accurate Data Model with DAX Calculations
Using DAX in Power BI allows users to build custom measures to calculate variances, ratios, and performance indicators. A strong data model is critical, as it connects budget data, actual figures, and forecast data into a unified structure. Power Query and the Power Query Editor help prepare and transform raw inputs into structured tables. Formulas like Variance = Actual - Budget and Variance % = (Actual - Budget) / Budget are common in budget vs actual analysis. These calculations enable granular data analysis and help identify trends in both revenue and expenses.
Visualizing Income and Expense Trends Over Time
An essential feature of any budget vs actual report is the ability to visualize changes in income and expense over time. By using line charts, bar charts, and area graphs, users can see trends over time and spot seasonal patterns or anomalies. This interactivity allows stakeholders to interact with this Power BI dashboard dynamically, filtering by region, product, or period. A well-structured performance dashboard lets users track fluctuations in sales data, evaluate actual vs budget trends, and plan proactively. Effective visuals not only reflect numbers but also tell the story behind them.
Designing the Dashboard in Power BI
Choosing the Right Power BI Dashboard Template
Selecting a suitable Power BI dashboard template is key to accelerating development and ensuring clarity. Templates are pre-built with standard visuals and data models that cater to budget vs actual dashboards, allowing users to plug in their data with minimal configuration. Many organizations download free templates from Microsoft or third-party providers. These dashboards often include default kpi cards, trend lines, and dashboard features that reflect best practices in finance reporting. Using a solid dashboard example as your foundation ensures consistency and reduces time to delivery.
Best Practices for Budget vs Actual Dashboard Design
Designing an effective dashboard in Power BI requires thoughtful planning. Use contrasting colors to differentiate actuals from budget, incorporate tooltips for context, and use responsive visuals to support desktop and mobile viewing. Ensure that users can filter and drill through data with Power BI by time frame, department, or line item. Structuring your dashboard to provide a comprehensive view—starting with a summary at the top and moving into detailed analysis—ensures usability for both executives and analysts. Following data visualization best practices improves decision-making.
Forecasting and Variance Analysis Using Power BI Tools
Advanced variance analysis helps organizations understand performance drivers. Power BI provides robust tools for forecasting future outcomes using historical actuals and trend lines. By comparing actual vs budget figures across time frames or business units, teams can assess forecasting accuracy and improve planning processes. Variance visuals help spot red flags early—such as a drop in revenue or a spike in actual expenses. Incorporating forecast data into the same dashboard supports seamless budget vs actual reviews and helps create a profit and loss statement dynamically.
Real-World Applications and Use Cases
Use Cases for Revenue Budget Dashboards Across Departments
A budget vs actual dashboard has applications in nearly every department. Sales can use it to evaluate sales targets, operations to control costs, and HR to monitor headcount budgets. These dashboards offer actionable insights for both strategic and operational planning. In marketing, comparing campaign budgets to actual results helps measure ROI. In finance, these tools aid in monthly close and planning processes. Regardless of department, the dashboard can help align spending and performance with organizational goals.
Comparing Actual vs Budget Across Business Units
By comparing actual figures to budget data across different business units, companies can benchmark performance and identify inefficiencies. A Power BI budget vs actual dashboard might allow users to switch between global views and regional roll-ups, offering both macro and micro perspectives. Visuals showing actual revenue versus projections for each segment help sales managers and executives refine targets and redistribute resources. Through filters and slicers, stakeholders can customize their view and make informed decisions across functions.
Examples of Power BI Dashboards for Revenue and Forecasting
There are many examples of Power BI dashboards used for tracking revenue and forecasting. These include sales budget vs actual dashboards, financial dashboards, and revenue dashboards that provide insight into top-line growth. A typical dashboard using Power BI may show actual vs budget comparisons by month, category, and region, using interactive visuals for deeper exploration. These dashboards are often used during quarterly reviews and board meetings to present a clear picture of financial progress. Leveraging bi offers like built-in AI, users can go beyond descriptive analytics to predictive forecasting.
For ready-to-use Dashboard Templates: