

What if the slide meant to clarify your strategy makes external forces harder to understand? A PESTLE analysis can reveal risks and opportunities, but hours spent formatting PowerPoint shapes may still leave you with a cluttered slide that doesn’t show what those forces mean for the business. A well-designed pestle analysis template ppt gives you a clear structure for presenting the evidence and its potential implications.
Before setting goals or committing to a strategy, your team needs a shared view of the political, economic, social, technological, legal, and environmental factors that could shape what comes next. The challenge is to make those factors easy for stakeholders to compare and to connect each relevant signal to a business impact.
This guide explains how to choose, customize, and present a professional PESTLE template, even if you’re not a designer. Learn how to select a layout, organize findings, and show how external signals relate to strategic decisions. The result can be a clearer presentation, with more time left to focus on the analysis.
Key Takeaways
- Use PESTLE to examine external forces before setting strategic goals, and connect relevant factors to their potential business impact.
- Choose a pestle analysis template ppt layout that suits your audience and the amount of detail, from circular overviews to comparison matrices.
- Use consistent category labels, icons, and visual hierarchy to make all six PESTLE areas easier to scan and discuss.
- Customize your slide by checking evidence, selecting a suitable layout, and prioritizing the insights stakeholders need to consider.
- Refresh the analysis as conditions change, and use dashboard data to support ongoing strategic conversations.
What is a PESTLE Analysis Template and Why Does Your Strategy Need One?
A strategy built without looking beyond the organization can miss forces that shape its success. PESTLE is a framework for examining the macro-environment, the broad external conditions that can create opportunities or threats. It expands on the foundational PEST analysis approach and brings six areas into view:
- Political: Government priorities, trade policy, and political stability.
- Economic: Factors such as inflation, interest rates, and customer purchasing power.
- Social: Demographics, cultural expectations, and changes in customer behavior.
- Technological: Innovation, automation, and shifts in digital infrastructure.
- Legal: Laws and obligations relevant to the organization and its markets.
- Environmental: Climate conditions, resource availability, and sustainability expectations.
A PESTLE analysis isn’t a strategy by itself. It gives teams context for discussing external risks and opportunities before setting goals or committing to a plan. A well-structured pestle analysis template ppt makes those factors easier to compare than a standard text list. Stakeholders can scan the categories, evidence, and potential business effects instead of sorting through dense notes. That structure helps keep discussions focused on what the findings could mean, not just on the data.
The Strategic Value of Macro-Environmental Visualization
Visualization turns research into a shared view of the business environment. For example, a slide could link a technology trend to changing customer expectations, then show a possible opportunity or risk for the business. Use clear groupings, labels, and visual cues to simplify complex variables without stripping away their meaning. A consistent design also helps an executive audience understand how the analysis is organized and where to focus.
When to Use a PESTLE Analysis in Your Business Cycle
PESTLE is most useful when it informs a decision, rather than sitting untouched in a report. Revisit the analysis during annual strategic planning and quarterly reviews to check whether important assumptions have changed. Include it in a new-market entry or product launch deck to frame external conditions before discussing the plan. It can also support risk management and compliance reporting by organizing relevant external developments for review. Keep it as a living document by refreshing the evidence and implications as conditions evolve.
The right visual framework turns broad research into a clearer conversation about what the business should watch, prepare for, or pursue. For non-designers, a ready-made presentation layout can reduce formatting work and leave more time for analysis.
Core Design Pillars of an Impactful PESTLE Analysis Template PPT
A strong slide does more than fit six categories onto a page. It helps stakeholders see where to look, what matters, and how external signals connect to strategic decisions. The Chartered Institute of Personnel and Development (CIPD) frames PESTLE as a useful input to strategic decision making. Clear design makes that input easier to discuss without letting decoration compete with the analysis.
Professional Iconography and Symbolism
Icons help audiences scan categories quickly, but inconsistent or overly generic symbols can create confusion. Choose a coherent set with a shared visual style, stroke weight, and level of detail. A simple government building might represent Political factors, while a leaf could signal Environmental considerations. Match the icons to your organization’s branding, and use scalable vector artwork where possible so symbols stay crisp when resized.
Build Hierarchy with Color and Space
Give the six factors a predictable structure: clear category labels, concise supporting points, and a visible distinction between evidence and implications. Use color to reinforce categories or draw attention to a critical risk, but don’t rely on color alone to communicate meaning. Pair it with labels or symbols, and keep the palette restrained so emphasis remains meaningful. Leave enough white space around each section to separate ideas and make the slide easier to scan.
For example, state a technology shift in a short phrase, then add a clear takeaway about its potential effect on operations or customer expectations. This directs attention from the external signal to its business relevance, rather than presenting every note with equal weight.
Optimize Text for Strategic Clarity
Keep slide text tight. Replace paragraphs with short bullets that capture the signal, its potential impact, or the question leaders should consider. Use bolding selectively for key takeaways, not entire blocks of copy, and stick to a small number of readable type styles. A PowerPoint infographic template can help maintain a consistent visual system across slides, so the PESTLE analysis feels like part of a polished presentation rather than a one-off graphic.
- Signal: State the external change in a few words.
- Implication: Explain why it could matter to the business.
- Discussion prompt: Identify the decision or follow-up to consider.
A well-designed pestle analysis template ppt gives non-designers a practical starting point and reduces time spent arranging shapes and formatting text. Explore PowerPoint infographic templates as one option for creating a more consistent, presentation-ready visual.
Selecting the Perfect Layout: Circular vs. Linear PESTLE Frameworks
No single layout suits every audience or purpose. A circular view can suggest that external forces are interconnected, while a grid gives each factor room for evidence and implications. The University of Sydney’s guide to PESTLE analysis provides a useful foundation. Choose a slide format based on what your audience needs to understand or decide.
Circular and Hub-and-Spoke Designs
Place the company or strategic question at the center, then arrange the six factors around it. This hub-and-spoke design suits boardroom pitches and high-level overviews, where leaders need to see the broader environment before exploring details. Use connecting lines or restrained arrows to suggest relationships, but don’t imply that one factor causes another unless your analysis supports it. The circular layout signals connection, not equal importance.
Grid-Based and Tabular Layouts for Deep Dives
A grid or matrix works better for workshops and internal planning documents with more evidence to compare. Give each factor consistent space for the external signal, its possible business implication, and a discussion prompt. This structure makes gaps and overlaps easier to spot. It can also lead into a SWOT slide: first identify external opportunities and threats in the PESTLE review, then consider how they relate to internal strengths and weaknesses.
For a changing environment, consider a linear or timeline layout. It can show how a policy shift, technology development, or market condition has evolved and what your team may need to monitor next. Clearly distinguish dates and projections from confirmed developments. A timeline shows sequence, but it shouldn’t suggest certainty about what happens next.
An infographic poster style suits high-level summaries, internal newsletters, or quick reference materials. It can provide a compact overview of all six categories, while a separate slide or document carries the deeper evidence. Avoid squeezing workshop-level detail into a poster. The format should invite readers into the analysis, not overwhelm them with it.
Match the pestle analysis template ppt to the audience and the decision at hand:
- Executives or investors: Choose a clean circular overview when the priority is strategic context.
- Internal teams: Use a matrix when people need to compare factors, discuss evidence, or prepare a SWOT analysis.
- Teams tracking change: Select a timeline to make developments and monitoring priorities visible.
- Wider internal audiences: Use a poster-style summary for fast orientation, with detail available separately.
Choose for clarity, not novelty. The strongest layout helps each audience grasp the analysis at the right level and see what to do with it next.
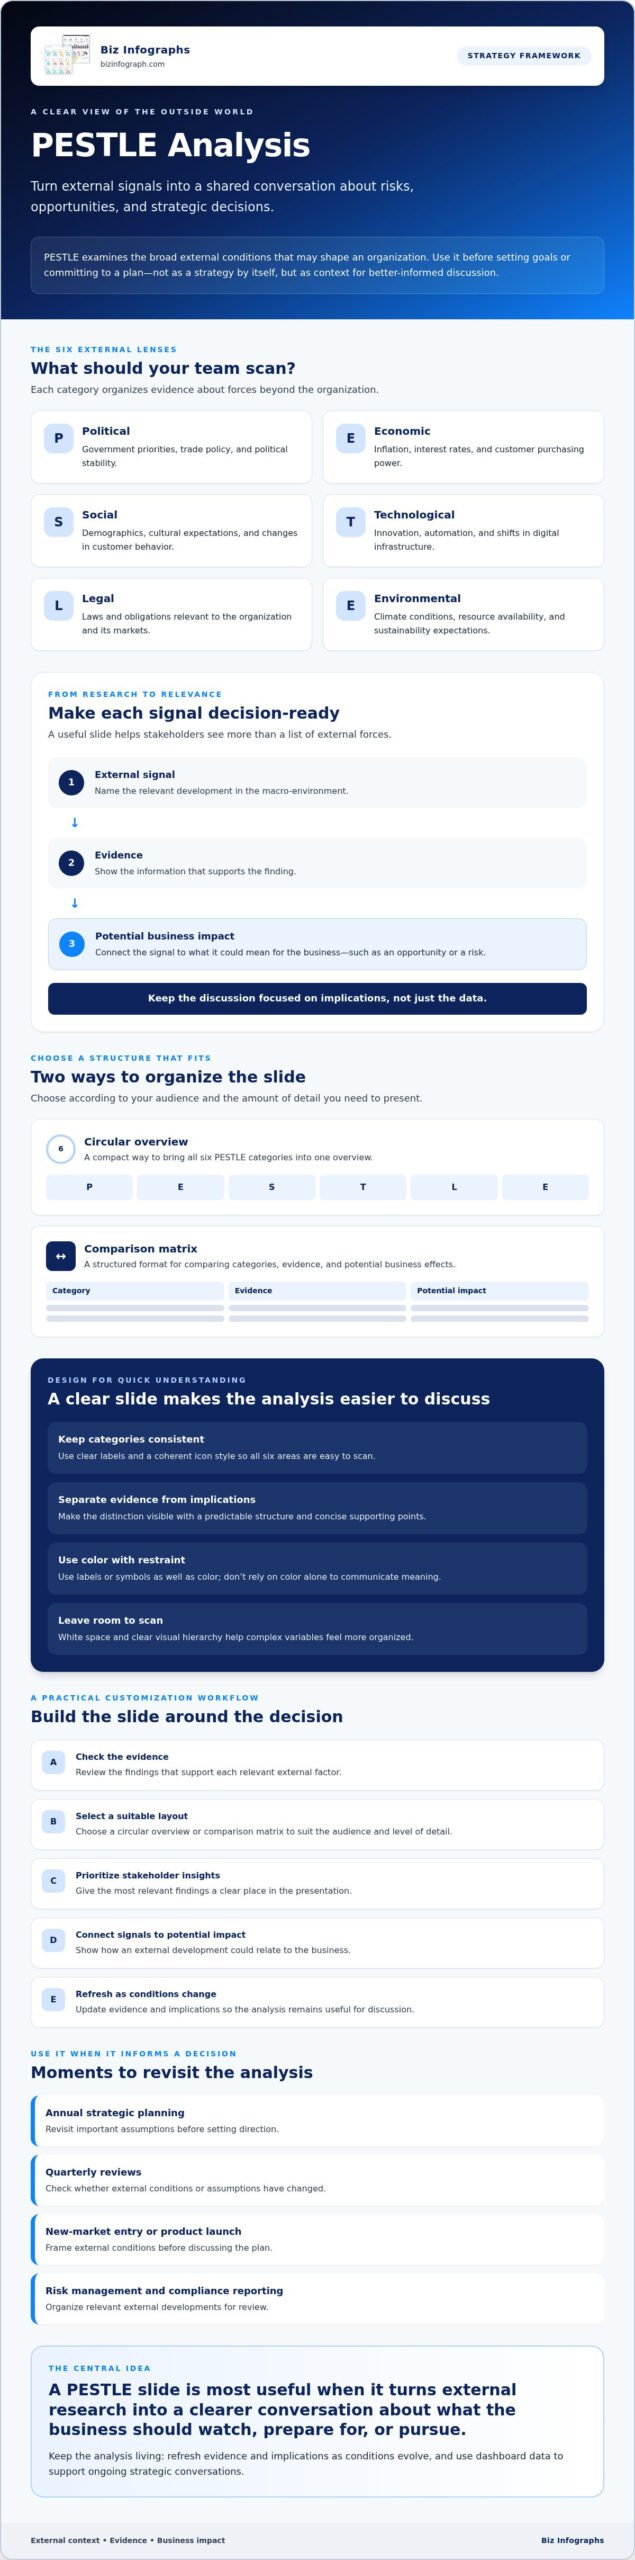
How to Customize Your PESTLE Analysis Template in 5 Simple Steps
A polished PESTLE slide starts with sound analysis, not decoration. Follow these steps to turn relevant business data into a clear, presentation-ready story without building the layout from scratch.
- Audit your evidence. Gather relevant internal data, such as sales trends, customer feedback, and operational reports, alongside external sources like market updates and policy announcements. Record the source and review date for each insight so your team can distinguish current evidence from assumptions.
- Choose a layout for the audience. Match the format to the amount of information and the decision at hand. Use a concise overview for executives, or a more detailed matrix when a team needs to compare factors and implications.
- Write findings as impact statements. Move beyond labels and facts. Explain why a signal matters: “Rising input costs may pressure margins” is more useful than “Economic: input costs.” Keep each point brief, specific, and connected to a business consequence or question.
- Apply your brand system. Use established fonts and colors so the slide feels consistent with the rest of your presentation, while preserving contrast and readability.
- Review visual balance. Check that labels, text, and icons are easy to scan. Give the most decision-relevant factor appropriate emphasis, and remove details that distract from the main message.
Aligning Visuals with Corporate Branding
In PowerPoint, Slide Master can help apply font, color, and layout choices across a deck, reducing repetitive edits. Compare your PESTLE slide with existing business presentation templates and brand guidelines before presenting. Consistency helps stakeholders focus on the analysis instead of adjusting to a new visual style on each slide.
From Excel Dashboards to PPT Slides
Use Excel dashboard templates to organize and review relevant metrics, then bring only decision-useful trends into your PESTLE slide. For example, a change in customer behavior could prompt a reassessment of product positioning, with the dashboard providing supporting evidence. Excel can help track the numbers; PowerPoint can frame what they mean.
PESTLE identifies external opportunities and threats, while SWOT combines those insights with internal strengths and weaknesses to inform strategy. A thoughtfully customized pestle analysis template ppt can make that connection easier to communicate. Explore PowerPoint infographic templates to create a cohesive visual foundation and spend more time refining the strategic story.
The Biz Infographs Advantage: Beyond Generic Presentation Slides
A strategic slide should do more than look polished. It should help people understand the analysis and focus on what it means for the business. Biz Infographs offers PowerPoint, Excel, and Power BI templates for data visualization, helping reduce manual design work so teams can spend more time shaping their insights.
A well-designed pestle analysis template ppt gives complex external factors a clear visual structure, making findings easier to present, even if you’re not a designer. Rather than starting with a blank slide and adjusting shapes one by one, use a prepared layout as a foundation. Then focus on accurate evidence, meaningful implications, and the decisions stakeholders need to discuss.
Empowering Your Professional Pride
High-stakes presentations call for clarity and consistency. A thoughtful layout guides attention through the analysis, while editable content lets you tailor the message to your organization and audience. The design does not replace strategic judgment; it gives your findings a considered way to be seen. By reducing time spent on slide formatting, templates can help you focus on the story behind the data and present it with greater confidence.
Biz Infographs offers visual tools for organizing information and communicating it. Templates include free lifetime updates, so you can access updates to the templates you use over time.
A Complete Strategic Toolkit
PESTLE slides can work alongside data tools rather than sitting apart from them. Use an Excel dashboard to review and summarize relevant measures, then present the strategic implications in PowerPoint. For ongoing metric monitoring, Power BI dashboard templates offer another way to organize business information and support reporting. Dashboards help surface patterns, while presentation slides explain why those patterns matter.
When reporting tools share a consistent visual language, it’s easier for stakeholders to move between analysis and recommendations without losing the thread. Start with your team’s needs, choose templates that suit the way you present and work with data, and adapt them to your brand and decision context.
Explore Biz Infographs’ PowerPoint, Excel, and Power BI templates to build a more cohesive toolkit for presenting strategic insights.
Turn External Insight Into Strategic Confidence
A PESTLE analysis is most valuable when it helps your team make sense of external change before committing to a direction. Choose a layout that fits your audience, keep the design clear, and connect each key finding to its potential business impact. A well-crafted pestle analysis template ppt can help stakeholders focus on those insights instead of a crowded slide.
Professional data visualization can make complex factors easier to discuss, while a consistent presentation design helps you communicate clearly. Pairing PowerPoint slides with Excel or Power BI tools can also support a practical flow from reviewing data to sharing its strategic meaning. Biz Infographs templates include free lifetime updates, helping you keep your tools current over time.
Ready to spend less time formatting and more time shaping your analysis? Explore PowerPoint templates for presenting your PESTLE analysis and build a polished presentation around your findings. Start with a visual foundation that lets you focus on the quality of your thinking.
Frequently Asked Questions
What is the best way to present a PESTLE analysis in PowerPoint?
Present the factors in a consistent layout and connect each important external signal to its possible business effect. Use concise labels, readable text, and a clear distinction between evidence and implications. Choose a circular design for a high-level overview or a grid for side-by-side detail. Close with the key risks, opportunities, or questions leaders should consider, rather than ending with a list of factors.
How do I edit a PESTLE analysis template without design skills?
Start with a pre-designed pestle analysis template ppt and replace the placeholder text with your findings. Keep the existing layout, fonts, and color system unless there’s a clear reason to change them. Use short phrases instead of long paragraphs, and edit the slide’s text and data before adjusting its shapes. Preview the slide in presentation mode to check that everything remains easy to read.
What is the difference between PESTLE and SWOT analysis?
PESTLE examines external forces, while SWOT organizes both internal and external considerations. PESTLE reviews Political, Economic, Social, Technological, Legal, and Environmental factors in the broader environment. SWOT groups findings into strengths, weaknesses, opportunities, and threats. Teams can use PESTLE research to identify possible opportunities and threats, then combine those external insights with an assessment of internal capabilities in a SWOT analysis.
Can I use PESTLE analysis templates for small business planning?
Yes. A small business can use a PESTLE template to organize external issues that may affect a decision, such as entering a new market, changing suppliers, or launching a product. Keep the scope focused on the business question and include only factors that could influence the decision. A concise analysis can help a small team identify assumptions to check and risks or opportunities to monitor without creating unnecessary documentation.
How many factors should I include in each PESTLE category?
There’s no fixed number of findings required for each category. Include the most relevant, well-supported points, and leave a category brief if you find little that affects the decision. As a practical starting point, select a few priority signals per category, then rank them by potential impact and urgency. Avoid filling every space simply to make the slide look balanced; relevance matters more than equal amounts of text.
Are Biz Infographs PESTLE templates compatible with Google Slides?
Compatibility can depend on the specific template file and how Google Slides handles its formatting. Biz Infographs offers downloadable PowerPoint templates, but Google Slides compatibility isn’t confirmed for every template. Before relying on one in a presentation, check the product details for supported formats and test an imported copy. Review fonts, spacing, icons, and other slide elements after importing, since formatting may not transfer exactly as it appears in PowerPoint.
What are the most common mistakes in PESTLE analysis presentations?
Common pitfalls include treating assumptions as verified facts, including too much text, and listing external trends without explaining their business relevance. It’s also easy to focus on one category while overlooking others, or to present the analysis as a permanent snapshot despite changing conditions. Track the source of key findings, keep the slide focused on decision-useful insights, and distinguish observed developments from possible future effects.
How often should a business update its PESTLE analysis?
Review it often enough to keep it useful for current decisions, rather than relying on a fixed schedule alone. A business might revisit the analysis during regular planning reviews and update it sooner if a major market, technology, policy, or customer change could affect its assumptions. Record when key evidence was checked and assign responsibility for monitoring priority factors. That makes updates easier to manage and helps teams spot outdated conclusions.