

A financial presentation isn’t a data dump; it’s a decision tool. To understand how to present financial data to executives, lead with the conclusion, connect the numbers to a business priority, and make the decision or action clear.
The figures matter, but busy leaders need to see what changed, why it matters, and what should happen next without getting buried in detail. A strong update puts the key point first, then uses relevant evidence and clear visuals to support it.
This guide explains how to write message-led slide titles, explain results and variances, and tailor an update’s length and detail to its purpose. You’ll also see how an approval request differs from a routine update, so you can shape the presentation around the decision the room needs to make.
Key Takeaways
- Write slide titles as clear claims so executives can grasp the main message before reviewing the supporting figures.
- Lead with the conclusion, then connect selected financial results to the business decision they inform.
- Match the update’s length and level of detail to its purpose, audience, and time for discussion.
- Make clear whether you’re sharing an update or seeking approval, and frame the next step around the decision required.
1. Writing slide titles that communicate the message
Give each finance slide one central idea, and make its title state the conclusion. A label such as “Revenue and Margin” names a topic but leaves executives to interpret it. A message-led title makes the point: “Revenue grew 12%, while partner discounting reduced margins.” The supporting chart can then show the revenue trend and explain the margin pressure.
Use the same approach when showing cash. “Cash Runway” is a heading, not a takeaway. “A 13-month cash runway means fundraising preparation should begin” links the figure to its business implication. Keep the body focused on evidence for that claim, rather than adding unrelated metrics. In a first editing pass, turn titles into full claims and remove unsupported content; this can reduce a finance deck by about one-third.
Design for a quick read. Use headings of at least 30 points and body text of at least 20 points, then remove details that executives don’t need to understand the message. Define an acronym before its first use, or write the term in full when the short form adds no clarity. Common mistakes include vague titles, unexplained acronyms, crowded slides, and reading every line aloud. These habits make the audience work to find the point.
Choose charts based on the question. A trend line shows movement over time; a variance chart clarifies how actuals differ from budget. Tables work well for exact comparisons, while a simple chart can bring a pattern into focus. Keep visuals clear rather than decorative, and use slides to emphasize key points, not duplicate your spoken script.
Rehearse with a colleague or record a solo run-through. Revise any slide that’s hard to explain without reading its text. Then state the claim, explain the supporting numbers, and pause for questions instead of narrating every chart element. This keeps attention on the financial message and its implications.
2. How Do You Present Financial Results to Executives?
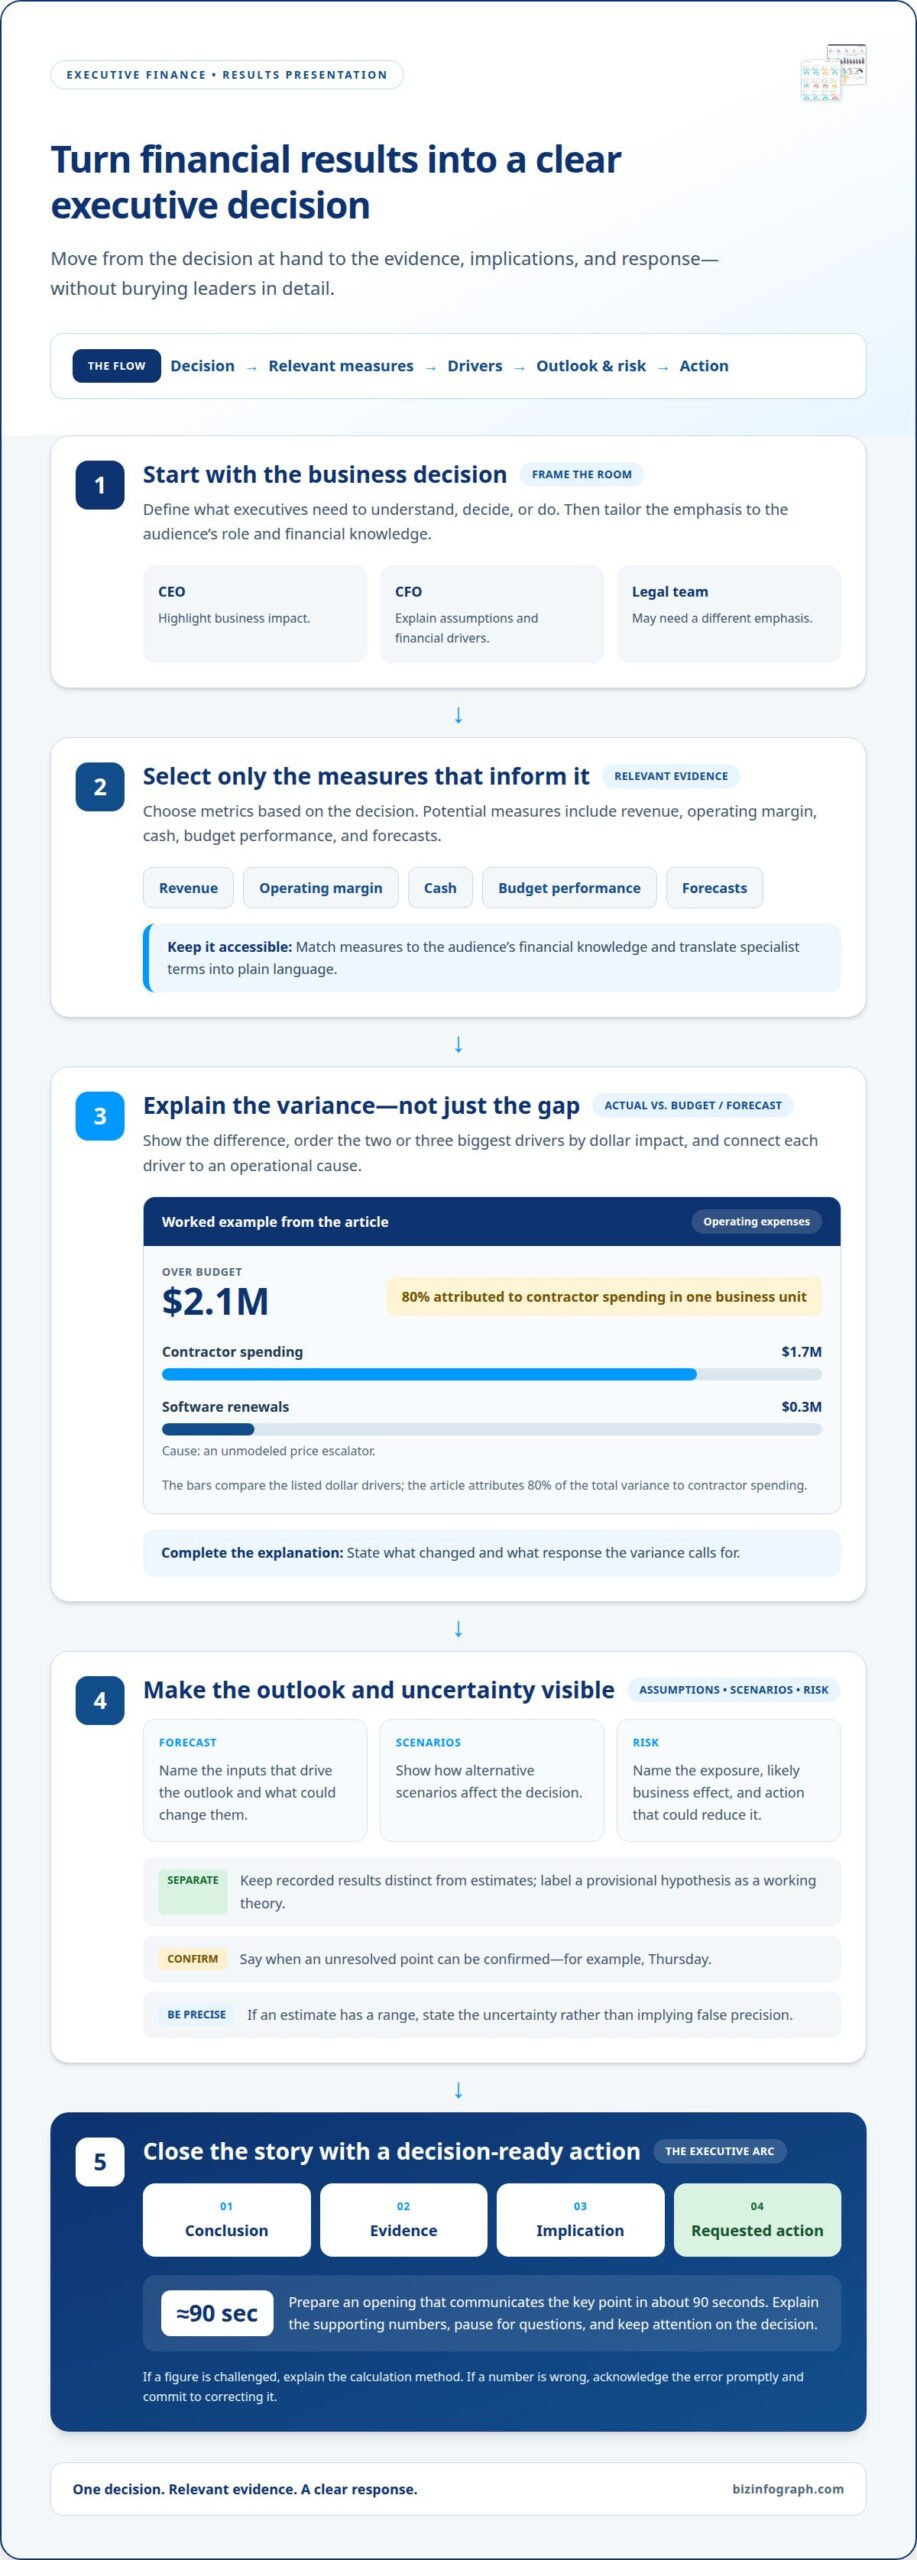
A practical framework for how to present financial data to executives starts with the business decision at hand. The relevant metrics depend on that decision, but revenue, operating margin, cash, budget performance, and forecasts can help frame it. For a CEO, highlight business impact; for a CFO, explain assumptions and financial drivers. A legal team may need a different emphasis. Match each measure to the audience’s financial knowledge, and translate specialist terms into plain language.
For budget-versus-actual and forecast variances, show the gap and explain its main causes. Order the two or three biggest drivers by dollar impact, then connect each to an operational cause. For example, operating expenses were $2.1 million over budget, with 80% of the variance attributed to contractor spending in one business unit. Contractor spending accounted for $1.7 million; software renewals added $0.3 million because of an unmodeled price escalator. Explain what changed and what response the variance calls for.
Show forecast assumptions clearly. Explain which inputs drive the outlook, what could change them, and how alternative scenarios affect the decision. Separate recorded results from estimates, and label a provisional hypothesis as a working theory. State when it can be confirmed, such as Thursday, so executives know what remains unresolved.
Communicate risk by naming the exposure, its likely business effect, and the action that could reduce it. If an estimate has a range, state the uncertainty rather than implying false precision. When someone challenges a figure, explain the calculation method before defending the conclusion. If a number is wrong, acknowledge the error promptly and commit to correcting it.
For teams refining how to present financial data to executives, build a short storytelling arc: conclusion, evidence, implication, and requested action. Prepare an opening that communicates the key point in about 90 seconds, then use a concise summary to orient the room. Practice speaking without relying on notes, and pause at planned points for questions. This helps executives follow the analysis and focus on the decision.
3. Structuring the length and detail of executive updates
Build the presentation around its intended outcome: what should executives understand, decide, or do? A clear structure moves from conclusion to supporting evidence, then implications and next steps. Use a sequential narrative to explain what happened over time, or a thematic structure to group related priorities. In either case, connect each section to the business goals it informs.
Start the executive summary with the conclusion, the central number, and the recommendation. Arrange the main points so each advances the explanation: performance, its drivers, the outlook, and the action required. For example, a forecast update might open with the expected direction, explain the assumptions behind it, then show the decision needed. This gives participants a useful frame before they review detailed financial statements or appendix material.
Choose depth based on the meeting’s purpose and time. Executive updates are often scheduled for 15 to 30 minutes, with about five minutes used for presenting and the rest for discussion. For a focused presentation, key messages may take 10 to 20 minutes, supported by about 6–8 slides. Most financial presentations contain between 10 and 20 slides, depending on depth and purpose. Treat these as different planning contexts, not a reason to fill every available minute or slide.
For a board meeting, identify the two to three slides that matter most and keep the full pack available as an appendix. A concise, bullets-only version can outline key points and their implications, while detailed statements support follow-up questions. Limit each slide to no more than 5–6 bullet points; move backup calculations and secondary breakdowns out of the main flow.
Before the meeting, check that every update earns its place. Does it explain a change, reveal a risk, or advance a decision? If not, remove it or move it to supporting material. This edit keeps the story coherent, protects discussion time, and helps executives leave with a clear outcome rather than disconnected figures.
4. Financial presentations for different business purposes
First, label the presentation clearly: is it an update, a decision request, or a strategic discussion? An update explains actual performance against plan and what has changed. An approval request should state the choice executives need to make, its financial implications, and the timing. This distinction helps the room prepare for the right conversation instead of treating every deck as a routine status report.
For a board decision, present options without steering members toward an unexplained outcome. Compare each option using consistent measures, such as expected impact, key assumptions, risks, and resources required. Then make your recommendation and explain the evidence behind it. For example, a fundraising presentation might state that fundraising needs to begin by December to avoid breaching runway targets. The strategic takeaway is the timing decision, not simply the cash figure.
A performance update calls for a different emphasis. Show actual results against the relevant target, identify the factors behind the movement, and explain whether management should act or keep monitoring. Use visuals to make trends and comparisons easy to interpret, and connect each chart to a business consequence. For a forecast discussion, distinguish the base outlook from the assumptions that could change it, then show how those assumptions affect the decision ahead.
Close each presentation with a forward-looking summary. For an update, name the next milestone and who owns it. For an approval request, restate the decision, the available options, and the action that follows approval. Invite feedback when the board needs to weigh trade-offs, and provide the report and supporting documents after the meeting. To strengthen the visual story across different business purposes, use clear financial presentation visuals that keep the evidence connected to the decision.
Biz Infographs
Biz Infographs helps turn financial information into clear, presentation-ready visuals, making it easier to organize results around executive decisions. When you’re shaping an update, approval request, or strategic review, PowerPoint Infographic Templates can help structure the story, while Excel Dashboard Templates, Power BI Templates, Excel Charts, and Automation Templates support different parts of your data workflow. Choose the format that fits your reporting process, then apply the same principles throughout: show the key insight, clarify what the numbers mean, and connect them to the next action. These resources can reduce the design work involved in preparing polished financial updates, while keeping attention on the business message. Contact Biz Infographs to discuss the templates and tools that fit your presentation needs.
Make your next financial update even more useful
Use each presentation to improve the decision process, not just the deck. After the meeting, note which questions revealed a gap in context, which analysis moved the discussion forward, and what information leaders needed sooner. These observations can shape the next update and make financial communication more responsive to your organization’s priorities.
A repeatable approach to how to present financial data to executives can also help teams work consistently across departments. Keep refining how financial insights connect to business choices, and adapt the format as priorities change. The goal isn’t simply a polished presentation; it’s a clearer path from financial understanding to confident action.
If you’re ready to strengthen the visual presentation of your financial information, contact Biz Infographs to discuss your presentation. Take the next step with a focused message and a format that helps your work make an impact.
Frequently Asked Questions
How Do You Present Financial Results to Executives?
Lead with the business consequence, then show the evidence executives need to assess it. For example, if sales increased but collections slowed, distinguish booked revenue from cash received and explain the operational implication. Use familiar terms, define specialized measures, and finish by stating what decision or follow-up the information supports. This makes the results easier to interpret and discuss.
How do I make a finance deck less dense?
Remove content that doesn’t change the interpretation or next step. Move detailed reconciliations, definitions, and secondary breakdowns into an appendix, then keep the clearest evidence in the main slides. Replace repeated tables with a comparison or visual when it makes the pattern easier to see. Before presenting, review each slide and ask whether its information is essential to the discussion.
How do I present bad news to a CFO?
State the unfavorable result plainly, then separate its cause, financial effect, and proposed response. For example, explain whether a missed target reflects timing, lower demand, or higher costs, and distinguish confirmed results from estimates. Don’t bury the issue among positive updates. A CFO can assess the situation more effectively when the assumptions and available choices are clear.
How much detail should I include in a finance presentation?
Include enough detail to support the specific decision, but keep technical backup accessible for follow-up. A routine performance review may need trend context and explanations for meaningful changes; an approval request may need assumptions, alternatives, and implications. If a detail won’t affect the conclusion or action, put it in supporting material rather than the main presentation.
What should I do if an executive challenges my numbers?
Stay composed and trace the figure to its source, reporting period, and calculation. Clarify whether the disagreement concerns a definition, timing, or underlying data, then reconcile the difference before returning to the business implication. If you find an error, acknowledge it directly and provide the corrected figure. A transparent explanation is more useful than defending a number before resolving the discrepancy.
How to summarize financial results on one page or dashboard?
Give the page a clear reporting period and organize it around the measures that answer the business question. A practical layout might place headline performance at the top, comparisons and key drivers beside it, and forecast context below. Label units and distinguish actual results from projections. Keep detailed transactions out of the overview so readers can quickly identify what needs attention.