In the realm of financial well-being, few factors are as pivotal as understanding your cash flow. It’s the lifeblood of any financial endeavor, be it a thriving business, an investment portfolio, or your personal finances. But understanding cash flow isn’t just about knowing the numbers; it’s about gaining a clear and actionable insight into the financial pulse of your endeavors.
This is where the power of cash flow dashboards comes into play. Beyond mere spreadsheets, these dashboards are the ultimate tool for mastering financial health.
They don’t just display numbers; they breathe life into your financial data, providing a dynamic, real-time, and visually engaging way to monitor, analyze, and make informed decisions about your cash flow.
Understanding Cash Flow
Before we dive into the intricacies of cash flow dashboards, let’s start with the fundamentals: understanding cash flow itself. It’s more than just the money coming in and going out; it’s the rhythm of your financial heartbeat. The ebb and flow of your resources can dictate your ability to grow, invest, and secure your financial future.
3. The Significance of Visualizing Cash Flow
Understanding cash flow in theory is one thing, but seeing it in action is where the real magic happens. Here’s why the visualization of cash flow is of paramount importance:
Why Visualization Matters
Imagine staring at a page filled with numbers and trying to discern the financial health of a business or the effectiveness of an investment. It’s a daunting task, even for seasoned professionals. Visualization simplifies this complexity. By translating numbers into charts, graphs, and interactive displays, cash flow dashboards bring clarity to financial data.
Benefits of Cash Flow Dashboards
Cash flow dashboards offer a host of benefits that extend beyond mere data representation:
Immediate Insights:
Dashboards provide real-time or periodic snapshots of your financial situation. With a single glance, you can gauge the health of your cash flow, identifying any impending issues or opportunities.
Detecting Patterns:
Whether it’s identifying seasonal fluctuations or recognizing areas where expenses are consistently high, detecting patterns can inform your financial decisions.
Enhanced Decision-Making:
When you can see the consequences of your financial choices in real-time, decision-making becomes more informed and agile. You can adjust your strategies quickly, capitalizing on opportunities and mitigating risks.
Communication and Collaboration:
Cash flow dashboards are invaluable tools for conveying financial information to stakeholders, whether they’re investors, team members, or clients. The visual nature of dashboards simplifies complex financial concepts, fostering better understanding and collaboration.
4. Types of Cash Flow Dashboards
Cash flow dashboards come in different flavors, each designed to serve specific purposes. Understanding the types available can help you select the one that best aligns with your financial goals:
Historical Cash Flow Dashboards
Retrospective Analysis:
Historical cash flow dashboards focus on past financial data. They provide insights into how cash has been managed over a specified period. This type is valuable for understanding financial performance, identifying trends, and learning from past successes and mistakes.
Use Cases:
- Business owners can use historical dashboards to assess the financial health of their company over previous quarters or years.
- Investors can analyze past cash flow to evaluate the performance of their investment portfolio.
Forecasting Cash Flow Dashboards
Proactive Planning:
Forecasting dashboards look ahead, providing insights into expected cash flow based on various assumptions and scenarios. They are powerful tools for proactive financial planning and risk management.
Use Cases:
- Business leaders can use forecasting dashboards to plan for future expenses, revenue projections, and resource allocation.
- Individuals can forecast their personal cash flow to ensure they meet financial goals.
5. Components of a Cash Flow Dashboard
Cash flow dashboards are multifaceted tools designed to provide a comprehensive view of your financial health. To effectively utilize them, it’s essential to understand the key components that make up these dashboards. Let’s explore these components in detail:
Income:
Revenue Streams:
This section of your dashboard focuses on all the sources of income. It can include revenue from sales, investments, rentals, or any other income streams relevant to your financial situation.
Income Trends:
Visualizing income trends helps you identify the consistency and growth patterns in your revenue streams. This can be crucial for making decisions about expanding income sources or optimizing existing ones.
Expenses:
Expense Categories:
Here, you’ll find a breakdown of your expenses into categories such as operational costs, salaries, utilities, and more. Categorizing expenses makes it easier to identify areas where cost-cutting measures may be needed.
Expense Trends:
Tracking the trends in your expenses helps you identify whether costs are increasing, decreasing, or remaining stable over time. This information can guide your budgeting and financial planning.
Net Cash Flow:
The Bottom Line:
The net cash flow component provides a clear picture of your overall financial health. It calculates the difference between your income and expenses, indicating whether you’re running a surplus or a deficit.
Cash Flow Projections:
Some dashboards offer projections based on your current income and expense trends. This allows you to anticipate your financial position in the coming months and make proactive decisions.
Visualization Tools:
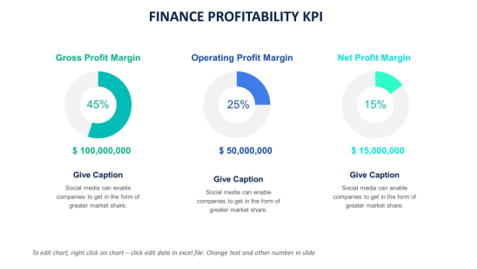
Charts and Graphs:
Visual elements like bar charts, line graphs, and pie charts are used to represent your financial data in a more understandable and engaging format. These visual aids help you quickly grasp the overall financial landscape.
Color-Coding:
Many dashboards use color-coding to highlight specific data points or trends. For example, red might signify financial concerns or losses, while green represents positive cash flow or growth.
Interactive Features:
Some dashboards include interactive features that allow you to drill down into specific data points. This can be helpful when you want to investigate particular income sources or expense categories in more detail.
Customization and Flexibility:
Tailoring Your Dashboard:
The best cash flow dashboards are customizable to fit your unique financial situation. They allow you to add or remove components, adjust data sources, and modify visual elements.
Alerts and Notifications:
Customization can also extend to setting up alerts and notifications. You can configure your dashboard to notify you when specific financial thresholds are met or exceeded.
Understanding these components is crucial for effectively using your cash flow dashboard. Each element serves a specific purpose, allowing you to make informed financial decisions.

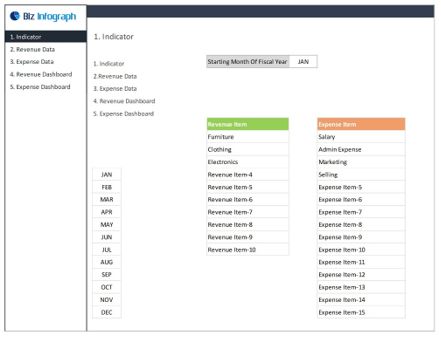
Budget-dashboards
6. Building Your Cash Flow Dashboard
Creating your cash flow dashboard might sound like a complex task, but with the right tools and guidance, it becomes an achievable endeavor. Here’s how you can build your personalized cash flow dashboard:
Tools and Software:
Choosing the right tools is essential. Fortunately, there are various software options and platforms available that make creating dashboards user-friendly. Some popular choices include Microsoft Excel, Google Sheets, specialized financial software like QuickBooks, and dedicated dashboard-building tools like Tableau or Power BI.
Design and Customization:
Once you’ve selected your preferred software, it’s time to start designing your dashboard:
Choose a Template or Start from Scratch:
Many software programs offer pre-designed templates that you can customize to suit your needs.
Select Visual Elements:
Decide on the types of charts, graphs, and visual elements you want to include. Common choices include bar charts, line graphs, pie charts, and gauges. The selection depends on what best represents your financial data.
Data Integration:
Integrate your financial data sources. This can involve linking your dashboard to your accounting software, importing data from spreadsheets, or connecting to external data feeds. The goal is to ensure that your dashboard displays accurate and up-to-date information.
Real-Time vs. Periodic Updates:
Cash flow dashboards can be set up for real-time updates or periodic updates, depending on your preferences and needs:
Real-Time Dashboards:
Real-time dashboards continuously update data, providing an immediate view of your financial situation. They also offer up-to-the-minute insights, such as e-commerce stores or stock traders.
Periodic Dashboards:
Periodic dashboards are updated at regular intervals, such as daily, weekly, or monthly. They are a good choice for individuals and businesses that don’t need constant real-time data but still want a comprehensive overview.
Remember that while building your dashboard, you have the flexibility to tailor it to your specific requirements. You can add or remove components, choose the color scheme, and arrange elements for maximum clarity.
7. Interpreting Your Cash Flow Dashboard
Creating a cash flow dashboard is just the beginning. To truly master your financial health, you need to know how to interpret the data it presents. Here’s how to make sense of the information displayed:
Identifying Trends:
Historical Trends:
Start by examining historical trends. Look for recurring patterns, such as seasonal fluctuations in revenue or predictable expense cycles. Understanding these trends can help you anticipate future financial challenges.
Comparative Analysis:
Compare your current data to past periods or industry benchmarks. Are you outperforming your previous quarters, or is there room for improvement? Comparative analysis provides context for your financial performance.
Analyzing Peaks and Valleys:
Cash Flow Peaks:
Peaks in your cash flow can indicate periods of financial strength. These are the times when you have surplus cash that can be used for investments or expansion.
Cash Flow Valleys:
Valleys represent periods of financial strain. They may signal the need to cut costs, secure additional financing, or develop strategies for revenue growth.
Making Informed Decisions:
Your cash flow dashboard is a tool for making data-driven decisions. Whether it’s optimizing your expenses, exploring new income streams, or planning for future investments, the insights gained from your dashboard guide your financial choices
.
8. Real-Time vs. Periodic Updates
The frequency of updates for your cash flow dashboard is a critical decision. It impacts how you use the dashboard and the insights you can gain. Here’s a closer look at the pros and cons of real-time and periodic updates:
Pros of Real-Time Updates:
Immediate Insights:
Real-time dashboards provide you with immediate insights into your financial situation. If you run a business that experiences rapid changes in cash flow, such as an e-commerce store, real-time updates can help you react swiftly to market dynamics.
Timely Decision-Making:
Real-time dashboards enable timely decision-making. For example, if you notice a sudden drop in sales, you can take immediate action, such as adjusting marketing strategies or optimizing inventory levels.
Cons of Real-Time Updates:
Data Overload:
Real-time dashboards can sometimes overwhelm users with continuous data updates. It’s crucial to strike a balance between timely information and avoiding information overload.
Resource Intensive:
Maintaining a real-time dashboard requires more resources, including data integration and processing. This may not be feasible for smaller businesses or individuals.
Pros of Periodic Updates:
Steady Analysis:
Periodic dashboards provide a steady stream of analyzed data at regular intervals, making it easier to assess trends and patterns without the noise of constant updates.
Resource Efficiency:
They are less resource-intensive since data updates occur at predetermined intervals. This can be cost-effective and more manageable for many users.
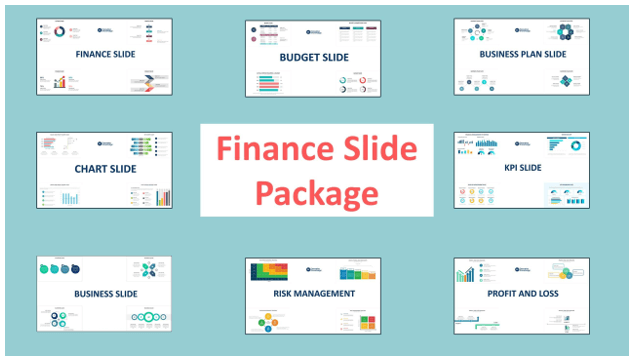
Finance-management-slides
Cons of Periodic Updates:
Limited Real-Time Insight:
Periodic dashboards don’t provide immediate real-time insights, which can be a drawback if your financial situation requires constant monitoring.
Delayed Action:
Decisions based on periodic updates might be slightly delayed compared to real-time dashboards, potentially affecting certain scenarios where swift action is required.
Ultimately, the choice between real-time and periodic updates depends on your specific needs and preferences. If you’re managing a dynamic business with rapid cash flow changes, real-time updates may be the way to go. However, for most individuals and businesses, periodic updates strike the right balance between timely insights and resource efficiency.
Mastering your financial health is a journey, and cash flow dashboards are your trusted companions on this path. These powerful tools provide a visual, real-time representation of your financial landscape, enabling you to understand, analyze, and act upon your cash flow with precision.
Ready to unlock the full potential of your financial health? Discover the ease and power of professionally designedcash flow dashboards and templates at Biz Infograph. Elevate your financial management to new heights. Explore our Cash Flow Dashboard Templates now.