
In today’s fast-paced and ever-evolving business landscape, data-driven decision-making is crucial for companies seeking to stay ahead of the competition. Yearly comparison reports play a pivotal role in providing valuable insights into a company’s performance, growth trajectory, and overall financial health over time.
By analyzing year-on-year data, companies can identify trends, patterns, and areas for improvement, enabling informed strategic planning and goal setting. In this long-form blog, we will delve into the importance of creating yearly comparison reports and how they empower businesses to make data-driven decisions.
Let’s explore the key reasons why companies should prioritize the development of these reports and unlock the power of financial dashboards and reporting templates.
Evaluating Performance and Progress
Yearly comparison reports act as a barometer of a company’s performance and progress over time. By comparing financial data, sales figures, and key performance indicators (KPIs) from one year to the next, businesses gain a comprehensive understanding of their growth trajectory. These reports highlight areas of improvement and reveal the impact of implemented strategies and initiatives.
Whether it’s revenue growth, cost-saving measures, or customer retention rates, yearly comparison reports enable companies to assess their performance objectively and identify successes and challenges.
Identifying Seasonal Trends and Patterns
For many businesses, operations are influenced by seasonal fluctuations and market trends. Yearly comparison reports allow companies to analyze these seasonal patterns and understand how they impact their performance.
For instance, a retail company may observe higher sales during the holiday season and lower sales during the summer months. Identifying such trends helps businesses make informed decisions about inventory management, marketing strategies, and resource allocation throughout the year.
Detecting Anomalies and Irregularities
Yearly comparison reports play a vital role in detecting anomalies and irregularities in financial data. Sudden spikes or drops in revenue, unexpected expense patterns, or discrepancies in profit margins can be easily identified through year-on-year comparisons.
Detecting these anomalies early enables companies to investigate the root causes and implement corrective actions promptly. This proactive approach helps mitigate potential financial risks.
Tracking Goal Achievement
Yearly comparison reports serve as a yardstick for measuring progress toward set goals and targets. Companies can assess whether they have met or exceeded their objectives over the course of a year. Armed with this knowledge, businesses can adjust their strategies and set more realistic and achievable goals for the future.
Informing Strategic Planning
Data-driven strategic planning is fundamental to a company’s growth and long-term success. Yearly comparison reports provide a comprehensive view of past performance, enabling companies to identify opportunities and challenges for the upcoming year.
Armed with insights from the reports, businesses can make informed decisions about resource allocation, investment opportunities, market expansion, and product development.
Facilitating Stakeholder Communication
Yearly comparison reports play a pivotal role in facilitating communication with stakeholders, including investors, board members, and key decision-makers. These reports provide a clear and concise overview of a company’s financial performance and growth trajectory.
Visual aids, such as financial dashboards and reporting templates, enhance the readability and understanding of complex data for stakeholders with varying levels of financial expertise.
Compliance and Regulatory Requirements
For publicly traded companies or those subject to regulatory oversight, yearly comparison reports are essential for compliance and reporting obligations. These reports help ensure that companies meet financial disclosure requirements and provide accurate and transparent information to regulatory authorities and investors.
Yearly comparisons demonstrate a company’s commitment to financial transparency and responsible corporate governance.
Enhancing Operational Efficiency
Yearly comparison reports not only provide a comprehensive analysis of financial performance but also offer valuable insights into operational efficiency. By comparing expenses, revenue streams, and resource allocation across different years, companies can identify areas where operational efficiency can be improved.
This may include optimizing supply chain management, streamlining production processes, or identifying cost-saving opportunities.
Monitoring Marketing Effectiveness
Marketing efforts are a significant driver of business success, and yearly comparison reports play a crucial role in evaluating marketing effectiveness. By comparing sales data, lead generation, and customer acquisition metrics year-on-year, companies can assess the impact of marketing campaigns and strategies.
These insights allow businesses to make data-driven decisions to allocate marketing budgets effectively and invest in the most successful initiatives.
Understanding Customer Behavior
Yearly comparison reports offer valuable insights into customer behavior and preferences over time. By analyzing customer data, including purchasing patterns, feedback, and churn rates, companies can understand changing customer needs and preferences.
Businesses can then tailor their products and services to meet customer expectations, fostering customer loyalty and retention.
Supporting Financial Forecasting
Accurate financial forecasting is vital for prudent financial planning and resource allocation. Yearly comparison reports provide historical data that can be used as a basis for financial forecasting. By identifying revenue and expense trends, companies can make more accurate projections for the future, enabling them to set realistic financial goals and allocate resources strategically.
Identifying Industry Trends and Competitor Analysis
Yearly comparison reports not only provide insights into a company’s performance but also enable businesses to analyze industry trends and monitor competitor activity. By comparing market trends and competitor performance over time, companies can adapt their strategies to stay ahead of the competition. This proactive approach allows businesses to identify emerging opportunities and potential threats in the market.
The Role of Financial Dashboards and Reporting Templates
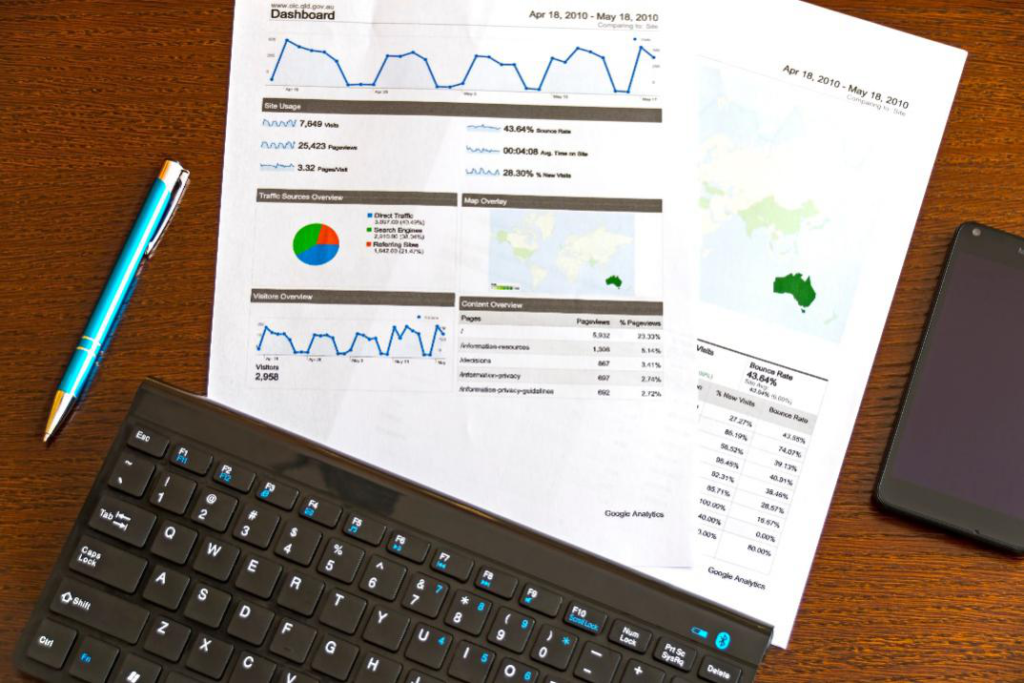
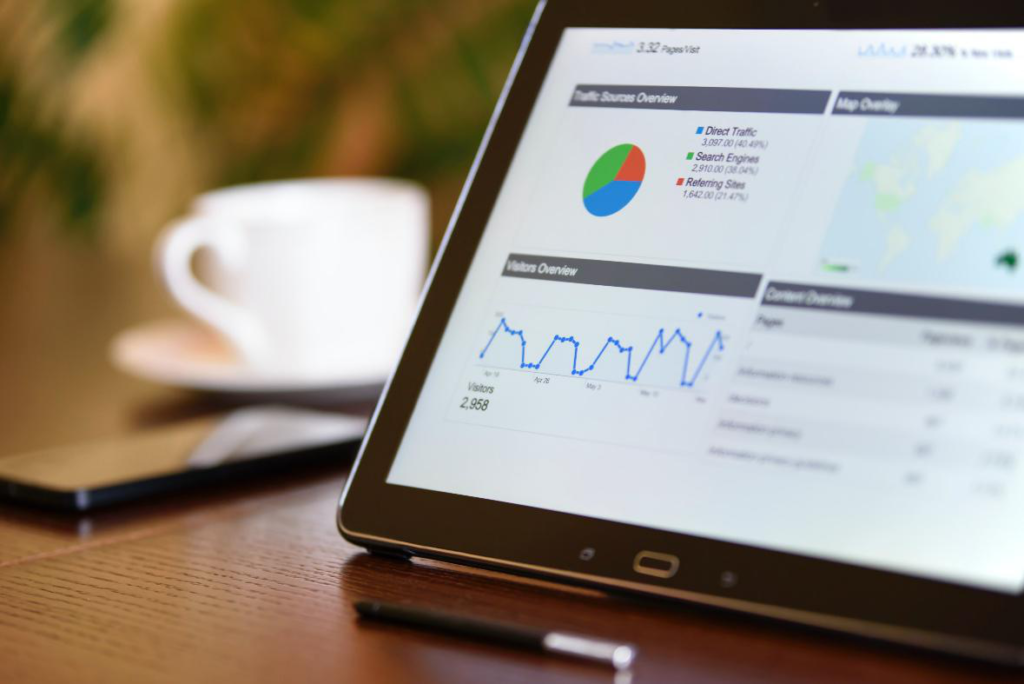
Financial dashboards and reporting templates play a crucial role in simplifying the process of creating yearly comparison reports. These tools aggregate data from various sources and present it in a visual and user-friendly format. With pre-designed templates, companies can save time and effort in generating reports, allowing finance teams to focus on analyzing data and drawing meaningful insights.
Financial Dashboard Templates enable real-time monitoring of key metrics, ensuring that decision-makers have access to up-to-date information for strategic planning and timely actions.
Unlock the Power of Yearly Comparison Report Templates with Biz Infograph
Yearly comparison reports are indispensable tools for companies seeking to make data-driven decisions, assess their performance, and plan for the future strategically.
By informing strategic planning and facilitating stakeholder communication, yearly comparison reports become essential components of a company’s growth journey. Leveraging Financial dashboards and reporting templates, companies can streamline the reporting process and unlock valuable insights from their data. Embrace the power of yearly comparison reports to propel your business forward, make informed decisions, and achieve long-term success in a dynamic and competitive market.

To harness the full potential of yearly comparison reports and streamline your reporting process, explore the financial dashboard and reporting templates offered by Biz Infograph. Our professionally designed templates enable you to present data in a visually appealing and impactful manner, empowering your company to make data-driven decisions confidently.
Start creating comprehensive yearly comparison reports with ease today and pave the way for your company’s continued growth and success.