Introduction to Sales KPI Dashboards in Power BI
What Is a Sales KPI Dashboard in Power BI?
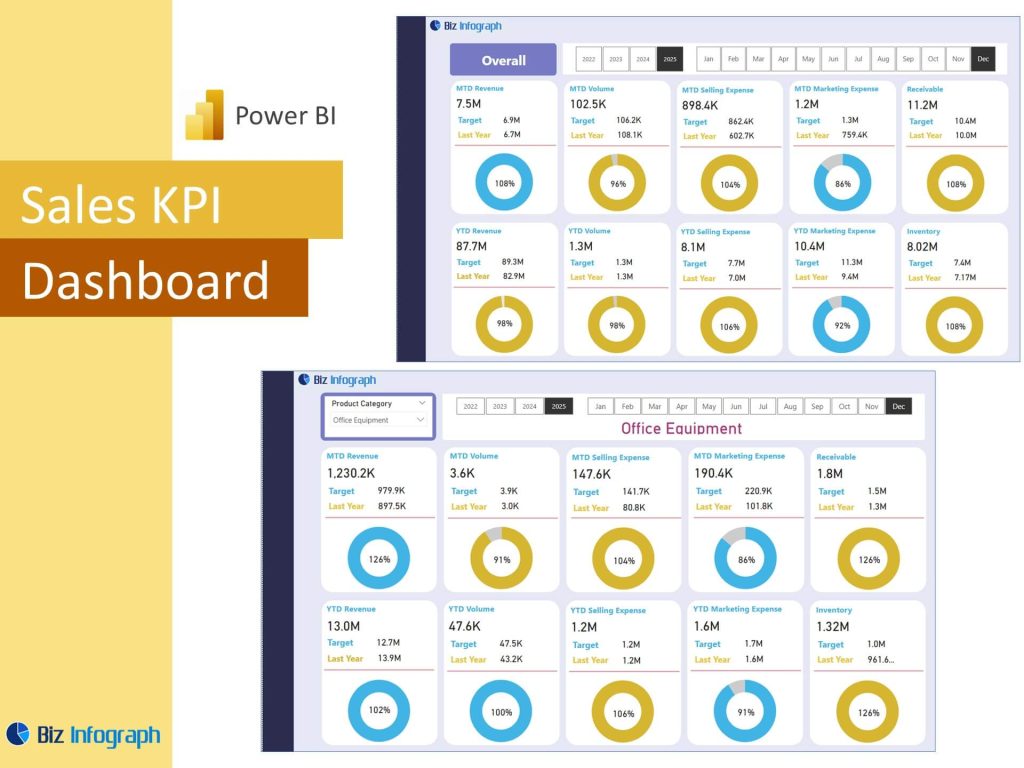
A Sales KPI Dashboard in Power BI is an interactive tool that allows organizations to track, visualize, and analyze sales KPIs in real-time. Built on Microsoft Power BI, these dashboards help teams monitor performance by showing metrics such as sales revenue, sales leads, and the number of sales opportunities. With the use of Power BI’s visualization capabilities and dashboard features, sales teams can gain a holistic view of their pipeline, goals, and outcomes. Whether using a pre-built Power BI template or designing a custom report, a well-structured power bi sales dashboard is key to data-driven sales strategy.
Benefits of Using Microsoft Power BI for Sales KPIs
Power BI is a powerful analytics platform that simplifies the process of tracking sales and building scalable dashboards. It enables users to pull from various sources, such as CRMs, Excel, or SQL, and organize the data into visual stories. The Power BI Service allows for real-time collaboration and access to live dashboards across departments. By using tools like Power Query Editor to transform raw data, businesses can deliver consistent insights that improve performance. The use of Power BI dashboard examples helps reduce development time and ensures the final product meets the needs of sales reps, analysts, and executives alike.
Importance of KPI Dashboards in Sales Management
For sales representatives and managers, visibility into real-time KPIs is essential. A kpi dashboard in Power BI provides performance transparency and supports timely decisions. Whether tracking average sales, team quotas, or pipeline health, KPI dashboards help connect activity to outcomes. These tools guide sales strategies, motivate reps, and align daily actions with strategic goals. A well-implemented power bi kpi dashboard ensures that all stakeholders can track sales, assess sales growth, and pivot quickly when trends change. Sales KPI dashboards also support coaching and accountability across the sales organization.
Core Components of a Sales KPI Dashboard
Essential Sales KPIs and Metrics to Track
Core metrics on a sales kpi dashboard typically include sales revenue, win rate, pipeline coverage, product sales, and deal velocity. Tracking the number of sales opportunities, lead response time, and deal aging are also crucial. These metrics help identify what’s driving growth and where improvements are needed. Power BI’s dynamic visualizations make it easy to interpret these KPIs through charts, gauges, and slicers. An effective KPI suite supports agile decision-making, helps prioritize activities, and enhances alignment between reps and revenue goals.
Key Features of a KPI Dashboard in Power BI
A successful kpi dashboard in Power BI includes interactive visuals, real-time data updates, data visualization, and role-specific filters. It supports drill-downs from summary views to detailed records, enabling users to analyze sales trends across territories, teams, and timeframes. Dashboards created with Power BI templates often include pages for sales activities, sales analytics, and account overviews. These dashboards are designed to be user-friendly and mobile-responsive. With Power BI’s automation features and custom DAX formulas, your dashboard becomes more than a report—it becomes a decision-support system.
Common Sales Dashboard Examples Across Teams
Sales dashboard examples vary depending on the audience. For executives, dashboards may focus on sales revenue, growth, and targets. For sales reps, dashboards might emphasize daily activities, open opportunities, and close rates. Sales managers often use power bi sales dashboard examples to compare rep performance or forecast against goals. Examples like the financial dashboard or analytics dashboard offer additional perspectives by blending sales with cost and ROI data. Studying examples of Power BI KPI dashboards helps organizations tailor layouts, visuals, and metrics to support different teams.
Creating a KPI Dashboard in Power BI
How to Create a Sales KPI Dashboard in Power BI
To create a Power BI KPI dashboard, begin by identifying key metrics and the relevant data source. Use Power Query to clean and integrate your data, then build visuals using cards, graphs, and tables. Apply conditional formatting and filters to enhance usability. Structure your report into logical sections such as sales overview, pipeline, and rep performance. Publishing to the Power BI Service enables team-wide access. By using a Power BI template, you can accelerate setup and ensure your dashboard meets best practice standards.
Using Power BI Templates and KPI Dashboard Examples
Templates are a valuable resource for fast and consistent dashboard development. Many Power BI dashboard examples include layouts and logic specifically built for sales tracking. These templates for Power BI can be imported directly and customized with your data. They often include sections for KPIs, sales performance, and sales pipeline analytics. Reviewing great Power BI dashboard examples ensures your report meets functional and design expectations. These templates help teams reduce time to insight and avoid reinventing the wheel.
Best Practices for Designing Sales Performance Dashboards
When designing a sales performance dashboard, clarity and relevance are key. Start with clearly defined goals and align visuals to those objectives. Use summary KPIs at the top and drill-throughs for detailed exploration. Follow visual design principles to avoid clutter—use color to highlight changes, and white space to improve readability. Consider user roles and access levels when building pages. Power BI offers features like bookmarks, tooltips, and report themes that enhance user experience. Following these best Power BI dashboard examples ensures your dashboard is effective, maintainable, and impactful.
Advanced Use Cases and Integration
Integrating Sales KPI Dashboards with the Power Platform
The Power Platform allows you to extend your Power BI KPI dashboard functionality. Integrate with Power Automate to trigger alerts when sales targets are missed or opportunities go stale. Use Power Apps to update CRM records directly from your dashboard. These integrations allow for an end-to-end workflow from insight to action. This advanced use case empowers sales teams to stay proactive and responsive.
Sales Pipeline Tracking with KPI Dashboards
Tracking the sales pipeline is one of the most critical functions of a Key Performance Indicator dashboard. By visualizing the stages, conversion rates, and bottlenecks, managers can optimize efforts and increase sales. KPI dashboards show whether reps are generating enough pipeline to meet future quotas and identify where deals get stuck. Combining this with sales analysis metrics ensures your dashboard provides a visual story of progress and performance.
Real-World Power BI Sales Dashboard Examples
Looking at examples of Power BI dashboards used by real businesses provides inspiration and benchmarks. These Power BI sales dashboard examples highlight how organizations align KPIs with strategy, visualize sales trends across markets, and identify top-performing reps. Case studies often showcase integration with CRM, marketing, and finance systems, demonstrating how Power BI data supports holistic analysis. These dashboard shows are invaluable for learning and evolving your own BI strategy.
Use Power BI to build an interactive dashboard that provides deep data analysis, tracks overall sales, highlights total sales metrics, visualizes sales trends, and serves as an effective management dashboard for understanding key sales data and performance insights.
For ready-to-use Dashboard Templates: