Introduction to Revenue Budget vs Actual Dashboard in Power BI
What is a Revenue Budget vs Actual Dashboard?
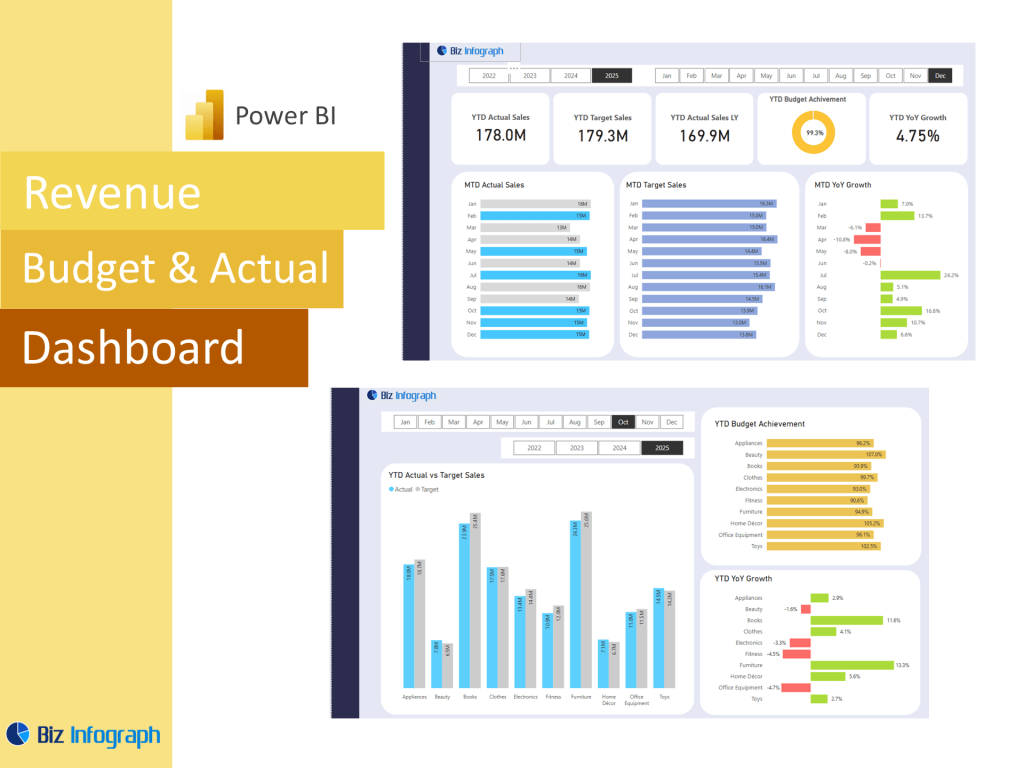
A Revenue Budget vs Actual Dashboard is a specialized Power BI dashboard that allows finance teams and decision-makers to compare actual revenue performance against budgeted targets. By using a Power BI template, businesses can visualize actual sales, actual revenue, and actual expenses in comparison to budget data, providing a clear picture of financial performance. These dashboards show how actual figures align with projected outcomes, enabling data-driven decisions. Whether using a sales budget vs actual dashboard or a broader revenue vs budget view, this dashboard offers critical insights for optimizing revenue generation and monitoring annual recurring revenue. Microsoft Power BI enables easy integration with financial systems and CRM dashboards, allowing teams to track actual results and analyze revenue trends across different periods.
Why Use Power BI for Revenue Analysis?
Power BI is a leading business intelligence platform that provides dynamic capabilities for budget vs actual analysis. It enables users to create interactive Power BI dashboards for tracking revenue growth, recurring revenue, and sales performance by comparing actual to forecasted results. With tools like Power Query Editor, users can transform budget data and actual sales into actionable insights. Power BI offers seamless integration with various data sources, allowing users to pull actual income and expenses from systems like CRM dashboards or financial dashboards. Its analytics dashboard features, combined with Power BI templates, provide a fast, efficient way to create dashboard examples that suit unique business needs. Teams can use Power BI to monitor revenue generation, understand actual performance data, and adjust strategies based on real-time insights.
Key Features of a Revenue Budget vs Actual Dashboard
Core Metrics to Track: Revenue, Budget, and Actual Sales
An effective Revenue Budget vs Actual Dashboard focuses on key metrics like actual sales, actual expenses, budget data, and recurring revenue. By comparing actual vs forecasted values, finance teams can measure revenue trends, track annual recurring revenue, and identify variances in actual results. Incorporating sales performance by comparing actual against targets is crucial for understanding growth patterns. Key metrics like revenue, profit margins, and revenue growth provide a holistic view of business health. Power BI makes it easy to visualize these metrics using dashboard templates, custom charts, and KPIs tailored for executives, sales teams, and financial analysts.
Visualizing Recurring Revenue and Annual Recurring Revenue in Dashboards
Recurring revenue is a critical component of financial health, and Power BI dashboards excel at tracking this metric over time. A well-designed Revenue Budget vs Actual Dashboard includes visuals for recurring revenue, annual recurring revenue, and subscription-based income streams. By leveraging Power BI templates, teams can build dashboards that track the impact of revenue vs budget over different periods, enabling budget vs actual analysis at a glance. Using Power BI service or Power BI report capabilities, organizations can monitor monthly, quarterly, or annual trends in revenue generation, helping businesses make informed decisions for future growth.
Leveraging CRM Dashboard Data for Revenue Insights
Integrating CRM dashboard data into a Power BI dashboard helps teams connect sales pipelines, customer acquisition data, and actual sales figures to the broader revenue budget vs actual analysis. With Power BI offers, users can combine sales data from CRM systems with budget data and actual performance data to get a complete picture of revenue health. This enables users to analyze revenue growth, sales by product or region, and track actual performance against sales forecasts. Leveraging Power BI’s drill-down capabilities and dashboard in Microsoft Power BI allows businesses to uncover insights hidden in large datasets and optimize sales strategies effectively.
Power BI Dashboard Templates for Revenue Analysis
Examples of Power BI Dashboards for Budget vs Actual Analysis
There are numerous Power BI dashboard examples available to inspire teams. These include revenue budget vs actual dashboards, sales budget vs actual dashboards, and analysis dashboards for tracking actual results. The best Power BI dashboard examples demonstrate how to compare actual vs budget and use key metrics like revenue to drive business insights. By studying these examples of Power BI dashboards, businesses can understand how to visualize revenue generation, revenue trends, and actual numbers effectively, creating a foundation for their own budget vs actual dashboards.
How to Use Power BI Template for Revenue Reporting
A Power BI template simplifies the process of creating a budget vs actual dashboard by providing a ready-made structure for dashboard creation. These templates typically include placeholders for actual revenue, budget data, and actual expenses, as well as visualizations for sales data and revenue vs budget comparisons. Teams can download free templates or customize existing ones to suit their needs. By integrating data sources via Power BI’s data connectors, users can build a robust revenue budget vs actual dashboard that supports real-time insights and data refreshes.
Designing a Budget vs Actual Dashboard Template in Power BI
Designing a Power BI dashboard template for budget vs actual analysis involves structuring visual elements like charts, tables, and KPIs. Teams can use Power Query Editor to prepare financial data and actual performance data, then build visuals such as bar charts, line charts, and KPI dashboards to track variances. Best practices include aligning visuals with the company’s financial performance goals, incorporating filters for periods like months or quarters, and ensuring users can compare actual performance to forecasted figures. A well-designed dashboard in Power BI provides a clear and actionable overview of revenue metrics.
Building a Revenue Budget vs Actual Dashboard in Power BI
Steps to Create a Power BI Dashboard Example
To create a Power BI dashboard example for revenue budget vs actual, start by importing budget data, actual revenue, and sales data using Power BI desktop. Use Power Query Editor to clean and transform your data, ensuring proper alignment of actual figures with budget data. Design visualizations such as bar charts comparing actual sales vs budget, revenue trends over time, and tables for actual income and expenses. Publish the report to Power BI service for team collaboration, and leverage drill-through features to allow sales managers and analysts to explore actual vs budget data by customer, region, or product.
Integrating Revenue Data with CRM and Financial Systems
Integrating CRM dashboard data, financial data, data model, and sales data with Power BI enables a holistic view of revenue generation. Use Power BI’s data connectors to pull in actual performance data from systems like Dynamics, Salesforce, or ERP tools. Power BI enables blending multiple data sources into a single dashboard template, providing insights into customer behavior, sales pipelines, and actual sales figures. This integration helps teams track actual outcomes against forecasts, improving the accuracy of budget vs actual analysis and supporting strategic decisions based on reliable data.
Using Power Query and Power BI Service for Real-Time Reporting
Power Query Editor plays a key role in shaping data for budget vs actual dashboards. It allows users to transform and merge data from various sources, such as accounting software, CRM systems, and Excel files. Once prepared, data is loaded into Power BI desktop, where visuals are created. The final dashboard can be published to Power BI service, enabling real-time sharing, collaboration data analysis, and scheduled data refreshes. This process ensures the revenue budget vs actual dashboard reflects the latest figures, helping finance teams and executives stay aligned with financial goals and monitor actual sales and revenue trends accurately.
For ready-to-use Dashboard Templates: