Overview of the Pharmaceuticals Sector Financial Dashboard
What a Pharmaceutical Dashboard Is and Its Role in the Pharmaceutical Industry
A pharmaceuticals sector financial dashboard is a centralized financial dashboard designed specifically to address the complexity of the pharmaceutical industry. It consolidates pharmaceutical data from finance, sales, inventory management, R&D, and operations into a single dashboard that delivers clarity and control. Unlike generic dashboards, a pharma dashboard is tailored to industry-specific challenges such as product expiry, regulatory costs, R&D investment cycles, and prescription sales performance.
In a pharma business, decision-making must balance profitability with patient care and compliance. A dashboard for pharma companies provides a holistic approach by integrating financial planning, trend analysis, and key performance indicators in one place. By connecting data from ERP systems, databases, and spreadsheets, the dashboard helps analysts and stakeholders gain real-time visibility into turnover, stock levels, and operational risks. This visibility enables better decisions and supports sustainable growth in a highly regulated and competitive environment.
How a Financial Dashboard Supports Pharma Companies
A financial dashboard supports pharma companies by transforming fragmented financial and operational information into actionable insights. Pharmaceutical businesses operate across complex value chains involving manufacturing, R&D, supply chains, sales teams, and healthcare partners. A dashboard for pharma companies streamlines financial monitoring by consolidating data for analysis from multiple sources such as ERP systems, SAP, and databases like Snowflake.
This consolidation allows pharma leaders to track key performance metrics such as revenue, margins, prescription sales performance, and inventory levels in real time. By providing accurate and up-to-date financial data, dashboards support improved decision-making and strategic decisions. They help mitigate risks related to shortages, expiry, and demand fluctuations while supporting optimization initiatives across finance and operations. Ultimately, financial dashboards give pharma companies a competitive advantage through faster insights and better financial control.
Dashboard for Pharma Companies to Monitor Financial Performance
A dashboard for pharma companies is designed to monitor financial performance across products, regions, and business units. It provides visibility into turnover, top sales, and profitability trends while linking financial results with operational drivers such as inventory management and production quality. This integrated view ensures that financial outcomes are understood in context rather than in isolation.
By tracking KPIs like revenue growth, cost structures, and inventory turnover, dashboards help organizations identify opportunities and risks early. Real-time data enables proactive responses to market changes and supply disruptions. This capability supports strategic planning and helps stakeholders maintain alignment with business goals while ensuring continuity in patient care and product availability.
Financial Metrics, KPIs, and Performance Tracking
Key Financial KPIs and Metrics Used in a Pharma Dashboard
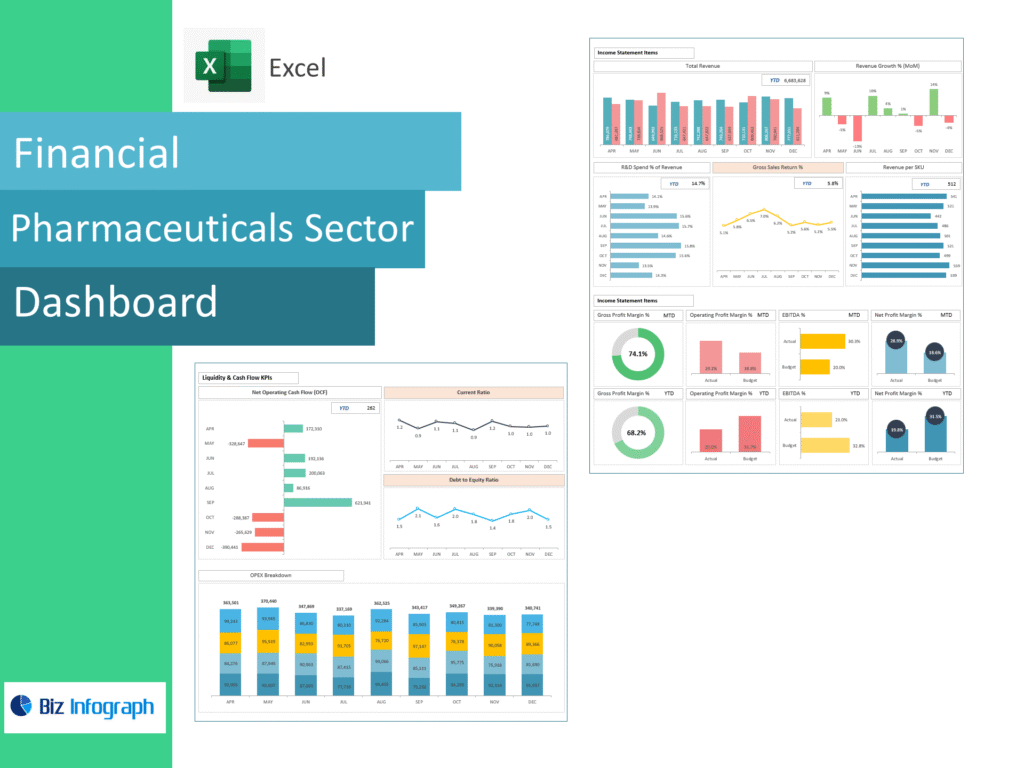
Key financial KPIs in a pharma dashboard include turnover, gross margin, operating expenses, R&D spend, and cash flow. These KPIs provide a clear picture of financial health while accounting for the unique cost structures of pharmaceutical businesses. Dashboards present pharmaceutical KPIs in one place, making it easier to monitor performance consistently.
In addition to traditional financial metrics, pharma dashboards include KPIs like inventory levels, expiry risk, and prescription sales performance. These metrics directly affect revenue and compliance. By tracking KPIs like these, pharma companies can ensure that financial performance aligns with operational realities and regulatory requirements.
Using KPIs to Measure Financial Performance in the Pharmaceutical Industry
Using KPIs effectively is critical for measuring financial performance in the pharmaceutical industry. Dashboards translate complex data into easy-to-understand visualizations that highlight trends and deviations. KPIs support benchmarking across products, markets, and time periods, enabling informed strategic decisions.
By integrating real-time data, dashboards allow pharma leaders to assess performance continuously rather than relying on periodic reports. This real-time visibility improves responsiveness and helps mitigate risks associated with demand volatility and supply shortages. KPIs thus become tools for proactive management rather than retrospective analysis.
Tracking Financial Metrics Across Pharma Companies
Tracking financial metrics across pharma companies requires standardized definitions and consistent reporting. Dashboards enable cross-company and cross-division comparisons by unifying data from ERP systems, databases, and spreadsheets. This consistency supports transparency and accountability.
Dashboards also facilitate trend analysis, allowing analysts to identify patterns in sales data, inventory levels, and cost drivers. By monitoring these metrics, pharma companies can optimize pricing strategies, improve forecasting accuracy, and enhance financial planning processes.
Pharmaceutical Dashboards, Templates, and Excel Use
Using a Dashboard Template for Pharmaceutical Financial Reporting
Pharmaceutical Financial dashboard template accelerates the implementation of pharmaceutical financial dashboards by providing predefined layouts and KPIs. Templates reduce development time and ensure best practices in financial reporting. For pharma companies, templates include industry-specific metrics such as expiry risk, R&D spend, and inventory management indicators.
Templates also promote consistency across teams and regions. By starting with a template, organizations can focus on customization and analysis rather than design, ensuring faster value realization.
Excel-Based Pharmaceutical Dashboard for Financial Analysis
An Excel-based pharmaceutical dashboard remains a practical option for many organizations. Excel dashboards allow analysts to build user-friendly, easy-to-understand financial views using familiar tools. They support data integration from spreadsheets, ERP exports, and databases.
While Excel dashboards may lack advanced automation, they provide flexibility and accessibility. When combined with real-time data feeds, Excel dashboards can support financial analysis, trend analysis, and reporting needs effectively, especially for smaller pharma businesses or pilot implementations.
Benefits of Using a Pharma Dashboard Template
Using a pharma dashboard template offers several benefits, including faster deployment, reduced errors, and improved usability. Templates ensure that pharmaceutical KPIs are presented consistently and align with industry requirements.
Templates also support scalability, allowing dashboards to evolve as business needs change. This adaptability helps pharma companies maintain relevance and effectiveness in dynamic markets.
AI, Analytics, and Advanced Financial Dashboards
Role of AI in a Pharmaceutical Financial Dashboard
AI enhances pharmaceutical financial dashboards by enabling predictive and prescriptive analytics. AI models analyze historical and real-time data to forecast demand, identify risks, and recommend optimization strategies. This capability is particularly valuable for managing inventory levels, expiry risks, and shortages.
By integrating AI, dashboards move beyond descriptive reporting to proactive decision support. AI insights help mitigate risks and support strategic planning, delivering a competitive advantage in the pharmaceutical industry.
Using Analytics to Improve Financial Decision-Making in Pharma
Analytics play a central role in improving financial decision-making in pharma. Dashboards use analytics to uncover patterns in sales data, production costs, and R&D investments. These insights support data-driven decisions that align financial performance with business strategy.
Analytics dashboards enable scenario analysis and trend analysis, helping leaders anticipate market changes and optimize resource allocation. This analytical approach enhances financial resilience and long-term growth.
Enhancing Financial Dashboards with AI-Driven Insights
AI-driven insights enhance financial dashboards by automating analysis and highlighting actionable opportunities. AI can detect anomalies, predict shortages, and optimize inventory management proactively.
These insights support improved decision-making by providing timely, relevant recommendations. By embedding AI into dashboards, pharma companies can streamline operations and improve financial outcomes.
Implementing a Financial Dashboard for Pharma Companies
Building a Financial Dashboard for the Pharmaceutical Industry
Building a financial dashboard for the pharmaceutical industry requires careful planning and data integration. Organizations must connect data from ERP systems, SAP, databases, and lab results to create a seamless, accurate view.
A successful dashboard design emphasizes usability, relevance, and accuracy. By focusing on key features and user needs, organizations ensure adoption and value realization.
Best Practices for Dashboard Design in Pharma Companies
Best practices for dashboard design include simplicity, clarity, and alignment with business goals. Dashboards should present KPIs clearly and support easy navigation for analysts and stakeholders.
User-friendly, easy-to-use software enhances adoption and engagement. Clear visualizations support faster insights and better decisions.
How Pharma Companies Use Dashboards to Improve Financial Control
Pharma companies use dashboards to improve financial control by monitoring costs, revenue, and risks in real time. Dashboards support strategic decisions and improved decision-making across finance and operations.
By enabling data-driven decisions and seamless reporting, dashboards help pharma companies achieve operational excellence and maintain competitive advantage.
Conclusion
A Pharmaceuticals Sector Financial Dashboard is an essential tool for managing complexity, ensuring compliance, and driving financial performance. By integrating financial, operational, and analytical insights into a singlepharmacy dashboard, pharma companies can streamline processes, mitigate risks, and gain a sustainable competitive advantage.
For ready-to-use Dashboard Templates: