Understanding the Order Fulfillment and Customer Experience Dashboard
How an Order Fulfillment Dashboard Supports Faster Order Management
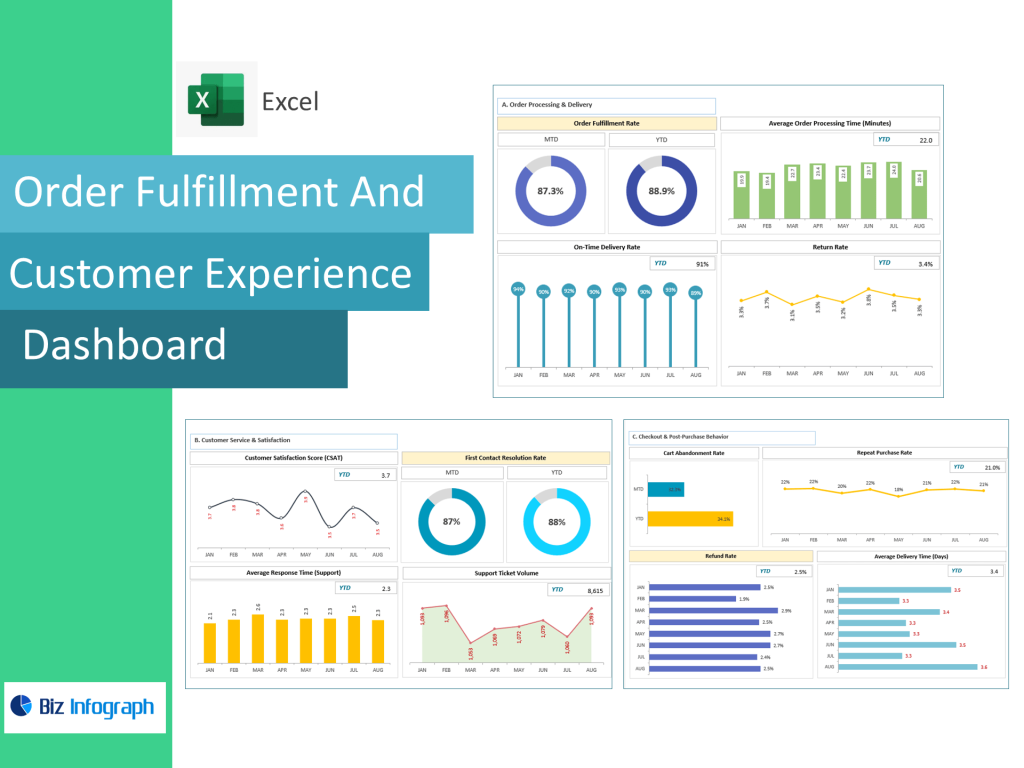
An Order Fulfillment and Customer Experience Dashboard is designed to give businesses complete operational visibility into the order fulfillment process, from order placement to delivery confirmation. In fulfillment operations, delays usually occur because of fragmented reporting, poor visibility into order status, or manual processing across multiple systems. By centralizing everything into one dashboard, teams gain visibility into key performance details in real-time. The dashboard provides a clear picture of how efficiently orders move through each stage — picking and packing, warehouse release, carrier handoff, and final arrival.
A fulfillment dashboard supports streamlined order management by allowing teams to track metrics that matter — including fulfillment cost per order, order accuracy, cycle time, and package handover delays. Instead of manually navigating disconnected systems, teams gain a synchronized view of the entire fulfillment lifecycle. This level of transparency improves order routing decisions, warehouse prioritization, and communication with customers. When order volume grows, having a structured fulfillment system is essential to prevent bottlenecks. The dashboard is designed to offer scalable, long-term efficiency so that high order demand is met without service degradation. Ultimately, this dashboard helps reduce time wasted locating orders, improves operational coordination, and strengthens customer experience through timely execution.
Key Features of Fulfillment Dashboards for Supply Chain Visibility
A high-performing order fulfillment dashboard includes features that allow full visibility into order status at every stage of the supply chain. Key features typically include order tracking panels, warehouse picking and packing efficiency indicators, shipment routing updates, and delivery confirmation timelines. Each component is designed to reduce uncertainty and provide real-time feedback loops. Because dashboards help teams assess performance quickly, they support faster decision-making and more responsive fulfillment strategies.
One dashboard consolidates operations across the supply chain instead of requiring workers to toggle between systems. By offering visibility into key capacity limits, dashboards enable more effective inventory and warehouse planning. Custom software integrations allow businesses to adapt dashboard views to their unique models — whether shipping bulk freight or high-frequency retail deliveries. Tracking these metrics empowers supply chain managers to forecast shipping constraints, workforce load, or inventory shortages ahead of time.
When monitored consistently, these features lead to more reliable fulfillment, improved warehouse productivity, and reduced customer complaints. Key features also include alerts triggered by delayed order movement or stock issues, which allows teams to intervene before customers notice service disruption. It is not just about tracking — the system improves fulfillment strategy for cost and timeline optimization across all channels.
Customer Experience Monitoring Through Fulfillment Metrics and Analytics
Customer experience is deeply tied to the efficiency of fulfillment operations. A customer’s perception of reliability depends on how quickly an order arrives and whether it is correct and undamaged. A customer experience dashboard gives businesses insight into how well fulfillment aligns with customer expectations and needs. Dashboard views reveal patterns in delivery delays, packaging errors, or inaccurate address routing. These insights drive adjustments in process design so that the entire fulfillment chain improves.
Tracking fulfillment metrics such as delivery accuracy, first-attempt drop success, and customer communication response time helps companies evaluate efficiency and customer satisfaction together. Since dashboards help teams visualize gaps, fulfillment leaders can compare order performance between carriers, distribution centers, and fulfillment waves. By combining analytics with operational numbers, teams learn whether delays arise in picking, packing, inventory access, or courier handoff.
Real-time analytics also allows support teams to answer customer questions fast because visibility into order status is immediate. Instead of searching through emails, warehouse logs, or vendor portals, teams have full context in one dashboard view. This responsiveness enhances customer satisfaction and builds trust. In essence — fulfillment dashboards provide data that elevates customer experience management into a measurable business discipline.
Essential KPIs and Metrics for Order Fulfillment
Core Fulfillment Metrics to Measure Performance in Real-Time
A powerful fulfillment dashboard must track key metrics that guide daily operations and long-term supply chain planning. Core fulfillment metrics include fulfillment cost per order, warehouse pick time, inventory-to-order latency, shipment dispatch interval, and on-time delivery rate. When teams track metrics that matter routinely, they can pinpoint process inefficiencies before they escalate. Real-time visibility into order throughput improves workload balancing, workforce scheduling, and storage allocation. Metrics like cycle completion speed and carrier handoff duration indicate how efficiently products move through internal systems.
As data scales, dashboards help achieve fulfillment balance — lowering delay risk and controlling operational cost. Inventory and warehouse dashboards often expand into SKU aging reports, reorder triggers, and space utilization ratios. Each metric reinforces cost-effective decision making, which directly influences profitability at scale. The more consistently KPIs are tracked, the more accurately leadership can adjust strategy.
KPIs That Connect Customer Experience With Operational Fulfillment Success
To connect fulfillment performance with customer sentiment, KPI selection must balance operational and customer experience signals. KPIs may include order accuracy percentage, damage or return rate, fulfillment turnaround time, customer satisfaction rating post-delivery, and product availability rate. These signals indicate whether fulfillment is meeting expectations.
Tracking KPIs across the supply chain drives improvements not only within warehouses, but also in customer-facing behavior. For example, when dashboards show returns accumulating for a particular SKU, this signals the need to inspect product quality or packaging integrity. When a sudden change in order status trends appears, it indicates possible labor shortages or carrier capacity issues.
Tracking KPIs through dashboards creates a measurable link between process execution and the customer’s perception of reliability. This makes improve order accuracy and delivery speed a structured objective rather than a reactive workaround. Successful organizations understand that satisfaction isn’t only based on product — experience matters equally.
Metrics Every Order Fulfillment Dashboard Should Track for Efficiency
For efficiency optimization, an order fulfillment dashboard should include metrics such as inventory lead time, picking and packing duration, carrier response speed, and bottleneck origin points. Efficiency metrics help teams identify whether slowdowns occur due to inventory placement, worker allocation, or integration failures.
Metrics like fulfillment cost per order show how much efficiency improves as system automation increases. As order volume grows, efficiency metrics act as early-warning indicators when processing quality or responsiveness risk declines. A dashboard without efficiency measurement quickly becomes reactive and ineffective.
Integration and Tech Stack Considerations
How to Integrate the Dashboard With Existing Order Management Systems
Integration is a major success factor in dashboard implementation. An order fulfillment dashboard performs best when connected to order management, CRM, warehouse management, ERP, and carrier networks. These systems feed real-time data for order status tracking. Integration removes manual entry delay and ensures numbers reflect actual field activity.
Businesses may integrate through APIs, ETL pipelines, or custom software plugins. When integrations are clean, decision latency drops. Teams can track orders, process batches faster, and reduce communication traffic between departments. A dashboard is only as strong as its connections — integration elevates raw infrastructure into actionable intelligence.
Combining Ecommerce, Supply Chain, and Fulfillment Data Into One Dashboard
Most businesses operate across multiple systems, including ecommerce storefronts, warehouse automation, and logistics carriers. A fulfillment dashboard merges these environments into one dashboard, providing end-to-end insight. Ecommerce order placement triggers tracking through fulfillment operations, warehouse processing, carrier handoff, and proof-of-delivery.
A comprehensive view enhances ability to respond to service shifts. Teams can solve problems faster when they know where — and why — orders stall. Supply chain disruptions are easier to manage when data lives in a single pane of glass. Unified dashboards act as the brain of fulfillment intelligence.
Integrations That Enable Real-Time Analytics and Unified Visibility
Integration unlocks the ability to perform real-time analytics. Unified data improves forecasting accuracy and workforce assignment. Without integration, analytics remain batch-processed, slow, and reactive. With flowing real-time data, dashboards help teams adjust staffing on high-traffic days, reroute shipments, or increase packing lines.
Visibility allows decision-making within minutes — not days. Integration places fulfillment, inventory, and transport alignment under one operational lens.
Dashboard Helps Improve Supply Chain and Customer Experience Outcomes
One Dashboard for End-to-End Fulfillment Tracking and Service Experience
One dashboard reflects the entire fulfillment chain — from storage intake to doorstep arrival. End-to-end transparency enables proactive corrections and informed scaling. Teams don’t guess which orders stalled; the dashboard shows it. They don’t estimate carrier performance; the dashboard calculates it.
Effective order fulfillment takes more than speed — structure matters. End-to-end reporting keeps customer support aligned with supply chain operations. When support teams can see real-time order status, customer responses become faster. This reduces frustration, cutting repeat inquiries drastically.
How Real-Time Analytics Improve Order Accuracy and Customer Satisfaction
Real-time analytics ensure accuracy improvements become routine instead of accidental. When fulfillment dashboards catch mis-scans or mismatches during picking, corrections occur mid-process. The result is order accuracy, lower return rate, and higher first-attempt fulfillment success.
Customer satisfaction increases dramatically when businesses deliver smoothly and communicate proactively. Real-time monitoring helps teams meet customer expectations, not just process goods.
Using the Dashboard to Reduce Delays and Strengthen Customer Trust
Trust is built when orders arrive on time. Delays reduce loyalty more than price variance. A fulfillment dashboard reduces delays by exposing inefficiencies early — route misalignment, warehouse lag, scanning disruption. Teams fix issues before customers notice.
Fast resolution strengthens brand trust and increases lifetime value. A dashboard becomes the anchor of reputation — a predictive tool, not just a tracker.
For ready-to-use Dashboard Templates: