Introduction to Inventory Dashboard Power BI Template
What Is an Inventory Dashboard in Power BI?
An inventory dashboard in Power BI is a powerful visualization tool designed to provide a holistic view of your inventory data, enabling teams to track inventory, monitor inventory levels across different locations, and analyze key metrics like inventory turnover and stock availability. Created using Microsoft Power BI, this solution helps businesses optimize inventory management by transforming inventory data into actionable insights. The dashboard can consolidate data from various sources, including ERP systems, Excel sheets, and Power BI reports, providing real-time insights into inventory distribution, inventory status, and inventory by product. By leveraging a Power BI template or customized Power BI dashboards, organizations can efficiently manage their inventory processes.
Benefits of Using a Power BI Template for Inventory Management
A Power BI template for inventory management simplifies dashboard creation by offering pre-built visuals, calculations, and layouts. These dashboard templates provide a solid foundation for building customized solutions tailored to business needs. With Power BI’s interactive dashboards, businesses can monitor inventory performance, track inventory movement, and analyze trends like inventory turnover ratios without the need for manual calculations. This enables supply chain efficiency and effective inventory management by giving stakeholders a clear understanding of stock levels, excess inventory, and replenishment requirements. Power BI provides robust data integration features, supporting seamless connection to external data sources for a unified view.
How Power BI Enhances Inventory Control and Analysis
Microsoft Power BI offers an intuitive platform for inventory management with Power BI, allowing users to create a KPI dashboard that reflects the efficiency of inventory processes. By using Power Query and Power BI’s data modeling tools, teams can build reports that calculate inventory turnover, monitor inventory status, and ensure optimal inventory levels. The interactive nature of Power BI dashboards allows users to filter data by product, region, or time period, enabling more precise decision-making. Dashboard design best practices ensure that inventory data is presented in a way that enhances understanding and supports better planning for supply chain operations.
Key Features of an Inventory Dashboard in Power BI
Essential KPIs and Metrics for Inventory Management
A robust Inventory dashboard in Power BI should include KPIs such as inventory turnover ratios, days of supply, stock-out rates, and excess inventory levels. These inventory metrics provide actionable insights into inventory performance and enable businesses to identify areas for improvement. By calculating inventory turnover and visualizing trends in stock movement, the dashboard supports more informed purchasing decisions. Tracking inventory levels across different warehouses helps maintain optimal inventory levels and prevents stock shortages or overstocking. Dashboard provides actionable insights that help businesses maintain balance and avoid disruptions in their supply chain.
Visual Components and Design of an Effective Inventory Dashboard
A well-designed inventory management dashboard integrates tables, charts, and KPI dashboards to offer a clear view of inventory performance. Power BI’s interactive dashboards can include bar charts for inventory by product, line charts for inventory turnover, and maps for inventory distribution. These components help stakeholders easily digest complex data and identify key trends. The dashboard template should include slicers for filtering by category, time period, or location, ensuring that users can drill down into specific areas of interest. Dashboard design principles, such as clarity, consistency, and intuitive navigation, are critical for a successful solution.
Real-World Examples of Power BI Inventory Dashboards
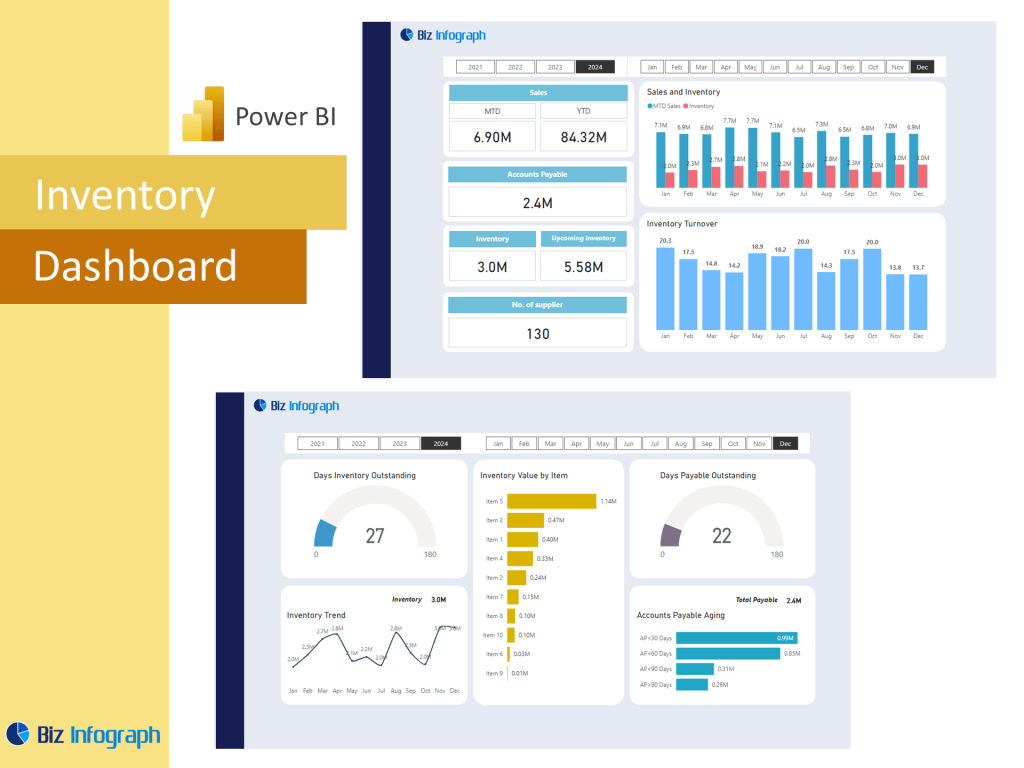
Examples of Power BI dashboards for inventory management showcase best practices in dashboard design, including dynamic filters, KPI cards, and visual storytelling techniques. For instance, a sales and inventory dashboard might combine product sales trends with inventory data to highlight correlations. Another example could be an inventory performance dashboard that integrates inventory status and supply chain management metrics. Power BI dashboard examples often demonstrate how to calculate inventory turnover, forecast future needs, and present insights in a visually engaging format. Reviewing these examples provides inspiration for building dashboards that align with business goals.
Building an Inventory Management Dashboard Using Power BI Template
Step-by-Step Guide to Creating an Inventory Dashboard
To create an inventory management dashboard in Power BI, start by selecting a template for inventory or build a custom model. Import inventory data using Power BI desktop and connect sources like Excel, SQL, or ERP systems. Use Power Query editor to clean and transform the data, ensuring consistency across fields like inventory item, location, and quantity. Build visuals such as line charts, bar graphs, and KPI cards to highlight key insights. Publish the dashboard to Power BI Service for easy access and sharing. The result is a dashboard that helps businesses manage inventory more efficiently and make data-driven decisions.
Best Practices for Designing Dashboards in Power BI
When designing a dashboard in Power BI, focus on clarity, simplicity, and relevance. Use consistent color schemes, label visuals clearly, and limit the number of elements on each page to avoid clutter. Incorporate inventory management processes and metrics that matter most to your business, such as inventory turnover ratios and cash flow impact. Ensure the dashboard is customized to your audience—whether for sales managers, supply chain teams, or executives. Power BI provides a range of features to support interactive, real-time dashboards that adapt to user input, helping users gain insights quickly.
Customizing Dashboards to Fit Your Supply Chain Needs
No two businesses have the same inventory management requirements, so it’s important to customize your Power BI dashboard template accordingly. Add or modify KPIs like inventory turnover, reorder points, or backorder rates. Incorporate dashboard features like drill-throughs for detailed views and bookmarks for scenario analysis. Adjust the layout to highlight critical insights, such as inventory performance across warehouses or product categories. Tailor the dashboard’s visualization elements to match the organization’s branding and supply chain priorities. This customization ensures the dashboard delivers maximum value by aligning with your specific operational goals.
Advanced Inventory Analysis and Reporting with Power BI
Using Power BI for Inventory Turnover and Stock Analysis
Power BI’s advanced analytics capabilities allow for detailed inventory turnover analysis, helping businesses identify slow-moving products, excess stock, and stock-out risks. By creating calculated columns and measures with Power Query editor, you can automate calculations of turnover ratios and stock levels. Power BI dashboards display these metrics in real-time, giving businesses a competitive edge in managing inventory data from various sources. Tracking trends over time, like seasonality or demand shifts, enables proactive inventory planning and enhances supply chain responsiveness.
Integrating Sales and Inventory Data for Comprehensive Insights
Combining sales and inventory data in Power BI enables a deeper understanding of how product movement impacts cash flow and profitability. A well-designed inventory management dashboard integrates sales analytics, revenue metrics, and inventory turnover data, offering a complete picture of business performance. By using Power BI’s data modeling features, businesses can explore relationships between sales channels, regions, and stock levels. This integrated approach helps in identifying patterns, such as top-selling products versus slow movers, enabling more effective forecasting and inventory optimization.
How Power BI Supports Efficient Inventory and Supply Chain Management
Power BI supports efficient inventory management by providing tools for tracking inventory status, analyzing inventory performance, and managing supply chain efficiency. Through dashboard design that highlights key metrics like inventory turnover, businesses can identify bottlenecks, reduce excess inventory, and ensure optimal inventory levels. The platform’s flexibility allows for creating dashboards tailored to different departments—sales, logistics, and finance—promoting collaboration across teams. By transforming raw data into actionable insights, Power BI helps businesses manage their inventory efficiently and drive continuous improvement in inventory management processes.
For ready-to-use Dashboard Templates: