Understanding the HR Financial Services Sector Dashboard
How an HR Dashboard Supports Workforce Tracking in Financial Services
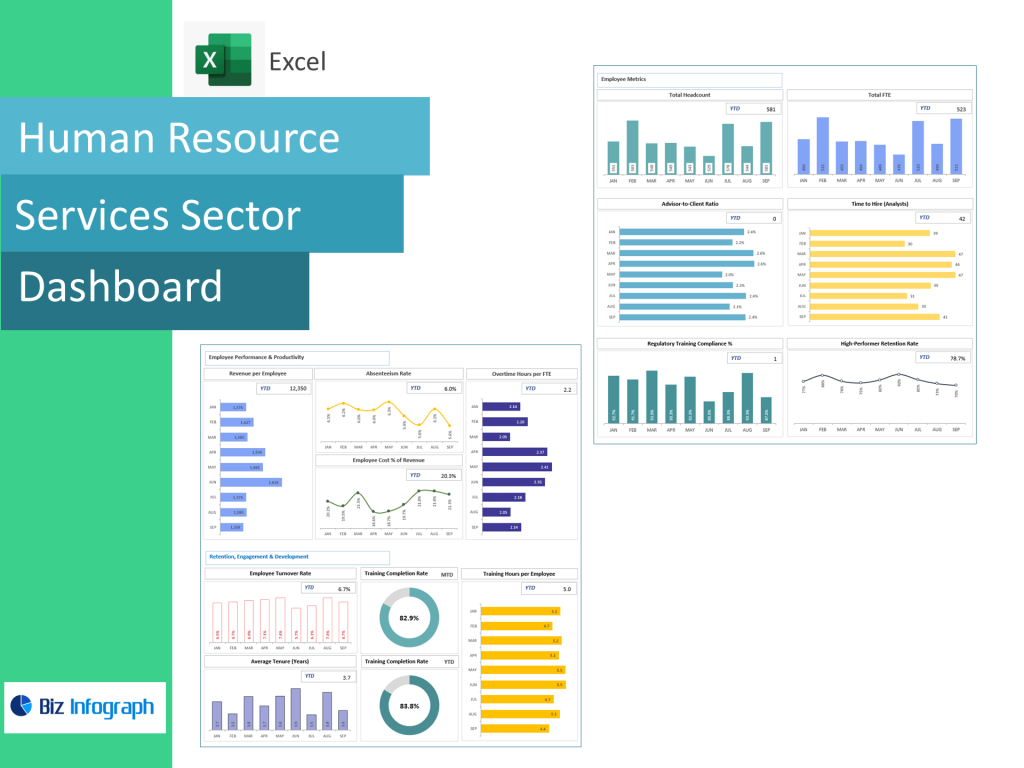
An HR Financial Services Sector Dashboard is a tool that unifies workforce metrics, HR KPIs, financial data, and people analytics into one visual interface. In financial services, accuracy, compliance alignment, and staffing stability carry heavy impact—making real-time workforce insight crucial. A dashboard provides immediate visibility into hiring velocity, training status, cost per employee, productivity variance, absentee trends, and turnover ratios. With this data centralized, HR teams gain insights quickly without manual reporting. Since the financial industry is performance-driven, the dashboard helps HR professionals understand whether workforce capacity supports operational output and expected financial performance. Dashboards allow deeper observation into talent quality, role performance, and payroll allocation while offering high-level metrics appropriate for executive review. With proper configuration, the dashboard is a tool for workforce planning, enabling staffing changes before productivity gaps grow. Overall, this dashboard helps teams streamline workforce management, improve decision quality, and maintain alignment with evolving sector expectations.
What Makes an Effective HR Metrics Dashboard for Finance Teams
An effective HR metrics dashboard blends workforce metrics and financial insight without overwhelming HR or finance leaders. The dashboard should include metrics that reflect talent acquisition cost, overtime usage, retention level, capability maturity, and operational and financial headcount distribution. When building a financial dashboard for HR, design matters—clean typography, intuitive grouping, and color-based priority mapping improve readability. A well-structured dashboard provides insights into workforce management cost vs. productivity output, linking HR decisions with financial outcomes. Financial dashboards make trend recognition simple by visualizing metrics like talent tenure, turnover cost, salary efficiency, and capacity coverage. To meet modern financial dashboard needs, an HR metrics dashboard must enable drill-down capability, filter by department, and compare year-over-year workforce metabolism. This kind of dashboard helps finance professionals understand how HR changes affect financial performance, forecast labor budgets with precision, and anticipate workforce risks. A truly effective HR dashboard drives strategic alignment, not just reporting.
HR Dashboard Examples Showing Workforce and Finance Data in One View
Several HR dashboard examples demonstrate how cross-department data unifies into a single readable screen. Examples include dashboards showing HR data beside revenue-per-employee output, claims processing speed per headcount, training completion ratios vs. compliance accuracy, and compensation versus productivity yield. These dashboards come alive when interactive dashboards help teams compare labor cost against financial outcomes to determine whether productivity aligns with business goals. Another dashboard example integrates benefits utilization with operational metrics and talent development progress. A CFO dashboard often overlays workforce cost, projected labor demand, and annual workforce planning forecasts, allowing CFOs to view HR impact through a financial lens. These dashboards make it easy to link hiring scale to cost structure, performance dashboard scoring to margin growth, and workforce maturity to business efficiency. When dashboards in action highlight linkages, decision-making becomes faster and more data-driven. Seeing HR and financial metrics side-by-side helps both functions move beyond reporting—toward optimization.
Core Metrics, KPIs & Analytics for HR Dashboards
Essential HR KPIs and People Analytics to Monitor Workforce Performance
A strong HR metrics dashboard showcases the right balance of HR KPIs and people analytics. Metrics you’ll likely track include turnover risk, hiring pipeline speed, internal mobility rate, absenteeism percentage, employee lifetime value, skill coverage completeness, training compliance, performance cycle closure rate, and workforce engagement score. HR professionals rely on people analytics to identify trends indicating burnout risk, dissatisfaction, or capacity shortages. Key HR indicators—compensation cost as a percentage of revenue, productivity per employee, cost-to-hire, and onboarding ramp performance—help leadership measure HR success objectively. Metrics and Key Performance Indicators should also reflect promotion readiness, succession bench strength, and long-term retention potential. This kind of analytics dashboard gives clarity into employee cycle stages, highlights critical workforce gaps, and guides interventions backed by data. By combining operational and financial workforce insights, HR dashboards help teams forecast talent demand, avoid future shortfalls, and align staffing with organizational growth trajectory.
Using a Metrics Dashboard to Connect HR Insight With Financial Outcomes
In financial services, HR analytics becomes more valuable when tied directly to financial results. A metrics dashboard helps evaluate whether workforce strategies align with financial goals and revenue trajectory. HR dashboards make it possible to observe patterns such as overtime surges tied to operational strain or productivity drops associated with training deficits. Metrics like utilization rate, payroll-to-revenue ratio, employee profitability index, and workforce cost variance establish cause-effect patterns that financial leaders cannot ignore. When HR teams use the dashboard to interpret cost dynamics, proactive hiring or reskilling decisions can be made before loss escalates. The dashboard should include metrics that flag cost inefficiencies early, ensuring workforce allocation supports profitability and financial stability. This integration enables strategic planning across both HR operations and financial forecasting. Ultimately, this type of workforce-finance sync leads to smarter investment mapping, scalable growth, and stronger retention effectiveness.
Financial Dashboards and HR Metrics Integration for Better Decision Support
Integrating HR metrics into financial dashboards enhances decision quality by merging workforce signals with revenue and cost evaluations. Finance dashboards show margin performance, expense movement, capital consumption, and return per employee. When HR metrics overlay this, leaders can see how workforce strategy supports or slows financial progress. Financial dashboards help make decisions more data-driven by grounding talent discussions in measurable outcomes. A performance dashboard with integrated HR and financial KPIs supports unified budgeting and long-term organizational modeling. HR dashboards come in different formats, but strong integration means HR and finance no longer operate in silos. Combined dashboards enable both teams to identify trends, track metrics, and adjust workforce strategies while understanding how headcount shifts influence cost and growth.
Dashboard Examples, Tools & Implementation Approaches
Dashboard Example Showing HR and Finance Collaboration in Practice
A dashboard example of collaboration might include workforce allocation vs. department revenue output. Here, teams compare staffing density with financial returns to assess if units are over or under-resourced. Other examples include merger-integration workforce modeling, overtime reduction mapping, and benefits optimization aligned to cost reduction targets. A finance dashboard might show operating margin improvement following onboarding cycle shortening—quantifying the return on HR improvement efforts. HR dashboard examples that highlight training investment vs. productivity increase help justify L&D funding. Through real-time insights, leadership sees progress rather than reports weeks later. This type of dashboard provides tangible proof linking workforce decisions to corporate financial gain. These examples help teams balance staff load with business goals for stronger financial health.
Choosing the Right Dashboard Tool for Interactive Dashboards
Choosing the right dashboard tool determines usability, accuracy, and reporting flexibility. Financial dashboards benefit most from platforms that offer drill-downs, threshold rules, and cross-filter capability. Interactive dashboards ease navigation through metric layers, enabling HR and finance to analyze outcomes at both macro and micro scale. Tools that integrate HR software and accounting systems reduce manual consolidation and improve dashboard accuracy. A metrics dashboard must also support future HR expansion, including AI-based workforce predictions or forecasting enhancements. A modern dashboard is the key to eliminating reporting friction and elevating decision-flow across HR financial services sector environments.
Best Practices for Building an HR Metrics Dashboard in Financial Services
When building a financial dashboard, best practices include selecting measurable KPIs, ensuring visual clarity, grouping related data, and embedding forecasting logic. Dashboard design should keep financial and operational and financial workforce facts visible without clutter. Performance monitoring panels must prioritize critical metrics like turnover cost, client-impacting vacancy risk, and project staffing readiness. An HR dashboard template accelerates deployment and ensures metric consistency across updates. A best HR dashboard includes metrics like salary allocation efficiency, career progression health, risk retention indicators, and employee growth contribution. Implementing these best practices transforms the dashboard from static report to strategic intelligence system.
Practical Applications & Dashboards in Action
How HR Dashboards Improve Workforce Decisions Across Financial Services
In practice, HR dashboards help teams refine recruitment, enhance retention, and reduce ineffective spending. Dashboards in action show when skill imbalance affects financial results or claim processing delays stem from understaffing. Workforce management becomes more predictive than reactive when personnel movement trends are visible. Dashboards allow early detection of risk like burnout, leading to intervention before productivity drops. Strong dashboards make HR professionals more proactive, improving retention and reducing hiring cost inflation. With real-time insights, the dashboard helps teams assign workload, plan capacity, and balance budgets while ensuring service availability for financial clients.
Real Dashboards in Action: KPIs, Analytics & Insight Flow
Real-world dashboards support KPI alignment and analytics-driven decisions. Dashboards give immediate access to workforce and finance optimization signals, streamlining action flow. In execution mode, a metrics dashboard can highlight low skill coverage areas, flag high turnover risk, and simulate budget outcomes if additional hiring is required. Tools that integrate predictive workforce analytics and economic sensitivity modeling help teams map future costs against investment yield. Dashboards in action provide clarity—no long spreadsheets, no fragmentary emails. Instead, financial performance and people analytics merge into one decision system.
Dashboard FAQs for HR Leaders and Decision-Makers
Common dashboard FAQs include: What metrics should we track first? → Focus on revenue-per-employee, hiring velocity, turnover cost, and training efficiency. How often should we update dashboards? → Real-time or daily refresh is ideal for financial services agility. Do dashboards work without HR software integration? → Yes, but automation increases reliability. Which dashboard template should we start with? → Choose one aligned with workforce metrics and financial reporting needs. FAQs guide HR teams in adoption, rollout planning, and enhancement strategy.
The Future of HR Analytics in Financial Services
The Future of HR and People Analytics in Financial Dashboards
Future of HR dashboards will evolve into intelligent workforce forecasting engines. Predictive analytics will map talent flight probability, labor cost inflation, skills-gap exposure, and succession bench depth. People analytics + finance dashboard integration will redefine workforce strategy as predictive simulation becomes standard. HR dashboards make planning forward-looking, not reactive.
Why the Best HR Dashboards Will Continue to Evolve With Data
As organizations scale, dashboard needs expand. The best HR dashboards adapt by offering AI-driven insights, stress-test modeling, and natural-language exploration. Financial dashboards help make decision-making seamless by learning from pattern repetition and evolving KPI sets.
How Finance Dashboard Innovation Shapes HR Strategy and Workforce Planning
Financial dashboard innovation will merge HR and financial reporting, creating unified workforce-economics governance. Dashboards allow greater collaboration between HR and CFO units. Workforce and finance no longer compete—they co-lead enterprise stability.
For ready-to-use Dashboard Templates: