

The strongest SEO report starts with decisions, not a pile of charts. An SEO report template for PowerPoint gives you a ready-made structure for presenting performance, and the SEO Report PowerPoint Template has 14 slides in a 16×9 layout. Use it to bring campaign data, analytics, and recommendations into one clear presentation.
Pulling figures from different sources is only part of the job. You also need to show what changed, why it matters, and what the team should do next. An SEO report template for PowerPoint can give that story a clear structure.
Learn how to shape an SEO report around your goals, choose charts for the metrics you’re tracking, and use analytics to connect performance with next steps. You’ll also see how to keep slides concise and make campaign progress clear to your audience.
Key Takeaways
- Choose charts that make each SEO metric easy to interpret, and give every slide one clear point.
- Build an SEO report around campaign goals, accomplishments, and next steps so readers can see the story behind the data.
- Connect analytics to your SEO objectives by defining goals, initiatives, and deadlines before presenting results.
- Use a PowerPoint infographic template to give campaign insights a polished, consistent visual structure.
Charts and graphics for SEO reports
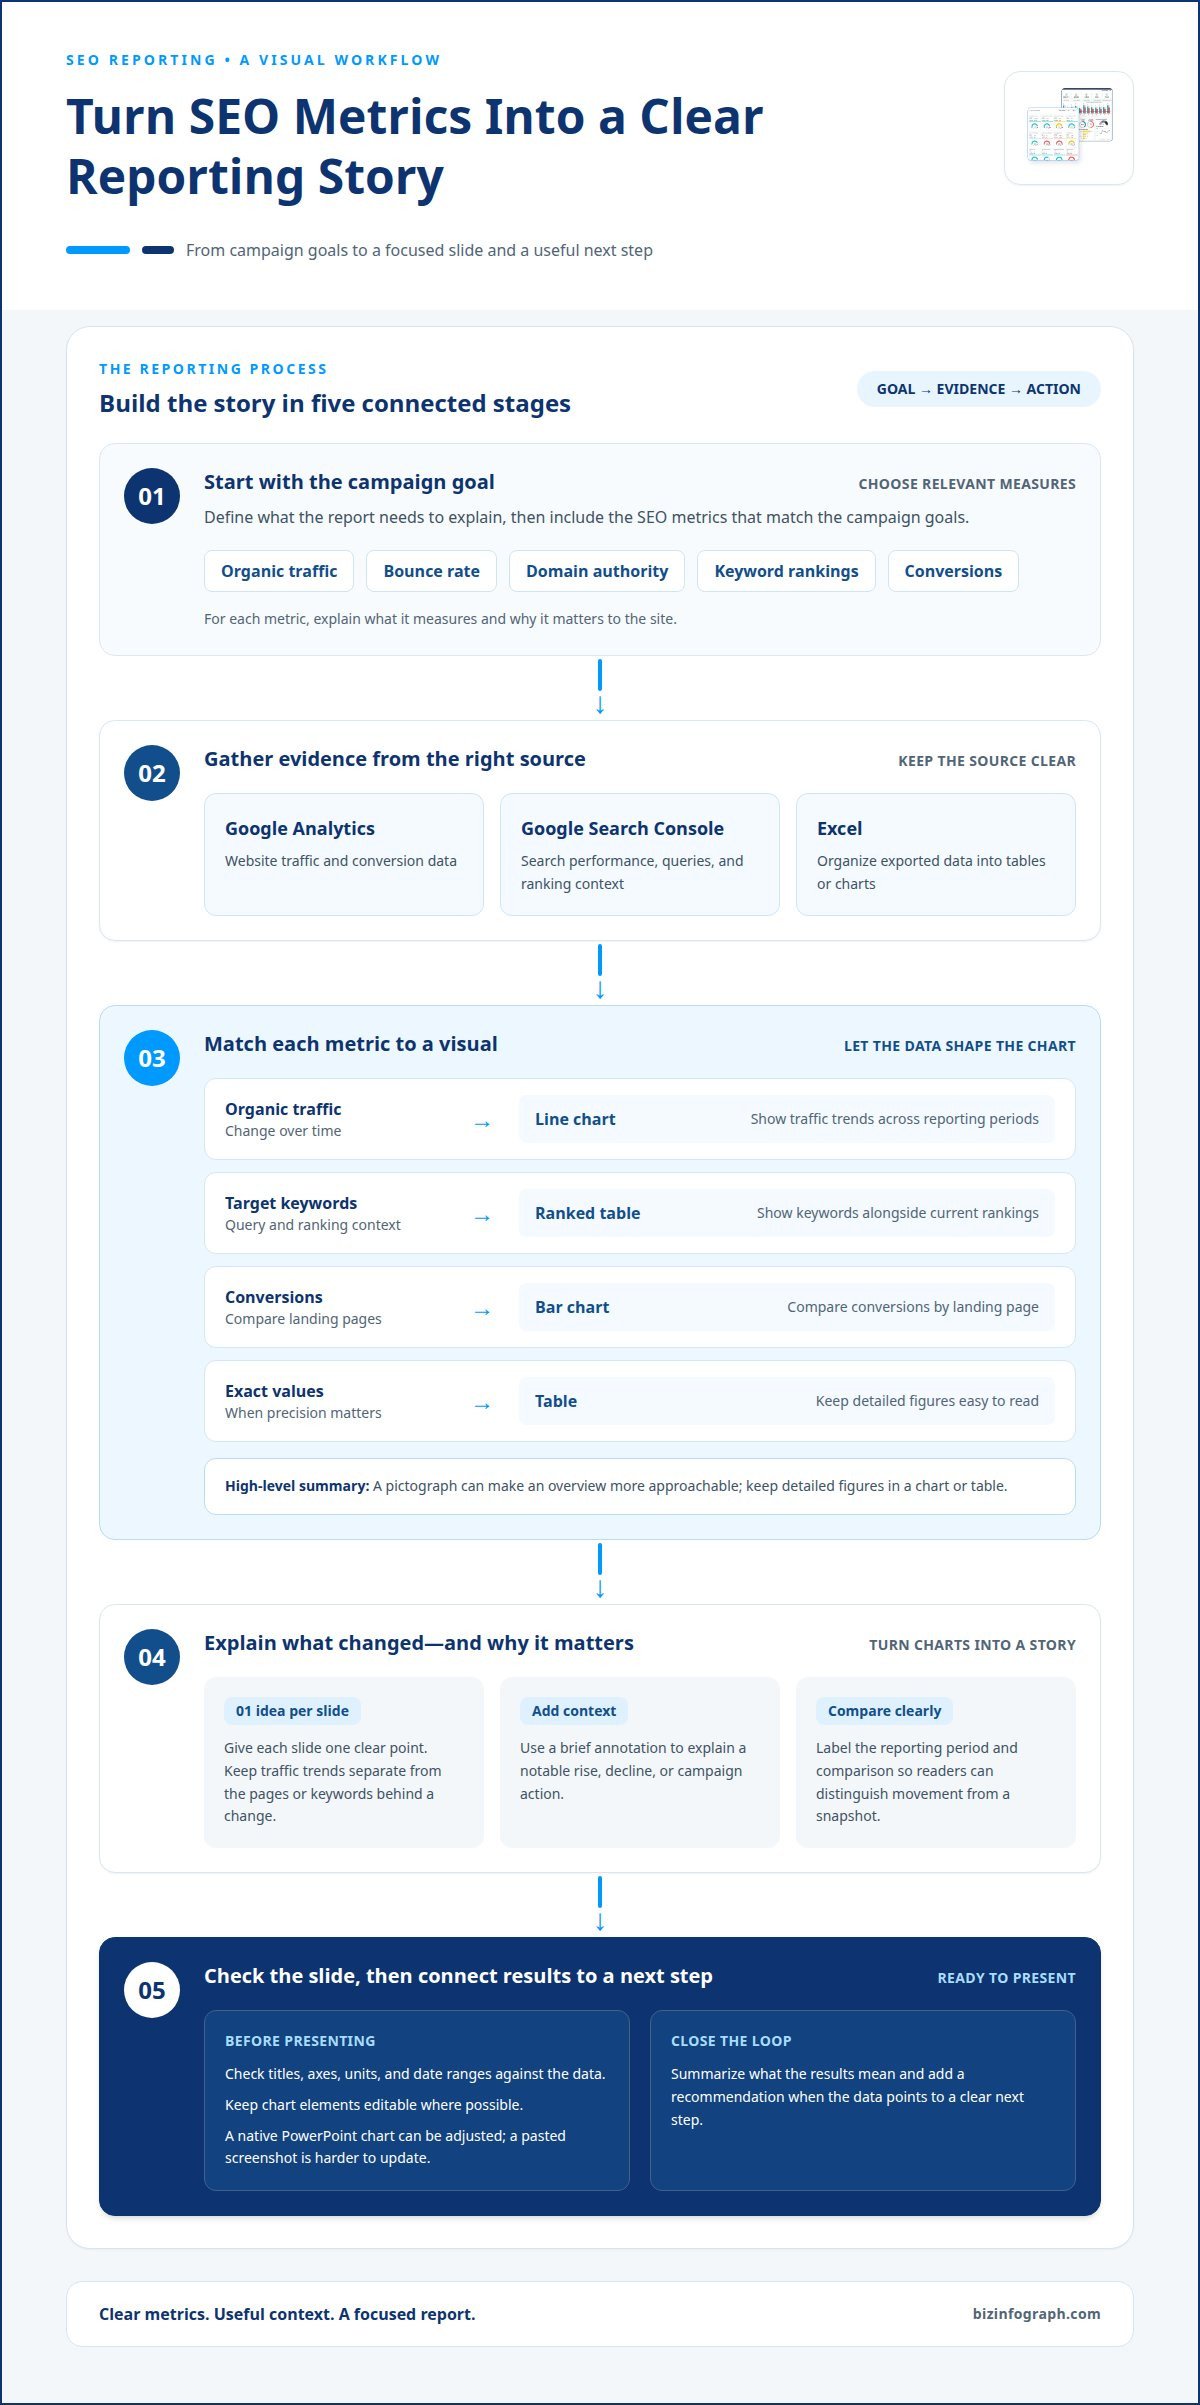
An effective SEO presentation turns metrics into a story your audience can follow. Include organic traffic, bounce rate, domain authority, keyword rankings, and conversions when they match the campaign goals. Give each metric context by explaining what it measures and why it matters to the site.
Choose a visual that fits the data. A timeline shows organic traffic changes across reporting periods, while a bar chart compares ranking positions or landing-page conversions. Use a table when readers need exact values, such as target keywords alongside current rankings. A pictograph can make a high-level summary more approachable, but keep detailed figures in a chart or table.
How should SEO reports present organic traffic, rankings, and conversions? Use a line chart for traffic trends, a ranked table for target keywords, and a bar chart for conversions by landing page. Label the reporting period and comparison clearly so readers can distinguish movement from a single snapshot.
Keep each slide focused on one idea. Give traffic trends their own slide, for example, then use the next to show which pages or keywords contributed to the change. Avoid crowding a chart with every available metric. A brief annotation can explain a notable rise, decline, or campaign action.
What should an SEO report include? Show the campaign’s key metrics, a visual comparison, and a concise explanation of what the results mean. Add a recommendation when the data points to a clear next step.
- Google Analytics: Use web analytics reports for website traffic and conversion data.
- Google Search Console: Use search performance reports for queries and ranking context.
- Excel: Organize exported data into tables or charts before adding it to a presentation.
These tools can supply data for PowerPoint reports through report exports or connected spreadsheets. Keep chart elements editable where possible: a native PowerPoint chart lets you adjust its data and labels, while a pasted screenshot is harder to update. Before presenting, check that titles, axes, units, and date ranges match the data.
How to get this PowerPoint Template?
To get an SEO report template for PowerPoint, search for the SEO Report PowerPoint Template by its title or item ID 85012-02. It uses a 16×9 layout and contains 14 slides. Listed compatibility includes PowerPoint 2007, 2010, 2013, 2011 for Mac, 2016, 2016 for Mac, and Office 365.
What are the best SEO report PowerPoint templates for agencies and clients? Choose one that suits your audience, reporting goals, and editing workflow. A monthly report layout supports recurring updates; a campaign-focused layout can keep a specific initiative in view. The SEO Monthly Report template is described as 100% editable.
Before building slides, define the target keyword scope. Start with the primary topic, then group related terms by search intent and landing page. For example, a local plumbing page might target “emergency plumber” and a longer phrase such as “emergency plumber in Austin.” Keep informational searches separate from service-ready searches to clarify what each audience needs.
Google Search Console helps review queries, impressions, clicks, and average position for a site. Google Keyword Planner supports keyword discovery, while Excel can organize selected terms in a reporting table. Record the target page beside each keyword to make overlap easier to spot and give ranking changes useful context.
Show keyword performance in a table with the query, target page, current position, and previous position. A bar chart can compare selected terms, while a timeline shows ranking movement across reporting periods. Highlight changes that relate to the campaign goal, then connect them to page activity or conversions where relevant.
How much do premium SEO PowerPoint templates cost? Pricing depends on the provider’s model, licensing terms, and included features. An SEO report template for PowerPoint should also fit the software your team uses. Editable options are available for PowerPoint and Google Slides; this template’s stated compatibility covers PowerPoint versions and Office 365.
Reporting SEO campaign performance
How do I create an SEO report presentation in PowerPoint? Start with the campaign’s main objective, then organize results, explanations, and next steps around it. Put the audience’s top priority, such as increasing site traffic, near the beginning so the report answers its central question quickly.
For a monthly update, summarize accomplishments and challenges alongside progress on targeted keyword rankings. Pair each result with its campaign context: a content update, technical change, or new landing page may help explain a shift. Keep the summary concise, with enough detail for readers to understand what changed and why.
Assess content quality through page-level evidence, not output volume alone. Compare an updated article’s organic traffic and conversions with its earlier performance, for example, then note the edit or search intent it addresses. Google Analytics can help connect landing-page visits with conversion actions. The US Environmental Protection Agency notes that web analytics tools can measure website traffic, identify top audiences, support SEO improvement, and analyze social media influence.
Review landing pages as campaign destinations. Connect each priority page to its target keyword group, organic visits, and conversion activity. If a page attracts search traffic but few conversions, explain the gap and identify a relevant next action, such as improving the page’s call to action or aligning its content more closely with visitor intent.
Treat site performance with the same focus on outcomes. Summarize relevant technical findings, affected pages, and their campaign impact. A crawl report from an SEO platform can help identify issues such as broken internal links or duplicate titles. Describe the affected page groups instead of presenting an unexplained export.
- Lead with outcomes: Show the priority result and its business relevance.
- Explain delivery: Connect content, landing-page, and technical work to campaign progress.
- Close with action: Recommend next steps and name the KPIs the team will monitor.
Finish the PowerPoint presentation with recommendations and monitoring measures. For example, pair a proposed content refresh with the targeted rankings and conversions the team will track. This turns campaign reporting into a clear record of progress and a practical plan for continued growth.
SEO objectives and data analytics
Analytics become useful when each measure connects to an SEO objective. Start an action plan by stating the goal, initiative, deadline, and evidence of progress. For example, a goal to grow qualified organic visits could pair a content update with traffic and conversion measures.
Separate objectives from indicators. The objective describes the outcome; the KPI shows whether work is moving toward it. A visibility goal might use impressions and rankings as indicators, while a qualified-lead goal needs conversion data. This distinction prevents a presentation from treating every available metric as equally important.
The US Environmental Protection Agency notes that web analytics tools can measure website traffic, identify top audiences, support SEO improvement, and analyze social media influence. Google Analytics can help connect website activity with conversions and audience behavior. Google Search Console provides search performance data, including queries, clicks, and impressions. Use each tool to answer the questions its data can address.
Keep the reporting period and comparison consistent across charts. Compare the same periods before and after a landing-page update, for example, and annotate when the initiative went live. This gives decision-makers context without implying that one change caused every movement. Segmenting by landing page, query, or audience can reveal patterns hidden by sitewide totals.
Build an objective-to-evidence chain for each initiative:
- Goal: State the intended outcome, such as stronger visibility for a service topic.
- Initiative: Describe the work, such as refreshing a page for relevant search intent.
- Evidence: Select indicators that show progress, such as impressions, clicks, or conversions.
- Decision: Explain whether to continue, adjust, or prioritize another action.
Close the analytics story with the next deadline and the KPIs to monitor. This turns charts into a working plan, rather than a collection of disconnected results. Shape your SEO objectives into a clear presentation that makes the data easier to act on.
An SEO action plan should state goals, initiatives, and deadlines. Keep those elements together when presenting proposed work so readers can see the intended outcome, the activity supporting it, and when progress is due.
Biz Infographs: PowerPoint Infographic Templates
Biz Infographs offers PowerPoint Infographic Templates to help turn SEO findings into clear, polished presentations. Use them when your campaign data and recommendations are ready, but you want a consistent visual structure for sharing them with clients or colleagues.
For reporting workflows beyond slides, Power BI Templates and Excel Dashboard Templates can help organize and present analytics. Automation Templates can support repetitive reporting tasks. Choose the format that fits how your team works: PowerPoint for presenting a narrative, dashboards for reviewing data, or automation resources for streamlining recurring processes.
With a structured template, you can focus on explaining what the results mean and which actions come next. Explore Biz Infographs’ templates to find a visual format for your SEO reporting needs.
Make your next SEO report easier to act on
Let the next reporting cycle start with a sharper question: what decision should this presentation help your audience make? Keep that question in view as you select metrics, shape the narrative, and connect recommendations to future work. An SEO report template for PowerPoint can give your findings a coherent visual framework, while your analysis supplies the insight and direction.
Biz Infographs offers PowerPoint Infographic Templates for presentations, Excel Dashboard Templates for spreadsheet-based reporting, and Power BI Templates for data visualization. Choose the format that best supports how you prepare and share SEO insights, then build a repeatable process around your campaign objectives.
Ready to explore a template for your reporting workflow? Contact Biz Infographs and take the next step toward clearer, more confident SEO presentations.
Frequently Asked Questions
Where can I download a free SEO report PowerPoint template?
Biz Infographs sells downloadable PowerPoint templates, but its SEO report template isn’t described as a free download. You can find the template featured in this guide by searching its title on Biz Infographs. Before choosing a template, consider whether you need recurring monthly reporting or a one-time campaign presentation, then select a layout that fits the report’s purpose.
Which SEO KPIs should be included in a monthly report?
Choose monthly KPIs based on the campaign objective rather than adding every available metric. For a visibility goal, track impressions, clicks, and target-query performance. For lead generation, connect organic visits with completed actions, such as form submissions. Add a brief note about branded versus non-branded search where relevant, so readers can distinguish existing demand from discovery through search.
What charts and visuals work best in an SEO report presentation?
Use a line chart to communicate change over time and a bar chart to compare pages or campaign areas. Add a funnel when the report needs to show how visitors move from search discovery toward a desired action. Keep visual scales consistent across comparisons, and annotate major campaign changes so viewers can see when work occurred without assuming it caused every result.