

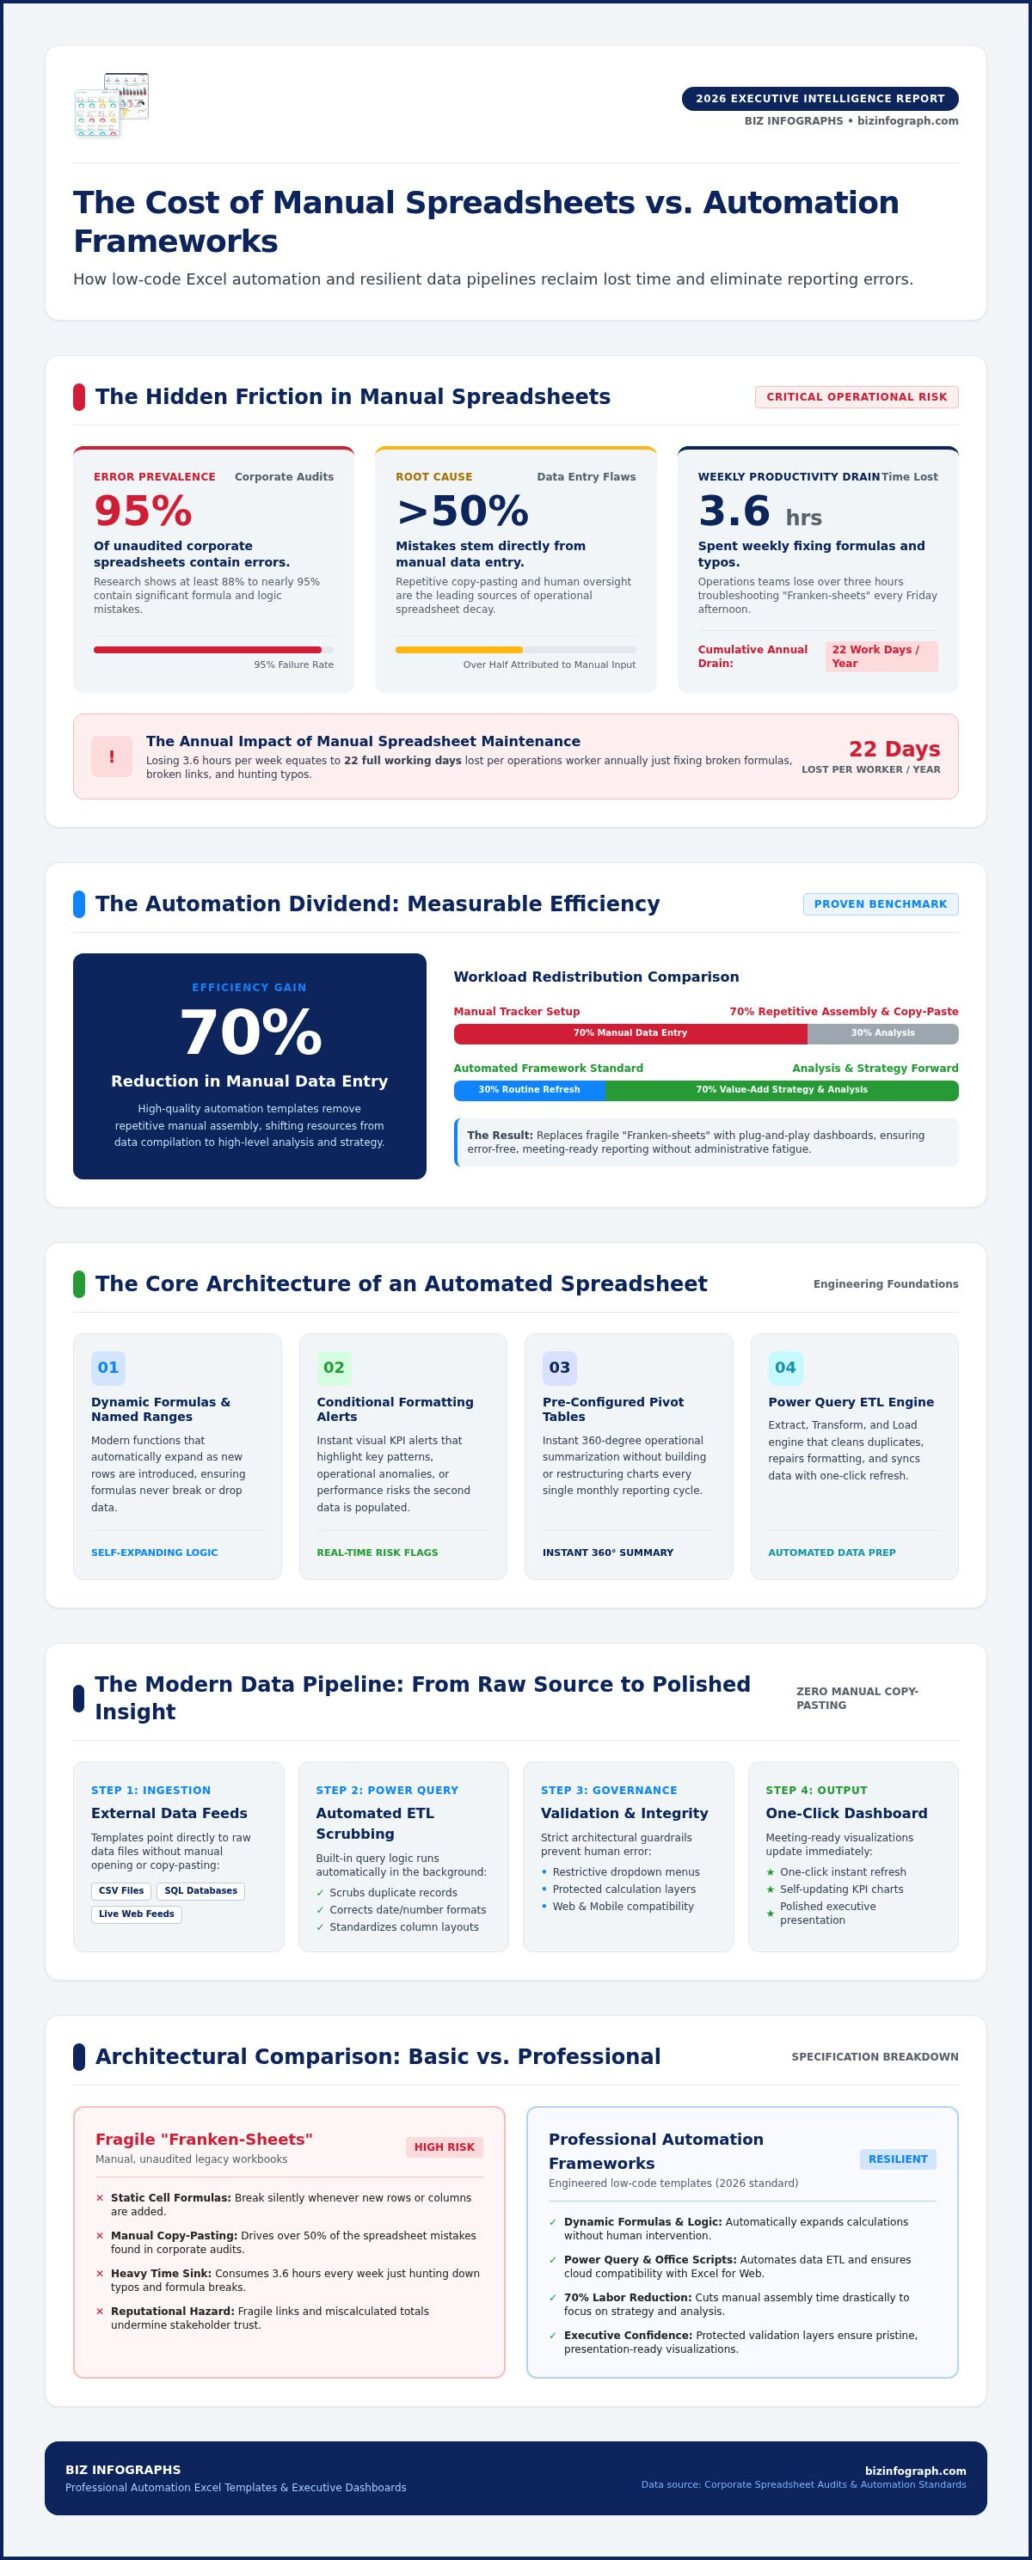
Did you know that nearly 95% of unaudited corporate spreadsheets contain errors, and over half of those mistakes stem directly from manual data entry? It’s an exhausting reality for professionals who spend an average of 3.6 hours every week fixing broken formulas and hunting down typos. Why should you sacrifice your focus to the “copy-paste” grind just to keep your business running? We agree that your time is far too valuable for repetitive tasks, which is why high-quality automation Excel templates are now the essential standard for high-performance teams in 2026.
This article promises to show you how these professional tools eliminate hours of tedious labor and transform your reporting into a sophisticated, professional-grade asset. We’ll preview the shift toward resilient, cloud-native frameworks that use Power Query and Office Scripts to do the heavy lifting for you. Get ready to replace fragile “Franken-sheets” with plug-and-play dashboards that ensure you always shine in front of your audience. It’s time to reclaim your week, reduce administrative fatigue, and lead with absolute data confidence.
Key Takeaways
- Discover how modern automation Excel templates utilize built-in logic to turn your spreadsheet from a static file into a dynamic, low-code data hub.
- Learn how to leverage Power Query to automate data imports, effectively ending the cycle of manual copy-pasting and human oversight errors.
- Understand the critical architectural differences between fragile basic trackers and professional-grade frameworks that scale alongside your business growth.
- Follow a proven 5-step checklist to standardize your data inputs and map fields for a seamless, “plug-and-play” reporting experience.
- Explore how to elevate your professional presence with high-impact dashboards that transform complex datasets into clear, meeting-ready visualizations.
Automation Excel Templates: Why They Matter in 2026
Imagine a workday where your reports update themselves while you focus on high-level strategy. This isn’t a futuristic dream; it’s the reality of using professional automation Excel templates. These tools are pre-structured files engineered with built-in logic to process, calculate, and visualize data without constant human intervention. As we move through 2026, the trend has shifted decisively toward “low-code” automation. This means you can harness complex data pipelines within the familiar spreadsheet environment you already use every day.
By implementing these frameworks, businesses are seeing a massive shift in efficiency. Industry experts suggest that high-quality templates can reduce manual data entry by up to 70%, allowing teams to focus on analysis rather than assembly. These tools act as a vital bridge, turning messy, raw data into the professional insights you need to lead with confidence. They are a core part of modern business process automation, ensuring that your technical infrastructure supports your growth rather than hindering it.
The Core Components of an Automated Spreadsheet
What makes a template “automated” rather than just “functional”? It comes down to the underlying architecture. Professional-grade automation Excel templates rely on a few key pillars to ensure they remain robust and reliable:
- Dynamic Formulas and Named Ranges: These aren’t static cells. They use modern functions that automatically expand as you add new rows of data, ensuring your calculations never miss a beat.
- Conditional Formatting: This provides instant visual KPI alerts, highlighting trends or risks the moment data is entered so you can react in real-time.
- Pre-configured Pivot Tables: These allow for rapid data summarization, giving you a 360-degree view of your operations in seconds without needing to rebuild charts every month.
Automation vs. Manual Spreadsheets: The Productivity Gap
The difference between a manual tracker and an automated framework is staggering. Research shows that 88% of unaudited corporate spreadsheets contain errors, often due to the fatigue of manual copy-pasting. These mistakes aren’t just annoying; they’re expensive. Operations workers often lose over three hours every week just fixing broken links and typos, which adds up to 22 working days per year.
Excel automation is the strategic removal of repetitive manual tasks through the use of pre-defined logic and structured data flows. By switching to an automated dashboard, you’re not just saving time; you’re protecting your professional reputation. Instead of spending your Friday afternoon troubleshooting a “Franken-sheet,” you can deliver a polished, error-free report that makes you shine in front of your stakeholders.
How Automated Templates Eliminate Manual Data Entry
The secret to modern efficiency lies in the engine beneath the surface. Professional automation Excel templates leverage Power Query, a sophisticated tool that handles the “Extract, Transform, and Load” process automatically. Instead of spending your morning cleaning data, you simply point the template to your source file. It scrubs the duplicates, fixes the formatting, and populates your reports instantly. This shift toward the automation of routine data tasks isn’t just about speed; it’s about eliminating the human oversight that leads to costly reporting errors.
Reliability is built into the design through strict data validation. By using dropdown menus and protected formula layers, these templates prevent users from accidentally “breaking” the logic. You don’t need to be a coding expert to benefit, either. While the “VBA vs. Formula-based” debate continues, 2026 has seen a major move toward formula-driven logic and Office Scripts. These methods are more accessible and compatible with Excel for the Web, ensuring your automation Excel templates work across every device your team uses. If you want to see this in action, exploring a professionally designed Excel dashboard template is the best way to start.
The Power of Dynamic Data Refresh
True automation means never having to “re-build” a chart. In a professional framework, the “One-Click Refresh” button is your best friend. You can connect your workbook directly to external sources like CSV files, SQL databases, or even live web feeds. Once the connection is established, the data flows into your pre-configured pivot tables and charts without you lifting a finger. This ensures your visual KPIs stay current, giving you a real-time pulse on your business operations while maintaining total data integrity.
Bridging the Gap: From Excel to Power BI
Many professionals wonder when it’s time to move beyond the spreadsheet. The truth is that Excel is often the perfect foundation for Power BI dashboard templates. Because both platforms share the same Power Query engine, the transition is seamless. You can maintain a “Single Source of Truth” in Excel and later scale into a dedicated BI tool when you need to handle massive datasets or complex multi-user collaboration. Starting with a structured Excel template ensures your data is clean and ready for the next level of professional visualization.
Comparing Basic Trackers vs. Professional Automation Frameworks
Are you still using a spreadsheet that looks like it belongs in the late nineties? While basic trackers might suffice for a simple grocery list, they often crumble under the weight of corporate data. The primary difference between a standard file and professional automation Excel templates lies in the architecture. Basic trackers are usually static, requiring you to manually update every sum and range. In contrast, professional frameworks are interactive engines designed for scalability. They don’t just store data; they process it through advanced calculation layers that stay fast even as your records grow into the thousands.
Design isn’t just about “looking good” either; it’s about establishing corporate credibility. When you walk into a high-stakes meeting, the aesthetics of your report speak volumes before you even open your mouth. High-impact business presentation templates provide a level of polish that free, generic sheets simply can’t match. Research from McKinsey & Company shows that automating repetitive work can lead to efficiency gains of 20% to 40%. By choosing a professional framework, you aren’t just buying a file; you’re investing in a system that ensures your data remains a high-performance asset rather than a liability.
Feature Comparison: Basic vs. Premium Automation
What sets a premium template apart from the rest? It’s the difference between a tool that helps you survive the week and one that helps you lead the quarter. Consider these three pillars:
- Design Quality: Premium templates maintain brand consistency with professional color palettes and intuitive layouts that guide the reader’s eye to what matters.
- Calculation Engines: Instead of simple sums, professional templates use robust logic that handles complex scenarios like multi-currency conversions or year-over-year growth automatically.
- Lifetime Support: Unlike “one-and-done” free downloads, professional resources often include free lifetime updates to stay compatible with new Excel versions.
Choosing the Right Automation Level for Your Team
Don’t jump into the most complex system immediately. Start by auditing your current manual reporting needs to identify exactly where your team is losing time. Are you spending hours on data cleaning? That’s a “bottleneck” task that requires automation Excel templates with built-in Power Query logic. The goal is to balance technical power with ease of use. If a tool is too difficult for your team to adopt, it won’t save time in the long run. Look for “plug-and-play” solutions that offer sophisticated results without requiring your staff to learn complex coding or advanced VBA.
Implementing Automation: A 5-Step Checklist for Business Success
Achieving peak efficiency with automation Excel templates doesn’t require a high-priced consultant or months of technical training. It’s about following a disciplined, logical setup that ensures your data flows correctly from the very first click. By adopting a self-service model, you take full control of your reporting destiny and ensure your workflows remain agile. Use this five-step checklist to transform your manual spreadsheets into a high-performance automated system that works for you.
- Step 1: Clean and Standardize: Before importing any information, ensure your raw data is free from formatting inconsistencies. This is the essential foundation of a reliable, error-free report.
- Step 2: Map Your Fields: Carefully align your existing data headers with the automated template’s built-in structure. This mapping ensures the calculation engine identifies and processes the correct variables.
- Step 3: Stress Test the Logic: Run the “Data Refresh” function with a small sample data set first. Check for broken links or calculation anomalies before committing your entire historical database.
- Step 4: Align with Branding: Personalize the dashboard colors, fonts, and logos to match your corporate identity. A report that visually mirrors your brand carries significant weight during executive presentations.
- Step 5: Document the SOP: Create a simple Standard Operating Procedure for the update process. This documentation ensures continuity and prevents reporting gaps if a key team member is unavailable.
Data Cleaning: The Foundation of Automation
The “Garbage In, Garbage Out” rule is absolute. To prevent formula breakage and ensure accuracy, you must proactively remove duplicates and fix formatting errors like trailing spaces or inconsistent text casing. Setting up standardized Excel Tables is a best practice that keeps your data structured and predictable. This consistency allows your automation Excel templates to function at their best, ensuring that dates, currencies, and categories remain uniform across every row of your dataset.
Maintaining Your Automated Workflow
Once your system is live, focus on long-term health and scalability. Troubleshooting common refresh errors often comes down to checking file paths or data types. As your business grows, you’ll need to manage increasing data volumes within interactive excel dashboard templates by optimizing your Power Query steps or archiving legacy records. Maintain strict version control and use secure cloud sharing to ensure your team always accesses the most current data. Ready to lead with confidence? Download your professional automation template and start reclaiming your time today.
Elevate Your Productivity with Biz Infographs Automation Resources
Why settle for mediocre spreadsheets when you can lead with absolute excellence? At Biz Infographs, we’re dedicated to transforming your daily data frustration into a source of enduring professional pride. We believe that high-quality design should be accessible to everyone, regardless of their technical background. Our automation Excel templates aren’t just files; they’re productivity partners engineered to help you shine in front of your audience. By adopting these frameworks, you achieve best-in-class results with minimal design effort, allowing you to focus on the strategic decisions that drive your business forward.
We provide a specialized range of Excel dashboard templates available for immediate download. These tools are built to handle the complexities of 2026 business environments while remaining incredibly easy to use. One of our most significant advantages is the value of free lifetime updates. As software evolves and business needs shift, your templates will stay current without requiring additional purchases. This ensures your reporting engine remains a high-performance asset for years to come.
Why Professionals Choose Biz Infographs
We focus on high-impact data visualization that does more than just display numbers; it tells a compelling story. Our products empower you to become the “Expert Facilitator” or the go-to specialist in your organization. When you use a Biz Infographs template, you’re adopting a global standard of professional aesthetics. Our designs are polished, sophisticated, and mirror the high-end nature of the world’s leading corporations. We take the “struggle” out of data design so you can walk into every meeting with the confidence of a seasoned pro.
Getting Started with Professional Automation
Your journey toward a more efficient workday starts with a single choice. Browse our extensive library to select the right template for your industry, whether you’re managing HR, sales, or finance. The transition from download to a fully functional, automated dashboard is seamless and fast. You won’t need to spend hours on manual setup or complex coding. It’s time to stop fighting with your data and start making it work for you. Explore our Automation Templates to start saving time today and experience the relief of a streamlined workflow.
Step Into the Future of High-Performance Reporting
The transition from manual copy-pasting to a streamlined, automated workflow is no longer optional for professionals who want to lead. You’ve seen how automation Excel templates eliminate the risk of human error while reclaiming hours of your workweek. By implementing a structured framework and utilizing Power Query logic, you move beyond basic tracking and into the world of sophisticated data storytelling. It’s about more than just efficiency; it’s about having the confidence to present your results with absolute authority.
Biz Infographs is proud to be your productivity partner, providing tools that are trusted by professionals worldwide. Our templates offer professional dashboards ready in minutes, ensuring you always shine in front of your audience. With the added security of free lifetime updates, your reporting engine will remain robust through 2026 and beyond. Don’t let repetitive tasks hold back your career growth any longer. Browse Professional Automation Excel Templates today and experience the relief of a truly optimized business workflow. You have the talent; now you have the tools to match it.
Frequently Asked Questions
Can I use automation Excel templates if I don’t know VBA?
You don’t need any VBA or coding knowledge to use our professional automation Excel templates. Most modern frameworks are built using Power Query and advanced dynamic array formulas that handle the logic behind the scenes. You simply enter your data into the designated input tables, and the dashboard updates automatically. This “plug-and-play” approach ensures you spend your time analyzing results rather than writing complex scripts or troubleshooting broken macros.
Will these templates work on both Windows and Mac versions of Excel?
Yes, these templates are designed to work seamlessly on both Windows and Mac versions of Microsoft Excel. Because we prioritize formula-based logic and standard Excel features, you won’t run into the compatibility issues often found with legacy VBA-heavy files. Whether you’re using a PC at the office or a MacBook on the go, your data visualizations will remain crisp, functional, and professional. It’s the perfect solution for teams using diverse hardware across the organization.
Do I need to pay for a subscription to use Biz Infographs templates?
No subscription is required to access and use Biz Infographs templates. We operate on a transparent one-time purchase model, giving you full ownership of your digital assets without recurring monthly fees. Once you buy a template, it’s yours to keep forever. We even provide free lifetime updates to ensure your tools stay compatible with the latest software versions. This model offers exceptional value for businesses looking to professionalize their reporting without adding to their SaaS overhead.
How do I update the data in an automated Excel dashboard?
Updating your data is a straightforward process that takes only a few minutes. You simply paste your raw data into the structured input tables provided within the template. Once your new information is in place, you navigate to the “Data” tab and click “Refresh All.” The underlying Power Query engine or calculation layer immediately processes the new figures, updating every chart and KPI card across your entire dashboard instantly. It’s a massive time-saver compared to manual entry.
Can I customize the colors and fonts to match my company branding?
You can absolutely customize every visual element to align with your corporate branding. Our templates are fully unlocked, allowing you to change colors, fonts, and logos with just a few clicks using standard Excel formatting tools. This flexibility ensures your reports look like they were custom-built by an expensive design agency. By matching your brand’s identity, you reinforce your professional credibility every time you share a report with stakeholders or present in high-stakes meetings.
Are these templates compatible with Microsoft 365 and Excel for the Web?
Our automation Excel templates are fully compatible with Microsoft 365 and Excel for the Web. Since we focus on modern spreadsheet architecture, your files will sync perfectly across OneDrive and SharePoint for real-time collaboration. While some advanced Power Query features are best managed in the desktop application, the resulting dashboards are viewable and functional in a web browser. This ensures your team can access critical business insights from any device, anywhere in the world, at any time.
What happens if I need help with my template after purchase?
We’re committed to your success and offer dedicated support if you encounter any challenges with your template. If you have questions about data mapping or need help troubleshooting a specific feature, our team of experts is ready to guide you. We want you to feel empowered as a “Productivity Partner” within your organization. Our free lifetime updates mean you’ll always have access to the most refined and improved versions of the products you’ve already purchased.
Can I integrate these Excel templates with Power BI?
You can easily integrate these templates with Power BI to take your data visualization to the next level. Since both Excel and Power BI use the same Power Query engine, your structured Excel data serves as the perfect “Single Source of Truth” for more complex BI models. You can connect a Power BI report directly to your automated Excel file, allowing your high-performance dashboards to scale alongside your business as your data needs become more sophisticated and multi-layered.