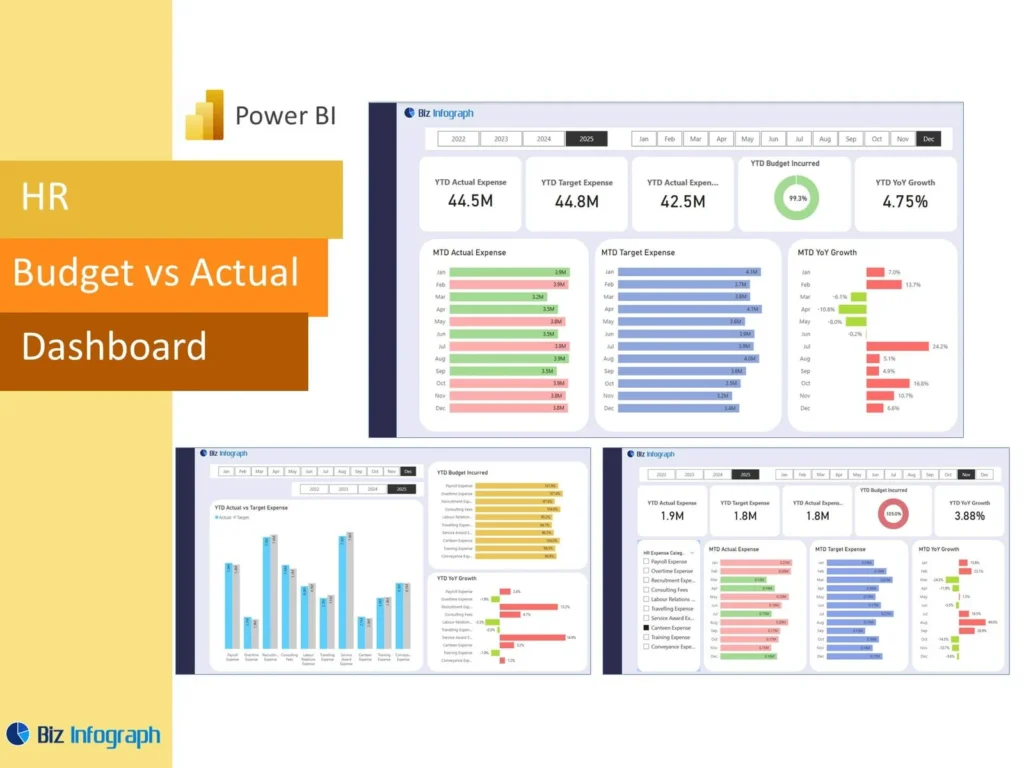
Introduction to HR Budget vs Actual Dashboard Power BI
What Is an HR Budget vs Actual Dashboard Power BI and Why It Matters
An HR Budget vs Actual Dashboard Power BI report is a visual tool that compares planned HR spending with real workforce costs in one place. It helps the human resources department understand whether current people-related spending is in line with expectations or whether changes are needed. A strong power bi HR dashboard brings together budget, actuals, and workforce trends so leaders can review performance quickly. This matters because HR spending is influenced by hiring, turnover, absence, compensation, and other workforce factors. Clear reporting helps teams monitor cost movement and make better decisions before small issues become major budget gaps.
How an HR Dashboard Supports Budget and Actual Workforce Reporting
A well-designed HR Dashboard supports budget reporting by connecting workforce cost, hiring activity, and staffing changes in one view. It allows HR teams to compare planned spending with real outcomes while also reviewing the workforce events behind those changes. This makes the dashboard more useful than a simple finance report because it shows not only the numbers, but also the people factors influencing them. A strong dashboard can highlight variance, headcount movement, and hiring activity so teams can better understand cost pressure. This supports stronger workforce planning and gives leadership more clarity when reviewing HR performance.
Why Businesses Use an HR Budget vs Actual Dashboard Power BI Template
Many organizations use an HR Budget vs Actual Dashboard Power BI Template because it gives them a structured way to monitor workforce spending without rebuilding the report each cycle. A reusable template includes summary KPIs, cost comparisons, headcount views, and trend charts in a consistent format. This helps HR professionals produce clearer reports faster and improves reporting discipline across months or quarters. A strong HR Budget vs Actual Dashboard Power BI template also supports repeatable analysis, making it easier to compare one period to the next. This saves time and improves the reliability of workforce cost reporting.
Core Benefits of HR Budget vs Actual Dashboard Power BI
Improving Budget Visibility with a Power BI HR Dashboard
A power bi HR dashboard improves visibility by showing workforce budget and real spending side by side. This makes it easier for HR leaders to understand where costs are staying within plan and where spending has shifted unexpectedly. Better visibility is important because workforce cost changes can come from hiring, overtime, attrition, absenteeism, or role changes. A dashboard helps users review these patterns in one place and supports more controlled spending decisions. When the budget view is clear, the organization can allocate resources more effectively and manage HR spending with more confidence.
How KPIs and Metrics Support Better HR Budget Decisions
Clear KPI views and meaningful metric selection make an HR budget dashboard much more valuable. A strong report should highlight the most important KPIs such as headcount, payroll movement, hiring cost, absence-related cost, and budget achievement. These measures help HR professionals and finance partners understand where workforce spending is changing and why. Good management metrics make the report easier to interpret and help teams focus on what matters most. When metrics are chosen carefully, the dashboard supports stronger review meetings and gives leadership a more useful basis for workforce budget decisions.
Using Microsoft Power BI for Interactive Dashboards and Reporting
Microsoft power tools make HR reporting more flexible, especially when organizations need interactive dashboards rather than static spreadsheets. Power BI provides filtering, trend analysis, and drill-down capabilities that let HR users move from a summary into deeper workforce review quickly. This makes the report more useful in meetings and supports better follow-up when questions arise. A strong vs actual dashboard power bi setup can help users compare teams, time periods, or cost categories in seconds. That interactivity improves reporting quality and helps the business make faster, more data-driven decisions about workforce spending.
Key Metrics in an HR Budget vs Actual Dashboard Power BI
Essential Budget, Actuals, and KPI Measures to Track
Every HR Budget vs Actual Dashboard Power BI report should include essential budget and actuals measures such as planned HR cost, actual workforce cost, dollar difference, and percentage variance. These should be supported by important key metrics such as payroll cost, benefit cost, overtime, and hiring-related spending. A good dashboard makes these totals visible immediately so leaders can understand the current position at a glance. With the right KPI structure, HR teams can evaluate whether workforce spending is aligned with plan and whether certain areas require early attention or corrective action.
Using Headcount and Workforce Metrics for Better Budget Review
Budget review is much stronger when cost is linked to workforce size and change. A dashboard should show headcount, number of employees, and related workforce movement alongside spending so that leaders understand the real reason behind shifts in cost. For example, higher actual spending may result from faster hiring, while lower spending may be linked to vacancies or attrition. This view also helps HR compare spending with changes in job role structure, team size, and workload. Connecting workforce size with cost gives the business a more complete understanding of HR budget performance.
Measuring HR Budget Performance with KPI and Actuals Views
A strong dashboard should show HR budget performance through clear KPI summaries and detailed actuals views. These views help the business compare planned workforce cost with what actually happened and assess whether the difference is normal or needs attention. Good visual summaries help leadership measure progress and understand how close the organization is to plan. When budget and actual spending are reviewed with meaningful KPI context, the report becomes more actionable. This supports better workforce planning, better communication with finance, and stronger confidence in how HR costs are being managed over time.
HR Budget vs Actual Dashboard Power BI Features
How HR Budget vs Actual Dashboard Power BI in Excel Supports Reporting
Many organizations begin workforce budgeting in spreadsheets, so HR Budget vs Actual Dashboard Power BI in Excel often starts with budget and headcount tables prepared in Excel. This is practical because Excel is already familiar to HR and finance teams. Those files can then feed Power BI for deeper analysis and clearer visuals. Once the data is connected, the dashboard becomes more powerful and easier to interpret than spreadsheets alone. This approach helps organizations move from manual comparison into stronger reporting while keeping their existing reporting workflow and budget preparation process largely intact.
Building Better Reports with Power BI HR Dashboard Design
Good dashboard design is essential because workforce budget reports can quickly become difficult to read if too much detail is shown at once. A strong power bi HR dashboard should begin with high-level budget and actual comparisons, followed by trend charts and more detailed breakdowns. A clean layout helps users understand the numbers faster and keeps attention on the most important changes. A clear design also supports easier discussion across HR and finance. When the report is designed well, the dashboard becomes more useful for both executive review and operational follow-up.
Why an HR Budget vs Actual Dashboard Power BI Template Saves Time and Improves Accuracy
A reusable HR Budget vs Actual Dashboard Power BI Template saves time because it gives users a repeatable reporting structure that can be refreshed with new data. Teams do not need to redesign visuals or rebuild the report every month. Templates also improve accuracy because calculations, layout, and logic stay consistent across periods. This makes comparisons more dependable and helps reduce reporting errors. For organizations managing recurring workforce budget reviews, a template is a practical solution that supports better reporting efficiency and stronger communication between HR and finance.
Budget Reporting and Workforce Analysis
Using an HR Dashboard to Compare Budget and Actuals Over Time
An HR Dashboard is most useful when it compares budget and actuals across multiple periods, not just one month. This lets the organization see whether the gap is narrowing, growing, or moving unpredictably. Trend reporting improves understanding because one unfavorable month may not mean the same thing as a long-term pattern. By reviewing budget and actual cost over time, HR can identify consistent overspending or underuse of budget. This helps the business plan more effectively, improve forecast quality, and respond earlier to workforce-related spending issues before they become larger concerns.
Tracking Headcount and Budget Changes with Interactive Dashboards
Interactive dashboards are especially useful for HR budget reporting because workforce cost is often shaped by headcount movement. A good dashboard lets users compare budget and actual spending by headcount, department, role, or period. This makes it easier to understand whether the change is coming from additional staff, unplanned turnover, or hiring delays. Interactivity also helps the business track progress more effectively because users can move from a summary to more detailed analysis quickly. Strong interaction improves the usefulness of the report and makes workforce budget review more dynamic and more informative.
How Workforce Metrics Improve HR Budget Reporting Insights
Budget analysis becomes much more meaningful when workforce measures are included. Metrics such as turnover rate, average tenure, number of new hires, time to hire, and time-to-fill all affect HR cost and staffing stability. By combining these with cost reporting, the dashboard gives stronger workforce analytics and more useful explanations for why spending changed. For example, higher recruiting cost may be linked to increased turnover, while lower salary spending may come from delayed hiring. These insights help HR understand workforce cost more completely and improve the quality of budget-related reporting.
Dashboard Design and Practical Use
Creating Clear KPI and Metric Views for Budget Reporting
Clear KPI views help leaders understand workforce budget status quickly. A dashboard should show the most important budget indicators first, such as planned cost, actual cost, cost gap, and headcount movement. Supporting metric views can then explain the cause of change, such as absence, new hiring, or role shifts. Good KPI design improves reporting speed and supports clearer discussions. It also makes the report more useful for senior users who need a concise summary before moving into detail. Clear views turn complex workforce cost data into something much easier to interpret and act on.
Organizing Budget, Actuals, and Headcount Data in Power BI
Strong budget reporting depends on well-organized source data. Workforce budget tables, actual payroll data, and headcount information need to be arranged consistently before they are loaded into Power BI. This may include data coming from hr systems, hris, adp, sap successfactors, or other internal sources. Some organizations also combine information from learning management systems or recruitment tools when they want to explain hiring-related costs. Strong data sources and a clean dataset improve reporting quality and make the dashboard easier to maintain. Better organization leads to clearer and more dependable workforce budget analysis.
Adapting an HR Budget vs Actual Dashboard Power BI Template to Business Needs
Every organization has different analytics needs, so the dashboard should be flexible enough to match those needs. One company may focus on payroll and benefits, while another may care more about hiring cost, overtime, or absence-related spending. Some may want to review gender distribution, workforce demographics, or other demographic factors alongside workforce cost. Others may prefer a more high-level financial view. A flexible HR Budget vs Actual Dashboard Power BI template can be tailored to those priorities, making the report more relevant and more useful for the actual questions the business wants answered.
Practical Value of HR Budget vs Actual Dashboard Power BI
Supporting Better HR Budget Decisions with Power BI Reporting
A strong HR Budget vs Actual Dashboard Power BI report supports better decisions because it helps teams understand where cost is aligned with plan and where changes need attention. With a clearer view of budget, headcount, and workforce movement, HR can make data-driven decisions about hiring, staffing priorities, and cost control. Better reporting also makes it easier to discuss workforce plans with finance and leadership. When the dashboard is used consistently, it becomes a stronger tool for workforce planning and helps the business respond more effectively to changing workforce cost conditions.
Improving Workforce Cost Visibility Through Interactive Dashboards
Workforce cost is influenced by many factors, including headcount, absence, hiring, turnover, and compensation changes. Interactive dashboards improve visibility by allowing HR and finance to review those drivers in one place. A dashboard may show cost by business unit, role, or trend period and let users move quickly between those views. This makes budget review more practical and more informative. Better visibility also supports faster action when cost patterns change. For organizations that need a stronger understanding of workforce spending, interactivity adds major value to HR budget reporting.
Building an HR Dashboard for Different Budget Reporting Goals
Different businesses have different HR reporting goals, so the dashboard should be built accordingly. Some organizations may focus on employee engagement, employee satisfaction, or absence impacts, while others care more about hiring cost, cost-per-hire, or workforce structure. Some may also want to explore predictive models, machine learning, or signals that help them foresee future HR cost pressure. A flexible HR Dashboard can support these different objectives while keeping budget and actual comparisons clear. This makes the dashboard more adaptable and better suited to the organization’s changing workforce needs.
Conclusion
Why an HR Budget vs Actual Dashboard Power BI Template Is a Practical Reporting Tool
An HR Budget vs Actual Dashboard Power BI Template is practical because it combines consistency, flexibility, and reporting speed in one solution. It helps organizations compare budget and actual workforce cost more clearly, review supporting metrics, and maintain the same reporting structure over time. Templates also reduce repetitive design work and make recurring analysis easier. With the right setup, the dashboard can support role-based access, encryption, and audit needs while still remaining usable across teams. This makes it a strong reporting tool for workforce budgeting and cost visibility.
Final Thoughts on Using an HR Dashboard for Better Workforce Budget Reporting Insights
A well-built HR Dashboard for budget reporting helps organizations understand workforce spending in a clearer and more useful way. It turns budget, actuals, headcount, and workforce trends into information that leaders can actually use. As organizations grow and reporting needs become more complex, power bi can transform workforce budget data into a more strategic decision-making tool. With strong scalability, real-time visibility, and meaningful analysis, the dashboard helps HR and finance move beyond static reports and manage workforce cost with greater confidence and better insight.
For ready-to-use Dashboard Templates: