Why E-commerce Dashboard Template Packages Matter
From ecommerce data to data-driven decisions
In modern ecommerce business operations, data is everywhere—Shopify orders, Google Analytics traffic, email campaigns, returns, and payment transactions across multiple sales channels. However, raw ecommerce data alone does not create growth. A dashboard is a centralized system that turns scattered numbers into data into actionable insights. With ecommerce analytics, you can spot sales trends, identify sales patterns, and understand what’s driving total sales. In dashboard in 2025, ecommerce companies must go beyond intuition and make decisions backed by data analytics. A dashboard for ecommerce helps ecommerce teams react faster, optimize pricing, measure ecommerce conversion rate, and improve campaign ROI. Ultimately, dashboards enable ecommerce success by helping e-commerce sellers track sales and build smarter sales strategies.
Benefits of using dashboard templates vs custom dashboards
Many ecommerce brands struggle between building custom dashboards from scratch and using a proven ecommerce dashboard template package. Custom dashboards offer flexibility but usually require advanced data analytics resources, longer setup time, and continuous maintenance—especially when working across e-commerce platforms. Dashboard template packages solve this by providing a ready dashboard solution with pre-built ecommerce KPIs, layouts, and ecommerce reporting dashboard logic. Templates also reduce errors because they are designed using best practices from high-performing ecommerce companies. They help ecommerce teams start faster, boost sales, and monitor performance dashboards without heavy technical work. Whether you use Excel, Power BI, or a dashboard tool like Looker Studio, templates standardize reporting. Many teams even use tools like Figma to redesign dashboard template visuals, keeping the package professional and brand-friendly.
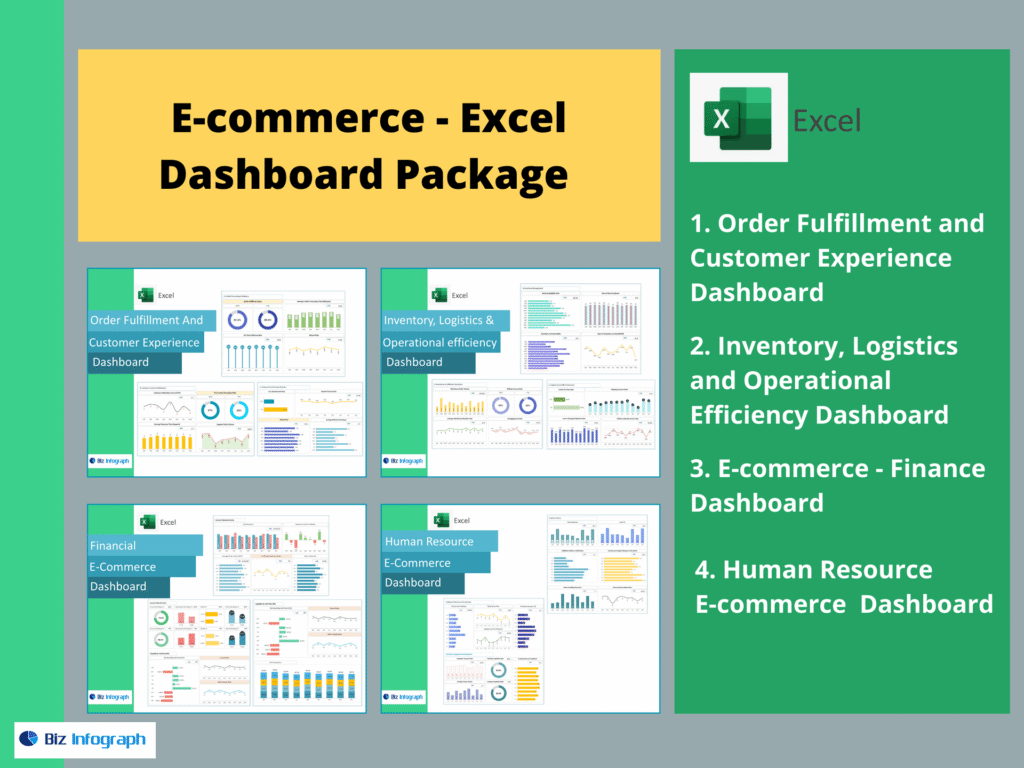
What to Expect Inside an E-commerce Dashboard Package
Ready-to-use dashboard template structure
A quality e-commerce dashboard package includes dashboards built around the real workflow of ecommerce teams—finance, marketing, operations, and product. The ecommerce dashboard template structure typically includes KPI cards, trend charts, category drilldowns, and customer segmentation. These dashboards help ecommerce business owners track sales, analyze insights into sales, and compare performance across periods. Most packages also include built-in filters like time range, sales channels, geography, device type, and product category. This structure supports data analytics storytelling: from high-level summary down to detailed root causes. In dashboard in 2025, the best template packages are designed to integrate ecommerce data from multiple e-commerce platforms and even support advanced infrastructure like a data warehouse. That’s what makes templates reusable across ecommerce companies and scalable ecommerce brands.
Common ecommerce dashboard examples included
Most template packages offer multiple ecommerce dashboard examples to help you analyze every major business area. Typical dashboards include a financial dashboard focused on revenue, profit, and total sales; a customer insights dashboard showing buying behavior; a marketing dashboard tracking ecommerce conversion rate; product dashboards that highlight best sellers; and fulfillment dashboards that measure delivery performance. Each dashboard example is based on standard ecommerce KPIs so it works whether you sell on your ecommerce site, Shopify, Amazon, or multi-channel setups. These ecommerce dashboard examples are extremely useful for e-commerce sellers who want fast clarity. They also help ecommerce teams align around the same “single truth,” avoiding confusion caused by spreadsheets and inconsistent reporting dashboards across departments.
Sales & Revenue Performance Dashboard Template
Key metrics and ecommerce KPIs to track
The Sales & Revenue dashboard template is the core financial performance dashboard in any ecommerce dashboard template package. It focuses on key ecommerce KPIs such as total sales, average order value, revenue growth rate, discount rate, gross profit, net profit, and refund impact. For ecommerce companies, these metrics help uncover true performance beyond surface-level sales numbers. Sales trends over time reveal demand patterns and seasonality, which helps ecommerce teams plan inventory and promotions. The dashboard also highlights sales strategies effectiveness by tracking bundles, upsells, and pricing adjustments. The most valuable feature is how it converts raw ecommerce analytics into decisions: identifying which product lines drive growth, where margins are shrinking, and what actions can boost sales. This makes it a must-have dashboard for ecommerce.
Ecommerce reporting dashboard layout (weekly/monthly)
A practical ecommerce reporting dashboard should support weekly and monthly reporting cycles. Weekly dashboards focus on short-term movement: campaign effects, sales trends, traffic spikes, and delivery issues. Monthly reporting dashboards focus on long-term growth: revenue trends, customer retention, and comparison across sales channels. A well-designed ecommerce dashboard template package includes both layouts. Weekly reporting helps ecommerce teams stay agile, while monthly dashboards help leadership evaluate overall ecommerce success. The best reporting structure is consistent: same KPIs, same definitions, same filters—so stakeholders stop arguing about numbers. This creates a “single truth” dashboard solution that improves decision speed and helps ecommerce brands track sales with confidence.
Customer & Marketing Analytics Dashboard Template
Google Analytics ecommerce analytics metrics
Customer acquisition and marketing performance are best measured through ecommerce analytics using Google Analytics. The marketing dashboard template typically includes sessions, users, traffic sources, product views, add-to-cart rates, and ecommerce conversion rate. These metrics help ecommerce teams understand visitor behavior on the ecommerce site and identify why customers drop off during checkout. A strong dashboard for ecommerce highlights organic vs paid performance and tracks how different campaigns contribute to total sales. When connected to ecommerce platforms like Shopify, the dashboard becomes even stronger because it matches traffic behavior with order-level revenue. In dashboard in 2025, ecommerce companies rely heavily on accurate marketing dashboards to justify spending and optimize ad strategy across sales channels.
Data-driven traffic source and conversion tracking
A high-performing customer insights dashboard must track traffic sources across Google, Meta, email, affiliates, and marketplaces. Conversion tracking is the heart of modern ecommerce business growth: without it, ecommerce teams cannot improve funnel performance. The dashboard template should show conversion rate by source, by device, and by campaign. It should include trends over time so you can detect sales patterns and understand what’s behind sales trends. Data analytics also helps identify if your ecommerce conversion rate drops due to site speed, pricing, poor offer quality, or checkout friction. Turning data into actionable insights means this dashboard highlights the best opportunities to boost sales. For e-commerce sellers, conversion dashboards help turn marketing spend into measurable ecommerce success.
Product & Inventory Metrics Dashboard Template
Product performance key metrics (SKU-level)
Product-level visibility is essential for ecommerce success. A product dashboard template should highlight SKU performance metrics such as units sold, revenue contribution, gross margin, return rate, and sell-through rate. This dashboard for ecommerce helps ecommerce teams identify top performers and slow movers. When ecommerce analytics is applied at SKU level, you can see sales patterns—like which products spike during promotions or which items lose demand over time. Ecommerce companies can use these insights into sales to optimize pricing and bundling. A strong ecommerce dashboard template also includes product category comparisons, helping e-commerce sellers decide where to invest inventory and where to discontinue products.
Inventory KPIs and restock insights
Inventory dashboards help ecommerce brands avoid stockouts and reduce overstock. The dashboard template should track inventory turnover, days of inventory on hand, reorder points, stockout frequency, and aging inventory. These are critical ecommerce KPIs, especially for ecommerce business owners selling across multiple e-commerce platforms. Inventory dashboards also support sales strategies by ensuring product availability during peak sales channels demand. Without accurate inventory reporting, ecommerce teams may lose revenue due to stockouts or waste money on slow-moving products. In dashboard in 2025, inventory dashboards become even more powerful when connected to a data warehouse because data refresh becomes automated and accurate. This dashboard solution turns inventory data into actionable insights that protect profits.
Operations & Fulfillment Performance Dashboard Template
Shipping, returns, and customer satisfaction metrics
Operational dashboards help ecommerce teams deliver better customer experience. Shipping metrics include average delivery time, late shipment rate, fulfillment accuracy, and logistics cost per order. Return metrics include return reasons, return rates by product, and refund processing time. These are key ecommerce KPIs for ecommerce companies aiming for long-term success. A strong performance dashboard helps ecommerce brands detect patterns such as “high return products” or fulfillment delays impacting conversion. In dashboard in 2025, operations dashboards must also support customer satisfaction indicators, because customer experience directly impacts repeat sales. This dashboard solution improves operational accountability and supports ecommerce teams in building a reliable order-to-delivery system.
Operational ecommerce KPIs to monitor
Operational ecommerce KPIs include order processing time, pick-pack accuracy, fulfillment cycle time, shipping cost percentage, inventory discrepancy rate, and customer complaints. These KPIs help ecommerce business owners control cost while scaling. As ecommerce brands grow across sales channels, operational complexity increases. With a dashboard for ecommerce operations, ecommerce teams can track bottlenecks daily and prioritize improvements. Data analytics makes the dashboard actionable by highlighting which region or courier causes delays. It also connects operations performance to sales strategies: faster delivery improves reviews and boosts sales. E-commerce sellers who monitor operations dashboards avoid customer dissatisfaction and protect ecommerce success.
Data Sources Needed for Your Ecommerce Dashboard
Shopify as the main ecommerce data source
Shopify is one of the most popular e-commerce platforms, making it a primary ecommerce data source for dashboards. A Shopify-integrated ecommerce dashboard template can automatically pull data on orders, customers, products, refunds, and discount codes. This enables ecommerce teams to track sales, analyze sales trends, and build strong ecommerce reporting dashboards. Shopify data is especially valuable because it connects operational and financial details in one source. When integrated with data analytics tools, Shopify dashboards can show insights into sales by product, customer segment, and channel. In dashboard in 2025, ecommerce companies prefer automated Shopify dashboards over manual spreadsheets, because automation improves accuracy and decision speed.
Google Analytics integration for analytics dashboards
Google Analytics provides critical ecommerce analytics insights, including visitor behavior, acquisition sources, landing page performance, and ecommerce conversion rate. Integrating Google Analytics with a dashboard tool creates a strong marketing and customer insights dashboard. Ecommerce brands can measure which campaigns drive buyers, where customers drop off, and how changes to the ecommerce site affect conversion. This data analytics layer helps ecommerce teams improve user experience and boost sales through smarter funnel optimization. In dashboards to use in 2025, combining Google Analytics with Shopify data is a best practice, because it connects traffic and revenue into one dashboard solution.
How to Choose the Best Dashboard Template Package
Matching dashboards to use in 2025 with your goals
Choosing the right dashboard package starts with goals. If you want to boost sales, focus on dashboards that highlight conversion, product performance, and sales trends. If you want profitability, prioritize financial dashboard templates with margin tracking and cost control. For customer growth, choose customer insights dashboards and ecommerce analytics templates. The best dashboards to use in 2025 are those aligned with your ecommerce business stage: startup, growth, or scaling. Ecommerce teams should select dashboards that provide data into actionable insights, not just visual charts. When choosing the right dashboard, look for packages that support your sales channels and integrate with your e-commerce platforms.
Selecting KPIs and key metrics for your ecommerce brand
Not all ecommerce KPIs matter equally. The best dashboard solution focuses on KPIs that drive action: total sales, conversion rate, customer retention, margins, stockouts, fulfillment performance, and CAC. Ecommerce brands must avoid KPI overload, because too many metrics reduce clarity. A smart ecommerce dashboard template highlights the most important key metrics, then allows drilldowns for deeper analysis. Ecommerce teams should also align KPI definitions so reporting stays consistent across departments. This ensures the dashboard is a centralized view of truth. In dashboard in 2025, KPI alignment becomes critical because ecommerce companies operate faster and require instant performance feedback.
For ready-to-use Dashboard Templates: