Understanding the Manufacturing Quality Performance Dashboard
What a Manufacturing Dashboard Is and How It Delivers Quality Insight
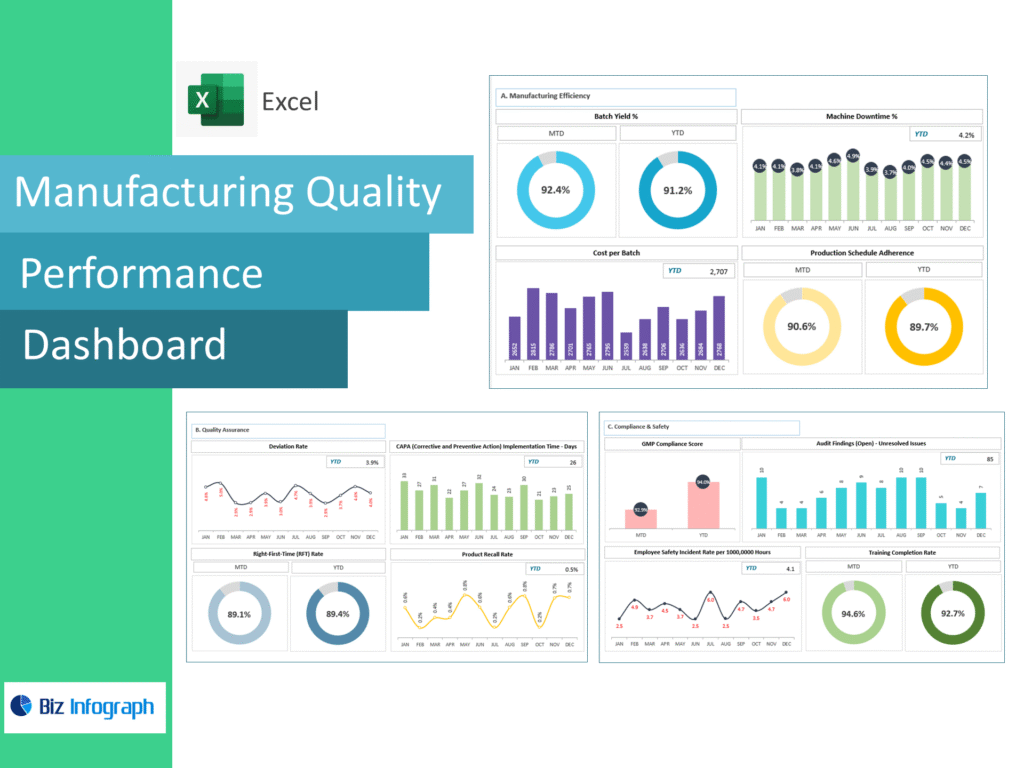
A manufacturing dashboard is a centralized, visual interface that consolidates manufacturing data to provide clear quality insight across production processes. In the manufacturing industry, quality outcomes are tightly linked to operational performance, cost control, and customer satisfaction. A quality-focused dashboard helps manufacturers monitor key performance indicators and metrics that matter—such as defect rates, yield, and compliance with quality standards—on a single dashboard. This visibility enables production leaders to understand performance in real time and take corrective actions quickly.
Modern manufacturing dashboards for visualizing production integrate production data, manufacturing data, and quality KPIs into a coherent view of production. By transforming raw data into actionable insight, the dashboard helps keep production aligned with business goals. Whether assessing percentage of products meeting specifications or tracking defects per million opportunities, a manufacturing dashboard provides the clarity needed to drive consistent product quality and long-term business success.
Role of Dashboards in Manufacturing for Shop Floor Visibility
Dashboards in manufacturing play a crucial role in delivering shop floor visibility. Operators and supervisors need a real-time view of production lines to ensure processes run smoothly and quality targets are met. Production dashboards display actual production, operator performance, and production volume metrics in an accessible format, allowing teams to respond immediately to issues as they arise.
Shop floor dashboards act as practical management tools, enabling supervisors to track production kpis, identify bottlenecks, and reduce waste through lean manufacturing practices. By providing a clear view of production, dashboards help teams maintain focus on quality and efficiency. This visibility supports continuous improvement initiatives and ensures that manufacturing operations remain aligned with operational performance goals.
Using Manufacturing Dashboards for Real-Time Production Monitoring
A manufacturing dashboard is a real-time monitoring tool that enables manufacturers to track production performance continuously. Real-time production monitoring is essential for maintaining quality standards and preventing costly disruptions. Dashboards aggregate live data from machines, sensors, and production systems to present performance in real time.
With real-time dashboards, manufacturers can monitor production efficiency, detect deviations from takt time, and address quality issues immediately. This capability helps keep production on schedule and minimizes defects. By delivering timely insights, dashboards help manufacturers maintain control over operations, improve responsiveness, and ensure consistent product quality across shifts and lines.
Manufacturing KPIs, Metrics, and Quality Measurement
Key Manufacturing KPIs and Metrics Tracked in a Quality Dashboard
A quality-focused manufacturing metrics dashboard tracks top manufacturing KPIs that reflect both efficiency and quality. These include defect rates, first-pass yield, rework percentages, and compliance with quality standards. Key metrics also cover production volume, scrap rates, and cycle efficiency, providing a balanced view of performance.
By consolidating kpis into a single dashboard, manufacturers gain clarity on how quality impacts operational outcomes and financial performance. Tracking important metrics consistently allows teams to benchmark progress and identify trends. A quality dashboard ensures that decision-makers focus on metrics that directly influence product quality and customer satisfaction.
Defect Metrics Including Defects per Million Opportunities
Defect metrics are central to any quality dashboard. Measures such as defects per million opportunities (DPMO) and percentage of products failing quality checks provide precise indicators of process capability. These metrics help manufacturers quantify quality performance and identify root causes of defects.
By visualizing defect metrics alongside production data, dashboards enable rapid analysis and corrective action. This integration supports continuous improvement and helps reduce waste. Understanding defect trends also highlights the financial impact of quality issues, reinforcing the importance of maintaining high standards across production processes.
Cycle Time, Production Volume, and Quality Performance Indicators
Cycle time and production volume are critical indicators of manufacturing performance that directly affect quality. Dashboards track these metrics to ensure processes operate within optimal ranges. Deviations in cycle time can signal inefficiencies or quality risks, while production volume trends reveal capacity and demand alignment.
By monitoring these indicators, manufacturers can balance speed and quality effectively. Dashboards provide insight into how changes in production rates influence defect rates and overall performance. This balanced approach supports sustainable operations and consistent quality outcomes.
Equipment Performance, Downtime, and OEE
Overall Equipment Effectiveness and Manufacturing KPI Analysis
Overall Equipment Effectiveness (OEE) is a cornerstone manufacturing KPI that combines availability, performance, and quality. A right manufacturing KPI dashboard tracks OEE to assess how effectively equipment is utilized. High OEE indicates efficient operations and strong quality control.
Dashboards display OEE trends alongside production metrics, helping manufacturers identify losses due to downtime, slow cycles, or defects. This analysis supports targeted improvement initiatives and aligns equipment performance with business goals.
Monitoring Downtime to Optimize Manufacturing Performance
Downtime monitoring is essential for optimizing manufacturing operations. Dashboards track planned and unplanned downtime, providing visibility into causes and duration. By analyzing downtime patterns, manufacturers can address root causes and improve reliability.
Reducing downtime enhances production efficiency and supports quality by minimizing disruptions. Dashboards help keep production on track and improve asset utilization, contributing to operational excellence.
Using OEE Metrics to Improve Right Manufacturing Outcomes
Using OEE metrics effectively supports right manufacturing—producing quality products efficiently and consistently. Dashboards enable manufacturers to monitor OEE components in real time and identify opportunities for improvement.
By aligning OEE insights with quality KPIs, manufacturers can optimize processes, reduce waste, and enhance product quality. This integrated approach drives continuous improvement and long-term success.
Analytics and Real-Time Insights in Manufacturing
Manufacturing Analytics for Quality and Performance Optimization
Manufacturing analytics enhance dashboards by enabling deeper analysis of quality and performance data. Analytics tools identify patterns, correlations, and trends that inform decision-making. By leveraging analytics, manufacturers can predict quality issues and optimize processes proactively.
Analytics dashboards support data-driven strategies that improve operational performance and quality outcomes. This capability is critical for maintaining competitiveness in complex manufacturing environments.
Real-Time Insights from Shop Floor and Production Data
Real-time insights from shop floor data empower manufacturers to respond quickly to issues. Dashboards integrate live data streams to provide immediate feedback on production and quality performance.
These insights help production leaders maintain control and ensure adherence to quality standards. Real-time visibility supports agile decision-making and continuous improvement.
Using Analytics to Reduce Defects and Improve Manufacturing KPIs
Analytics-driven dashboards help reduce defects by identifying root causes and enabling preventive actions. By analyzing historical and real-time data, manufacturers can improve quality KPIs and operational performance.
This proactive approach supports lean manufacturing principles and enhances overall efficiency. Analytics enable manufacturers to achieve higher quality levels with fewer resources.
Dashboards in Manufacturing for Operational Optimization
Dashboards in Manufacturing for Inventory Turnover and Flow
Dashboards track inventory turnover and material flow to support efficient production. By monitoring inventory metrics, manufacturers can reduce excess stock and avoid shortages.
This visibility supports smoother operations and aligns inventory levels with production demand, improving overall efficiency.
Optimizing Production Quality Using Real-Time Production Dashboards
Real-time production dashboards enable manufacturers to optimize quality by monitoring key metrics continuously. These dashboards help teams detect issues early and maintain consistent standards.
By integrating quality and production data, dashboards support informed decisions that enhance efficiency and reduce waste.
Using Manufacturing Dashboards to Improve Quality, Efficiency, and Insight
Manufacturing dashboards provide comprehensive insight into production and quality performance. By consolidating metrics and analytics, dashboards help manufacturers improve operational performance and achieve business goals.
Dashboards support business success by enabling data-driven decisions, aligning teams, and driving continuous improvement across manufacturing operations.
Conclusion
A Manufacturing Quality Performance Dashboard is an essential tool for visualizing production, monitoring quality KPIs, and optimizing operations. By combining real-time insights, analytics, and focused metrics, dashboards help manufacturers achieve consistent quality, operational excellence, and long-term success.
For ready-to-use Dashboard Templates: