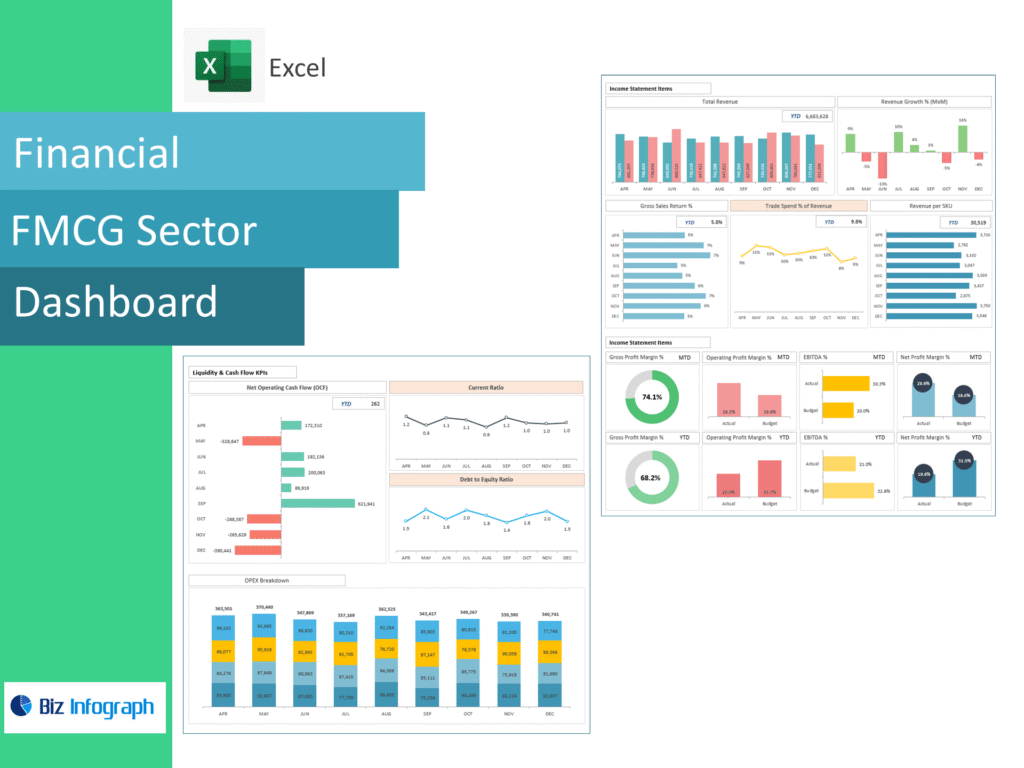
Overview of the FMCG Sector Financial Dashboard
What an FMCG Dashboard Is and Why Every FMCG Business Needs It
An FMCG dashboard is a centralized financial and operational dashboard designed specifically for the fast-moving consumer goods sector. It consolidates key financial, sales, inventory, and supply chain data into one accessible interface, providing a complete overview of performance. In the highly competitive FMCG industry, where margins are tight and volumes are high, visibility and speed are critical. This dashboard acts as the backbone of any FMCG business by enabling leaders to track turnover, profit margins, stock levels, and sales movement in real time.
Every FMCG business needs such a dashboard to remain agile amid market shifts, changing consumer preferences, and increasing competition. Without a unified dashboard, organizations face inefficiencies, manual errors, and delayed decision-making. An FMCG dashboard helps unify integrated data from ERP, CRM, and retail partners, ensuring accessibility and accuracy. By delivering actionable insights and improving visibility across the FMCG sector, the dashboard supports strategic growth and long-term competitiveness.
Role of BI and Analytics in an FMCG Financial Dashboard
Business intelligence (BI) and data analytics are core components of a modern FMCG financial dashboard. BI tools collect and process large volumes of integrated data from ERP systems, CRM platforms, e-commerce channels, and supply chain systems. This analytical foundation transforms raw data into structured insights that FMCG leaders can use for informed decision-making.
An analytics dashboard enables real-time data analysis, allowing businesses to monitor key indicators such as volume growth, market share, ROI, and profitability by product category. Analytics help identify bottlenecks, inefficiencies, and opportunities across the value chain. By using analytical tools, FMCG organizations can move beyond descriptive reporting to predictive and prescriptive insights. This capability is essential for making data-driven decisions that improve competitiveness and align operations with business goals.
How an FMCG Dashboard Provides Financial Insight Across the FMCG Sector
An FMCG Sector Financial dashboard provides financial insight by offering a unified overview of performance across brands, products, and channels. It integrates key financial metrics such as turnover, profit margins, and pricing strategies with operational data like stock levels and replenishment cycles. This holistic view helps organizations understand how financial outcomes are influenced by supply chain efficiency, promotion effectiveness, and consumer behavior.
By delivering real-time visibility, the dashboard helps FMCG leaders respond quickly to market shifts and operational challenges. It highlights trends in sales movement, identifies underperforming products, and supports strategic decisions at both tactical and executive levels. Across the FMCG sector, dashboards enable consistency, transparency, and alignment, making them essential tools for sustainable growth.
KPIs, Indicators, and Financial Performance
Key FMCG KPIs and Financial Indicators Tracked in the Dashboard
Tracking FMCG KPIs is fundamental to understanding performance in the fast-moving consumer goods sector. Key financial indicators include revenue growth, profit margins, ROI, and market share. Operational KPIs such as units sold, stock turnover, and average time to replenish inventory are equally critical. These KPIs provide a balanced view of financial health and operational efficiency.
An FMCG dashboard centralizes these KPIs, allowing leaders to monitor performance consistently across product portfolios and markets. By focusing on key metrics like volume growth and pricing effectiveness, organizations can quickly identify deviations from targets. The dashboard helps ensure that performance indicators remain aligned with strategic objectives and business goals.
Profitability Analysis for FMCG Brands Using Dashboard KPIs
Profitability analysis is a core use case for an FMCG financial dashboard. By tracking profit margins at brand, category, and product levels, FMCG brands can evaluate the financial impact of pricing strategies, promotions, and product mix decisions. Dashboards help identify which products drive profitability and which contribute to inefficiencies.
Using real-time data, dashboards enable FMCG leaders to analyze ROI from promotions and campaigns. This insight supports smarter allocation of marketing spend and improves campaign performance. Profitability dashboards also highlight the impact of costs related to expiry, shelf life, and stockouts, helping brands optimize margins in a highly competitive environment.
Using KPIs to Monitor Overall Financial Performance
KPIs serve as a compass for monitoring overall financial performance in FMCG organizations. Dashboards visualize KPIs in a clear, actionable format, enabling quick assessments of performance against targets. By monitoring indicators like turnover, market share, and profit margins, organizations maintain control over financial outcomes.
Dashboards also support comparative analysis across regions, channels, and time periods. This capability helps FMCG leaders detect trends early and adjust strategies accordingly. Using KPIs within a dashboard framework ensures consistent measurement and continuous improvement across the FMCG sector.
Inventory, Supply Chain, and Stock Management
Inventory and Stockouts Monitoring Through an FMCG Dashboard
Inventory management is critical in the FMCG industry due to high volumes, short shelf life, and frequent replenishment cycles. An FMCG dashboard monitors stock levels, expiry risks, and out-of-stock situations in real time. This visibility helps organizations minimize lost sales and reduce waste.
By tracking stockouts and inventory turnover, dashboards help streamline replenishment processes and improve availability across retail partners. Inventory dashboards also highlight inefficiencies caused by manual errors or delayed data collection. With accurate, real-time inventory insights, FMCG businesses can optimize working capital and enhance service levels.
Supply Chain Visibility and Performance Analytics
Supply chain visibility is essential for managing the complexity of FMCG operations. Dashboards integrate supply chain data to provide insights into replenishment cycles, logistics performance, and bottlenecks. This visibility supports proactive management of disruptions and inefficiencies.
Analytics within the dashboard enable performance evaluation across the supply chain, from suppliers to retail outlets. By identifying bottlenecks and average processing times, FMCG organizations can streamline operations and improve responsiveness. Enhanced supply chain visibility strengthens resilience and supports strategic decision-making.
Retailer-Level Insights for Inventory and Distribution Efficiency
Retailer-level insights are crucial for optimizing distribution and inventory placement. FMCG dashboards integrate data from retail partners to analyze stock availability, sales movement, and shelf performance. This information helps brands align replenishment strategies with actual demand.
By understanding retailer performance, FMCG leaders can improve collaboration and reduce out-of-stock scenarios. Dashboards also support channel-specific analysis, including e-commerce and traditional retail. These insights enable more effective distribution planning and strengthen relationships with retail partners.
Analytics Dashboards and Consumer Insights
Analytics Dashboard for Understanding Consumer Behavior
Understanding consumer behavior is vital for success in the FMCG sector. Analytics dashboards combine sales data, CRM insights, and market data to analyze purchasing patterns and consumer preferences. This understanding helps FMCG brands tailor product offerings and promotions effectively.
Dashboards reveal trends in consumer behavior across categories such as home care and personal care. By analyzing data analytically, FMCG organizations can anticipate demand shifts and adjust strategies accordingly. These insights drive better product mix decisions and enhance competitiveness.
Campaign Performance Tracking Using FMCG Analytics
Campaign performance tracking is a key function of FMCG analytics dashboards. By monitoring promotion effectiveness, ROI, and sales uplift, dashboards help FMCG leaders evaluate marketing impact. This analysis supports data-driven decisions regarding future campaigns.
Dashboards integrate campaign data with sales and inventory metrics, providing a comprehensive view of outcomes. This integration helps identify which promotions drive volume growth and which create inefficiencies. Improved campaign performance tracking leads to smarter marketing investments and stronger financial results.
Turning FMCG Data into Actionable Financial Insight
The ultimate value of an FMCG dashboard lies in its ability to turn data into actionable insight. By unifying integrated data from ERP, CRM, and other systems, dashboards provide a single source of truth. This reduces reliance on manual reporting and minimizes errors.
Actionable insights enable FMCG leaders to make timely strategic decisions, optimize operations, and improve profitability. Dashboards transform data into a strategic asset that supports growth and resilience across the FMCG sector.
Dashboard Templates and Practical Use Cases
Using a Dashboard Template for FMCG Financial Reporting
A dashboard template accelerates implementation by providing predefined layouts and metrics tailored to FMCG needs. Templates reduce setup time and ensure consistency in reporting across the organization.
By using templates, FMCG businesses can quickly deploy dashboards that deliver value. Templates also support scalability, allowing dashboards to evolve with business needs.
FMCG Dashboard Use Cases for Retailers and FMCG Brands
FMCG dashboards support various use cases, including financial reporting, inventory optimization, and campaign analysis. Retailers and FMCG brands use dashboards to improve collaboration and align strategies.
Use cases demonstrate how dashboards support daily operations and strategic planning. These examples highlight the versatility and impact of FMCG dashboards.
How FMCG Dashboards Support Strategic Decision-Making
FMCG dashboards support strategic decision-making by providing timely, accurate insights into performance and trends. They help leaders respond to market shifts and align actions with business goals.
By enabling data-driven decisions, dashboards empower FMCG leaders to drive strategic growth and maintain competitiveness.
Conclusion
An FMCG Sector Financial Dashboard is an essential tool for navigating the complexity of the fast-moving consumer goods industry. By integrating financial, inventory, and consumer insights into a unified dashboard, FMCG organizations gain visibility, agility, and strategic advantage.
For ready-to-use Dashboard Templates: