Understanding the E-commerce Finance Dashboard
What an E-commerce Dashboard Does for Financial Performance Tracking
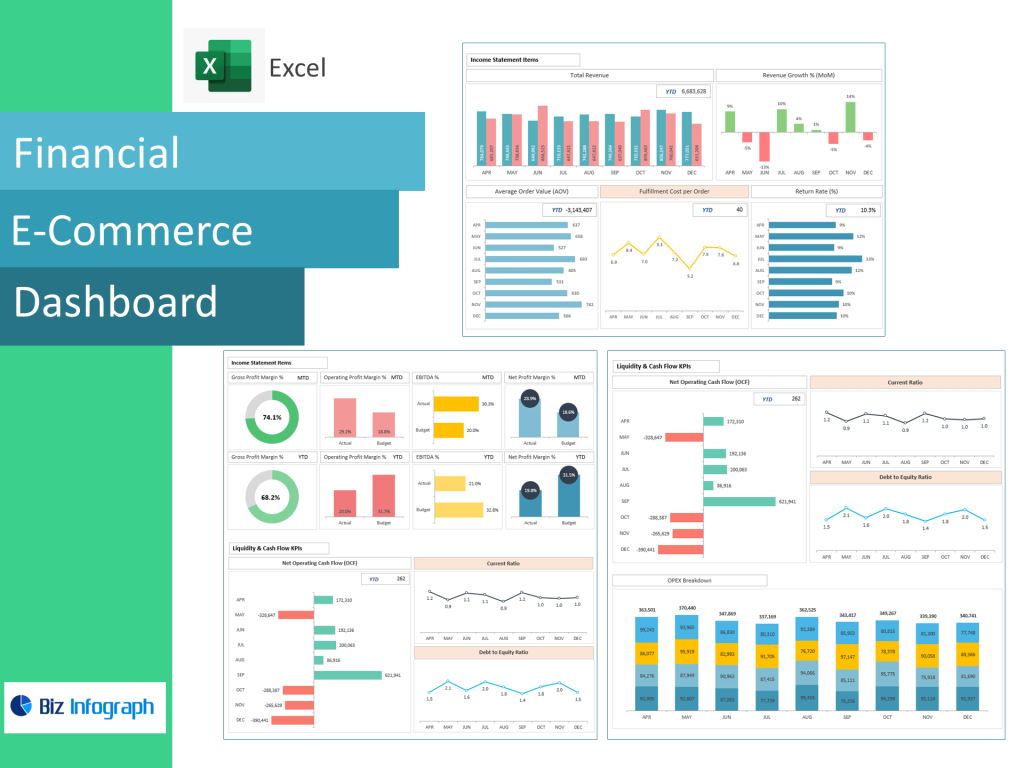
An E-commerce Finance Dashboard is a centralized business intelligence interface that allows businesses to monitor performance indicators, analyze revenue flow, and evaluate profitability in real time. For modern e-commerce business models, financial reporting must move faster than monthly spreadsheets — which is why a financial dashboard provides daily and even hourly visibility. With one dashboard, business owners can track sales, expenses, returns, refunds, payment processor fees, and marketing spend in a single unified view. The dashboard centralizes financial data pulled from Shopify, WooCommerce, CRMs, ads managers, and ERP systems, transforming raw ecommerce data into easy-to-understand visual reports. This consolidated structure helps ecommerce teams identify trends, seasonal revenue shifts, rising fulfillment expenses, cart abandonment effects, and margin leakage.
A finance dashboard is built for e-commerce decision-making, supporting everything from pricing adjustments to vendor negotiation. Because the dashboard tracks both top-line and bottom-line performance, ecommerce managers gain visibility into net profitability, not just revenue volume. This visibility is essential for business owners, as it becomes possible to see which products generate cash flow, which campaigns drive profitable sales, and which operations increase cost burden. With continuous monitoring, businesses react immediately to volatility instead of discovering issues weeks later. When used properly, an ecommerce financial dashboard ensures data-driven decisions and removes guesswork from scaling strategy — a critical advantage in fast-moving online markets.
Key Metrics and Financial Metrics Every E-commerce Business Should Monitor
An effective ecommerce finance dashboard highlights financial metrics that reflect both operational and commercial health. Beyond sales revenue totals, the dashboard should include average order value, customer lifetime value, gross margin, net margin by product category, discount impact, and fulfillment cost. These indicators determine overall financial health better than revenue output alone. The dashboard also enables companies to go beyond top-line sales by examining contribution margins, ad ROAS, CAC to LTV ratio, and inventory value aging. Tracking these metrics consistently helps ecommerce companies reduce waste, improve profitability, and refine pricing strategy.
The dashboard monitors profitability drivers across marketing, warehousing, and logistics. With financial metrics and cost breakdowns clearly visible, businesses can optimize stock levels, negotiate vendor rates, or reallocate ad spend quickly. This is critical because even high-revenue ecommerce brands can struggle with profitability if fulfillment cost, returns, or discounts outpace earned margin. Dashboards help ecommerce teams visualize leakage, isolate profit-destroying activities, and restructure operations without manual reporting burdens. As companies scale, KPIs evolve — but the dashboard scales with your business, accommodating new channels, warehouses, currencies, or geography expansions. In short, financial metrics help ecommerce leaders make smarter decisions, increase earnings, and maintain strong operational balance.
E-commerce Dashboard Examples and How They Support Growth
Many ecommerce dashboard examples highlight how properly structured data accelerates business growth. A performance dashboard may display revenue against ad spend, shipping cost trends, refund percentage, payment settlement time, and sales by day for comparison. Another dashboard example may visualize customer lifetime value across segments, helping online retailers identify high-value buyers to target with retention campaigns. Some dashboards include a customer insights dashboard block showing geographic performance, device-based conversion rate, website traffic behavior, and average browsing depth before purchase. These insights allow ecommerce companies to refine product placement, website UX, and upsell strategy to increase conversion.
E-commerce Financial dashboards often work alongside specialized panels such as a sales dashboard, inventory dashboard, or supply chain dashboard, giving businesses full-stack visibility from marketing funnel to delivery. For example:
• a marketing dashboard reveals ad attribution and ROAS,
• an inventory dashboard shows current stock vs forecasted demand,
• a financial dashboard links these to real margin impact.
These dashboard examples prove that metrics visualization is essential for business growth because businesses no longer rely on delayed reports or inconsistent spreadsheet exports. Instead, financial data becomes live, dynamic, and strategically actionable — a core requirement for scaling e-commerce successfully.
KPIs, Metrics & Analytics for Strong Financial Visibility in Ecommerce Dashboard
Essential KPIs to Track Using an E-commerce KPI Dashboard
A strong kpi dashboard highlights measurable performance indicators that reveal revenue efficiency, spending control, and customer value. essential KPIs include cost per acquisition, conversion rate, average order size, repeat purchase percentage, profit per product, and churn rate. A KPI dashboard also tracks gross profit by channel, shipping cost per unit, abandoned cart recovery rate, and fulfillment cost impact. These indicators are crucial for ecommerce analytics because they reflect profitability drivers rather than vanity metrics like impressions or product clicks. KPIs should also include inventory turnover velocity, cash flow availability, and subscription renewal rate for recurring-model e-commerce.
The dashboard includes filters to compare performance across different campaigns, product lines, or seasonal cycles, helping ecommerce teams identify which SKUs generate sustainable earnings. As dashboards track KPIs in real time, managers can tighten budget leaks or invest further into high-margin channels. Ecommerce KPIs dashboard turn complexity into clarity — converting numbers into business logic. For fast-scaling brands, KPI visibility becomes the difference between profitable growth and expensive stagnation.
Using E-commerce Analytics to Convert Data into Actionable Insights
Ecommerce analytics show how customers behave, how products move, and how profit emerges through execution — but analytics are only useful when they translate into action. Data into actionable insights means understanding why margin dropped, not just seeing the number. A dashboard converts sales data, ad data, and logistics expenses into directional recommendations. For example, if a dashboard shows strong traffic and low conversion, the issue may be pricing or checkout UX. If ROAS rises but net margin declines, discounting or shipping costs may be absorbing revenue. The dashboard offers clarity that spreadsheets struggle to deliver.
Dashboards also support predictive planning. With historical ecommerce data available, the analytics engine can forecast inventory requirements, revenue projections, or seasonal spikes. This predictive intelligence helps ecommerce teams avoid stockouts, maintain strong fulfillment speed, and reduce emergency resupply orders. A dashboard changes analytics into a feedback loop — refine, measure, adjust, repeat. It helps ecommerce brands evolve from reactive decision-making to strategic control.
Metrics a Performance Dashboard Must Include for Business Owners
A high-value performance dashboard must include conversion patterns, revenue per visitor, order processing cost, time-to-ship, returns percentage, and payment processing failure rate. Business owners especially need clarity on per-unit profitability, marketing CPA variance, inventory value tied to slow-moving products, and lifetime profitability of customer cohorts. A performance dashboard helps ecommerce managers eliminate blind spots that often delay growth decisions. With one dashboard and unified visualization, business owners compare performance across geography, channel, or funnel stage.
Dashboards also centralize profit storm signals such as rising operational expenses, lower warehouse efficiency, or unexpected refund growth. By using performance dashboards consistently, businesses optimize spending, increase profit margin, and scale intelligently instead of scaling expensively. A performance dashboard is not just a report — it is a growth engine.
Dashboard Types, Tools & Template Options
Types of E-commerce Dashboards for Financial and Operational Needs
There are types of ecommerce dashboards built for different functions — financial dashboards, marketing dashboards, sales dashboards, inventory dashboards, customer experience dashboards, and operations/supply chain dashboards. A financial dashboard focuses on margin outcomes and cash flow performance. A sales dashboard visualizes order volume, top products, channel segmentation, and dynamic pricing results. A marketing dashboard highlights ROAS, CPC trends, audience cohorts, and click-to-purchase behavior. An inventory dashboard monitors stock lifecycle, committed inventory, upcoming purchase orders, and reorder triggers. A supply chain dashboard offers visibility into fulfillment timing, routes, warehouse bins, and vendor performance.
Each dashboard type solves a different business question, but most powerful when combined. When dashboards are integrated into one dashboard ecosystem, ecommerce operations become a measurable system rather than isolated departments. These dashboards help ecommerce scale efficiently rather than reactively, making insights easier for cross-team decision-making.
Choosing an E-commerce Dashboard Template or Custom Dashboard Build
Businesses often choose between a custom dashboard build and a pre-built ecommerce dashboard template. Dashboard templates accelerate onboarding — especially for small and mid-sized ecommerce teams — because most visuals and KPI modules are already structured. Templates are ideal for ecommerce startups and online retailers without dedicated analytics staff, allowing quick launch using existing connectors from Shopify, Google Analytics, Meta Ads, and ERP systems.
A custom dashboard offers deeper tailoring for enterprise ecommerce companies with complex SKU catalogs, international fulfillment, multi-currency operations, or subscription models. While dashboard templates launch quickly, custom dashboards scale with your business more flexibly as complexity expands. Both approaches translate ecommerce performance into measurable insight, but selection depends on financial maturity, analytics capacity, and departmental integration level.
Shopify Dashboard, Google Analytics and Other Platform Integrations
A Shopify dashboard is often core to ecommerce financial analytics due to its built-in financial reporting, product-level profitability metrics, and cart abandonment tracking. When integrated with Google Analytics, revenue and behavior data combine to show not just what customers bought — but how they decided. Together, these dashboards go beyond reporting by creating a user journey picture from traffic source → cart → purchase → reorder. For many ecommerce companies, this integration is the foundation of business intelligence.
Additional integrations include inventory management systems, CRM platforms, ad dashboards, shipping software, and ERP accounting records — all consolidated into one dashboard. Integrations ensure ecommerce analytics remain accurate, synchronized, and scalable as products expand or markets grow.
Performance Monitoring & Business Scaling
How a Performance Dashboard Helps Improve Financial Performance
A performance dashboard improves financial performance by exposing inefficiencies otherwise hidden in daily operations. With revenue scoring, profit heat maps, SKU margin breakdowns, and forecasted contribution, ecommerce brands see where money is made or lost. The dashboard reinforces accountability for spending groups, driving higher ROI from paid campaigns and reducing inventory waste.
Because a dashboard monitors margin and fulfillment impact at SKU level, brands stop investing in products that appear successful by revenue but fail by profit. This alignment alone can increase profitability significantly. Performance dashboards reduce risk, strengthen pricing strategy, and enable smarter growth decisions across the board.
Using Inventory Dashboard, Marketing Dashboard & Cart Abandonment Metrics
Combining inventory dashboard reporting, ecommerce marketing analytics, and cart abandonment tracking transforms operational data into revenue outcomes. If cart abandonment rises, checkout friction, shipping cost, or page load speed may be responsible. A dashboard detects this drop before revenue loss escalates. Meanwhile, inventory dashboards show when best-sellers drop to critical stock levels, preventing missed revenue. Marketing dashboards ensure ads convert profitably rather than simply generating traffic.
Cross-dashboard intelligence strengthens conversion strategy, improves fulfillment efficiency, and reduces margin waste. Businesses no longer guess — they act immediately based on what the dashboard reveals.
Dashboards That Scale With Your Business and Evolve With Data
As ecommerce grows, the biggest failure is relying on outdated, spreadsheet-based reporting — which breaks once order volume accelerates. That is why dashboards must scale with your business. A scalable dashboard expands seamlessly into new channels, countries, ad networks, marketplaces, and warehouse locations. It evolves with the business instead of forcing manual workarounds.
Dashboards ensure consistent visibility at scale, reduce data fragmentation, and improve decision-making even for enterprise-level ecommerce operations. A dashboard is not just analytics — it becomes the operating system for ecommerce optimization.
For ready-to-use Dashboard Templates: