Understanding the Inventory, Logistics and Operational Efficiency Dashboard
How a Supply Chain Dashboard Improves Inventory and Logistics Visibility
An Inventory, Logistics and Operational Efficiency Dashboard is a visual interface that provides real-time visibility into key supply chain metrics, allowing businesses to track inventory, transport status, warehouse movement, costs, and operational performance in one unified view. The dashboard is a visual tool that gives supply chain managers a clear picture of inventory and logistics flow, enabling proactive interventions instead of reactive firefighting. With real-time inventory reporting and live stock updates, supply chain analysts can identify shortages, prevent overstock scenarios, and maintain a healthy inventory turnover ratio. When implemented correctly, the supply chain dashboard helps organizations optimize inventory planning, reduce operational expenses, and improve decision-making through transparency and analytics.
This type of dashboard offers real-time insights into inventory value, inbound/outbound order volumes, and logistics process delays across the supply chain. It enables leaders to view the entire supply chain from procurement to last-mile delivery, strengthening response time when demand spikes or material flow slows. The dashboard provides actionable insights to supply chain professionals, helping businesses plan stock levels, predict disruptions, and scale warehouse functions effectively. With complete visibility into actual inventory counts, replenishment needs, and delayed shipments, the dashboard makes strategic demand planning more accurate and sustainable. As a result, businesses experience greater efficiency and customer satisfaction because order fulfillment becomes more predictable and consistent.
Role of a Logistics Dashboard in Warehouse and Transport Operations
A logistics dashboard plays a vital role in controlling warehouse flow, shipment routing, and transportation performance. Logistics managers rely on dashboards to monitor freight utilization, packaging speed, outbound distribution timing, and carrier lead time variance. The dashboard also displays where inefficiencies occur, whether in loading zones, picking areas, or staging lines. It provides insights into logistics operations that help managers allocate labor resources and adjust transportation schedules for optimal flow. Logistics dashboards track key metrics such as average warehouse handling time, transportation delays, freight costs, and order cycle duration. When these metrics surface in real time, organizations can correct issues before they impact customers.
The dashboard offers real-time alerts when logistics bottlenecks appear, such as delayed carrier pickup or slow pallet sorting. This equips managers with the knowledge to reassign workforce capacity and re-route shipments to maintain on-time delivery promises. With actionable supply chain analytics, logistics operations across the supply chain become faster, more resilient, and more efficient. By analyzing current inventory movements alongside historical trend data, logistics teams can predict congestion points during seasonal demand spikes. This drives data-driven decision-making and supports continuous improvement across transport and warehouse coordination. Ultimately, a logistics dashboard improves efficiency by merging visibility, analytics, and performance tracking into one operational hub.
Inventory and Logistics Dashboard Examples for Real Operational Control
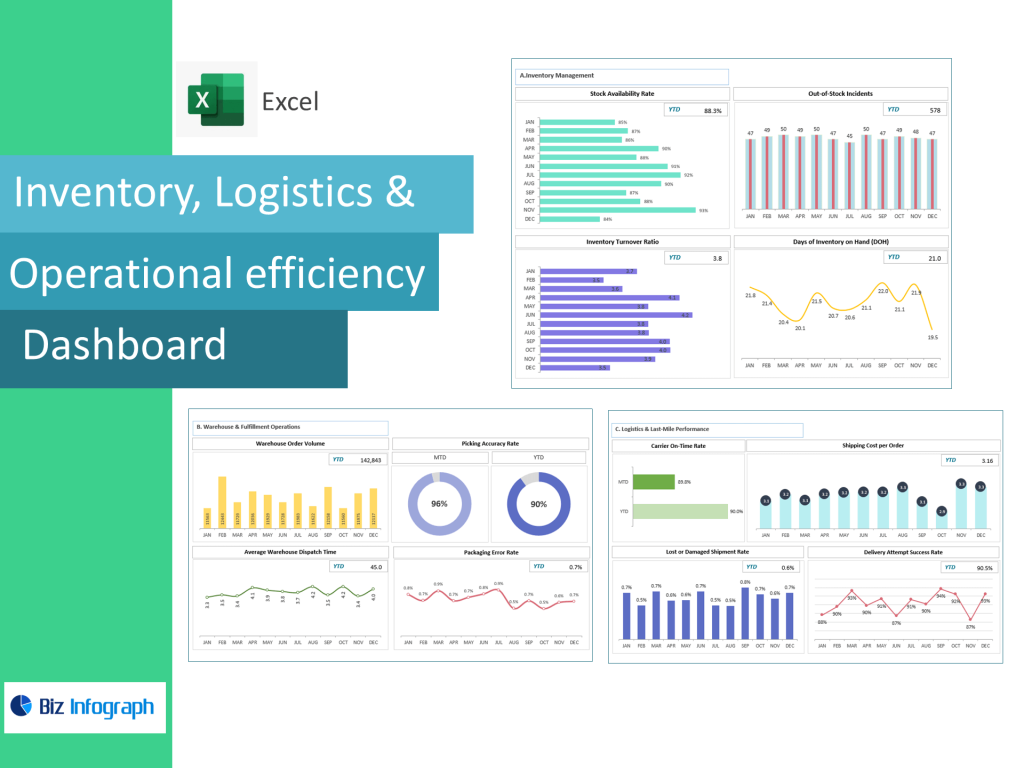
Effective dashboard examples typically show warehouse stock levels, reorder thresholds, slow-moving SKUs, logistics lead time variance, and inventory accuracy trending. Visualizations might include color-coded indicators that highlight excess stock, stockout risk, and delayed delivery flow. These dashboards provide supply chain analysts with real-time inventory valuation, bin-level stock counts, and fulfillment rate calculations. A performance dashboard for logistics may highlight cross-dock speeds, load consolidation accuracy, and optimal carrier assignment patterns. These examples reflect how dashboards play a vital role in end-to-end supply chain decision-making.
For operational efficiency, inventory and logistics dashboards often include ABC classification tables, forecasting signals, and volume consumption projections. They also support scenario planning, allowing supply chain professionals to simulate what-if conditions like supplier delays or increased demand. Instead of spreadsheets that update weekly or monthly, dashboard offers real-time planning capabilities, powering faster decisions and reducing costly fulfillment inefficiencies. With a single platform showing order queues, warehouse flow, and transport capacity, businesses gain precise operational control without fragmented data sources. These dashboard examples prove how analytics tools can transform logistics processes into measurable performance systems where outcomes continuously improve.
Key Performance Indicators and Metrics to Monitor
Performance Indicators to Track Warehouse and Inventory Flow
To maintain operational efficiency, the dashboard must track key performance indicators linked to warehouse capacity, cycle time, inventory health, and outbound movement. Inventory turnover ratio, pick rate per hour, and stock rotation frequency are essential KPIs that shape inventory planning decisions. Supply chain managers rely on performance indicators to assess how quickly items move, how accurately orders are picked and packed, and whether storage utilization is balanced. High turnover indicates strong demand alignment, while low turnover signals excess carrying cost and inefficient space use.
A robust dashboard provides a real-time view of the entire supply chain, allowing leaders to trace inefficiencies from inbound pallets to shipment release. Inventory control indicators such as stock aging percentage, deviation between actual inventory and system count, and replenishment latency are critical metrics. The dashboard provides visibility into key material clusters—fast movers, balanced movers, or dormant inventory—helping businesses streamline warehouse layout and stocking rules. As tracking these metrics becomes consistent, warehouse workflows operate more predictably, reducing handling time and maximizing throughput.
KPIs for Logistics Movement Across the Supply Chain
Logistics KPIs measure the performance of freight movement, vehicle scheduling, carrier reliability, and transport cost efficiency. Metrics like average lead time, shipment accuracy, fill rate, and logistics cost per unit help organizations evaluate how well goods flow across the supply chain. A dashboard provides quick access to actual inventory availability vs. goods in transit to improve order planning. With real-time visibility into key transport indicators, businesses detect route deviations, late departures, and warehouse bottlenecks early.
Supply chain leaders use these metrics to make informed decisions regarding carrier partnerships, last-mile routing, or transportation automation. Predictive analytics can forecast distribution load spikes, allowing logistics teams to scale capacity before the network becomes congested. When KPIs report consistently, organizations develop reliable fulfillment schedules, leading to fewer customer escalations and better overall efficiency. The dashboard also highlights logistics process fractures—ranging from slow picking to delayed inventory release—helping supply chain professionals respond swiftly with corrective action.
Using Performance Indicators to Make Data-Driven Decisions
Performance indicators turn raw operational activity into structured intelligence by revealing patterns that impact cost, delivery time, and warehouse load. Dashboards allow supply chain managers and analysts to make data-driven decisions supported by quantifiable evidence rather than assumptions. Instead of guessing why orders lag, the dashboard highlights which step causes delay. Indicators like inventory accuracy percentage, order defect rate, and safety stock variance help managers optimize inventory control.
Decision-making improves when dashboards offer real-time alerts and predictive signals that warn of upcoming shortages or fulfillment congestion. Operational efficiency grows when decisions respond to dashboard analytics rather than historical reports. The dashboard helps supply chain professionals prioritize tasks based on urgent bottlenecks and forecast inventory needs more accurately. As a result, inventory and logistics teams can fine-tune stock levels, reduce operational expenses, and enhance efficiency across the supply chain. When leaders track key KPIs consistently, they align actions with performance outcome rather than reacting to order failures after customer impact occurs.
Dashboards, Analytics and Decision Enablement
How an Analytics Dashboard Strengthens Operational Efficiency
An analytics dashboard builds operational efficiency using machine-driven insights from inventory movement, warehouse utilization, labor allocation, and logistics routing. When real-time inventory and logistics performance are visible, teams can prevent overload, minimize idle time, and increase throughput. Supply chain analytics help organizations identify trends in ordering behavior, storage usage, and supplier delivery lead time. Over time, analytics expose where cost drains exist and where automation would deliver maximum improvement.
With predictive analytics, supply chain professionals can forecast upcoming restock windows, avoid emergency replenishment, and maintain optimal inventory valuation. The dashboard makes insights simple to interpret by presenting actionable insights instead of raw numbers. For example, it may show that inbound volume is rising faster than outbound processing capacity—indicating a need to reassign picking teams or modify shift timing. By enhancing efficiency and customer satisfaction simultaneously, analytics dashboards transform daily operations into measurable, scalable gains.
Supply Chain Dashboard Templates for Faster Deployment
A pre-built dashboard template accelerates dashboard implementation and reduces configuration time. Templates give organizations a foundation containing key supply chain widgets, visuals, and placeholders for performance indicators. Businesses can integrate real-time inventory tracking, logistics flow dashboards, and valuation summaries without building from scratch. Templates also standardize reporting formats, helping teams compare operations across regions, facilities, or distribution hubs.
Templates benefit organizations moving toward digital supply chain management by making setup affordable and predictable. An effective template includes metrics like inventory value, current inventory vs. required replenishment, transportation cycle delay, and warehouse productivity. The dashboard offers structured sections for demand forecasting, stockout risk detection, and supplier reliability scoring. Templates support scaling as business complexity expands, making dashboard rollout smoother across multiple business units.
Logistics Dashboard Design for Effective Monitoring and Reporting
Dashboard design determines how usable and effective reporting becomes. A logistics dashboard should include recognizable color coding, segmented warehouse visuals, and real-time logistics lane indicators. It should also display lead time trends, order prioritization zones, and loading dock timelines. Good design improves dashboard navigation and reduces interpretation confusion, even for new users.
A well-structured dashboard gives supply chain professionals a real-time view of the entire supply network. By grouping reports logically—inventory and warehouse on one pane, logistics and delivery on another—decision-making becomes fluid and intuitive. The dashboard also highlights which logistics tasks are complete, pending, late, or at risk. This level of function enhances visibility and drives high-performance workflow control across fulfillment points.
For ready-to-use Dashboard Templates: