Introduction to Production Efficiency Dashboards
What Is a Production Dashboard and Why It Matters
A production dashboard is a real-time data visualization tool that enables manufacturers to monitor production processes, evaluate performance metrics, and make data-driven decisions. It serves as a critical asset within the manufacturing industry, offering transparency into everything from production volume to equipment performance. A well-designed dashboard provides insights into operational bottlenecks, downtime, and defect rates, allowing teams to respond immediately. By using a manufacturing dashboard, businesses can track key metrics, reduce waste, and boost production efficiency. This dashboard is a performance cornerstone for modern, digital manufacturing environments where visibility and speed are essential.
The Role of KPIs and Metrics in Monitoring Manufacturing Efficiency
Key performance indicators (KPIs) and manufacturing metrics are the lifeblood of any effective manufacturing production efficiency dashboard. These metrics reflect the health of your production process, measuring factors such as production output, machine uptime, production quality, and cycle time. When combined into a kpi dashboard, they provide a holistic view of overall performance and help detect production issues before they escalate. Real-time dashboards let you track performance and identify trends based on both real-time data and historical data. Monitoring the right manufacturing KPIs supports continuous improvement and helps businesses optimize production across all production lines.
Benefits of Using a Real-Time Manufacturing Dashboard
A real-time manufacturing dashboard provides real-time insights into the heart of your manufacturing operation. With data streaming directly from machines and sensors, teams can respond quickly to breakdowns, delays, or inefficiencies. Real-time dashboards help reduce costs by eliminating guesswork, minimizing downtime, and increasing throughput. They also improve productivity by aligning teams around shared, real-time targets. Whether displayed on a control room screen or accessed through mobile apps, a dashboard offers a snapshot of production data at any given moment. These tools are essential for driving efficiency and productivity across the plant floor.
Key Metrics and KPIs for Manufacturing Dashboards
Most Common Manufacturing KPIs to Track
Common manufacturing KPIs include Overall Equipment Effectiveness (OEE), scrap rate, cycle time, yield, and capacity utilization. These key metrics are essential for evaluating production efficiency, minimizing losses, and tracking production activities. A manufacturing kpi dashboard aggregates this data into easy-to-read visuals that help managers track production efficiency. For instance, a drop in OEE or spike in defects could indicate deeper issues in your manufacturing process. Using a kpi dashboard, manufacturers can take corrective actions quickly, ensuring production output and product quality meet expectations. These KPIs help businesses align performance with strategic goals.
How to Define Specific Key Performance Indicators for Your Operation
Defining specific key performance indicators starts by identifying the primary objectives of your manufacturing operation. Are you trying to reduce downtime, improve product quality, or increase throughput? Once goals are clear, align your production metrics accordingly. Use tools like dashboard software to model how changes in one metric affect another. For example, tracking production scheduling alongside cycle time and output helps uncover capacity imbalances. Your manufacturing dashboard should emphasize the most actionable KPIs, allowing teams to focus on what matters most. By customizing metrics, you’ll build a dashboard that drives value and supports agile responses.
Aligning Performance Metrics with Production Scheduling Goals
Production scheduling is a key driver of manufacturing efficiency, and aligning it with relevant metrics ensures optimal outcomes. Dashboards can monitor actual production against planned targets, track schedule adherence, and visualize lead times. These insights are vital for managing shifts, forecasting demand, and balancing workloads. For example, if your dashboard displays delays in production output, it may signal underutilized resources or planning gaps. Integrating real-time and historical data provides context for smarter decisions. An essential manufacturing dashboard will combine production data with scheduling KPIs to streamline planning and support proactive management.
Exploring Manufacturing Dashboard Examples
Common Types of Manufacturing Dashboards and Their Use Cases
There are several common types of manufacturing dashboards, each designed to monitor a different aspect of the manufacturing operation. These include quality dashboards for tracking defects and product quality, maintenance dashboards for monitoring equipment status, and production dashboards for managing output, cycle time, and downtime. A manufacturing operations dashboard typically integrates multiple views into one single dashboard, giving production managers a 360-degree view of operations. These dashboard examples are used across industries to monitor manufacturing KPIs, ensure compliance, and boost responsiveness. The dashboard presents a centralized location for monitoring and optimizing key workflows.
Real-Time Manufacturing Dashboards in Action
In practice, a real-time manufacturing dashboard pulls data directly from PLCs, MES systems, or IoT sensors to offer instant visibility into the production environment. These dashboards show real-time data on throughput, cycle times, machine status, and quality indicators. They also feature alerts to flag issues like low production or deviations from the expected manufacturing performance. Real-time tools help identify production bottlenecks, allowing teams to adjust in real time. For example, if a particular line is underperforming, operators can redistribute labor or reroute orders immediately. These advanced manufacturing solutions are essential for continuous improvement.
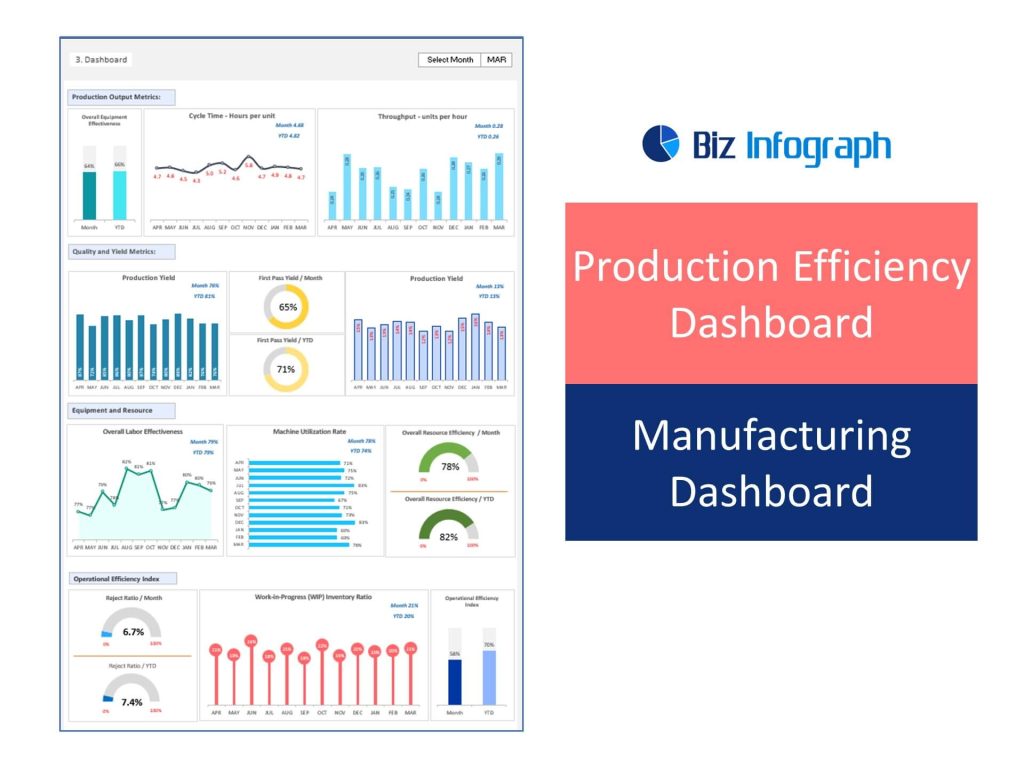
KPI Dashboard Example for Production Efficiency
A powerful kpi dashboard for production efficiency might track metrics like OEE, on-time delivery, changeover time, and scrap rate. This dashboard tracks both short-term deviations and long-term patterns, helping organizations balance output and quality. A typical dashboard example includes dynamic gauges, trend lines, and heatmaps that highlight performance gaps. Managers can drill down into manufacturing metrics by department, product line, or shift. Such a dashboard offers the clarity needed to improve planning, guide team discussions, and enhance your manufacturing strategy. The visual format helps to optimize manufacturing while reducing manual reporting time.
Building an Effective Manufacturing KPI Dashboard
Steps to Create Your Dashboard for Manufacturing Insights
To create your dashboard, start by outlining the KPIs that align with your business and operational goals. Next, integrate manufacturing data from your ERP, MES, or SCADA systems. Choose manufacturing dashboard software that supports both real-time updates and historical data analysis. Design the layout so it’s intuitive for various users—from operators to executives. Ensure the dashboard provides clear visuals, color-coded statuses, and the ability to drill down into data on production and equipment performance. Finally, pilot your dashboard with key users to gather feedback. The result is a tool that delivers real-time insights and supports strategic decision-making.
Choosing the Right Manufacturing Metrics and Data Sources
Choosing the right manufacturing metrics involves understanding your production goals and constraints. If minimizing waste is a goal, prioritize metrics like scrap rate or first-pass yield. If increasing speed is the focus, include cycle time and throughput. Reliable data sources are equally important—pulling from shop floor equipment, production logs, and digital manufacturing systems. A robust manufacturing KPI dashboard will merge real-time and historical inputs, making it easier to spot outliers and track production efficiency. The clearer your data structure, the more impactful your analysis and decisions will be.
How Digital Manufacturing Enhances KPI Monitoring and Decision-Making
Digital manufacturing transforms how factories collect, interpret, and act on data. With smart sensors, cloud systems, and advanced analytics, organizations can use real-time information to optimize their manufacturing process. Dashboards built on digital infrastructure provide immediate feedback on equipment performance, output rates, and production costs. This speed of insight fuels faster decisions and supports predictive maintenance, reducing downtime and improving operational efficiency. Integrating these tools into your kpi dashboard increases visibility and enables decision-making to optimize production. In today’s competitive environment, embracing digital transformation is not optional—it’s essential for long-term success.
For ready-to-use Dashboard Templates: