Introduction to Departmental Report Automation
Why Automate Report Generation Across Departments
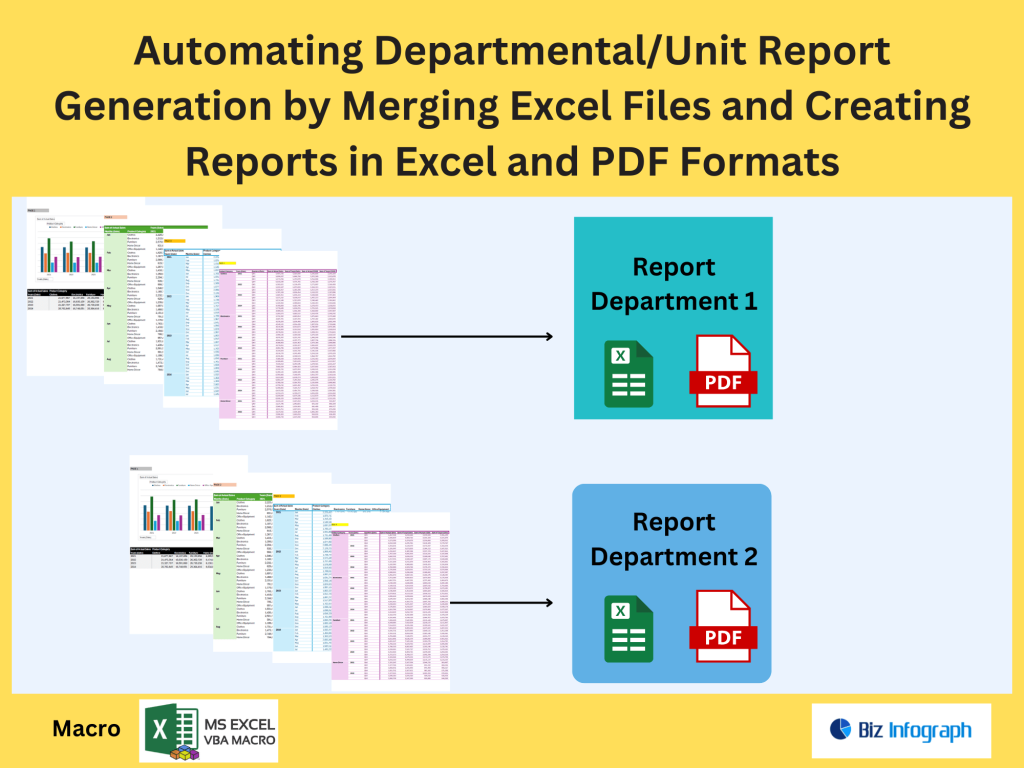
Automating departmental report generation is crucial for organizations handling vast amounts of excel data from multiple departments. Manual copying and pasting data from various excel files is time-consuming and error-prone, leading to inconsistencies and delays in reporting. By automating data consolidation using modern tools, you can streamline the entire report creation process. With ai-powered Excel capabilities and integration with business intelligence (BI) tools, teams can generate accurate, real-time reports. This automation simplifies data preparation, reduces manual intervention, and ensures that financial data, sales data, and other departmental metrics are readily available in centralized dashboards.
Tools for Automating Excel File Merging
Using Power Query to Combine Data from Different Departments
Power Query in Excel is one of the most powerful tools to combine data from different sources. With a few clicks, you can import data, perform data cleansing, and consolidate it into a unified dataset. Whether you’re working with excel workbooks, excel sheets, or files on SharePoint, Power Query allows seamless data integration. You can apply transformation steps, merge multiple excel files using consistent logic, and automate these actions to refresh when new data becomes available. This approach not only simplifies the data wrangling process but also enhances your excel skills for analyzing data more effectively.
Automating the Process with Power Automate
Microsoft Power Automate provides a robust workflow solution to handle the repetitive task of merging files and triggering report generation. You can build a power automate flow that monitors a SharePoint or OneDrive folder, detects new source files, and automatically merges them into a master excel file. This automate the process approach eliminates the need for manual checks, ensuring your reports and dashboards that allow real-time decision-making remain current. Whether it’s financial data or operational metrics, Power Automate simplifies the workflow and integrates well with Excel and Power BI for downstream processing.
Merging Excel Files for Report Generation
Structuring Excel Files for Seamless Merging
Before merging, it’s important to structure your excel files uniformly. Each excel sheet or spreadsheet should follow a standard layout with matching headers and consistent data types. This ensures that the merging process via Power Query or Power Automate runs smoothly. Use named ranges, avoid merged cells, and define clear data sets for easy consolidation. Organizing raw data in this way improves the reliability of your reports directly derived from the combined files. When each worksheet from different departments is standardized, it becomes easier to create a unified view for accurate data analysis.
Handling Large Datasets in Excel and BI Tools
Working with large datasets requires performance-aware practices. Both Power BI and Excel can handle extensive data from various sources, especially when optimized using Power Query Editor. For example, load data as connections only, limit rows if needed, and use advanced data types for efficiency. Once merged, datasets can be visualized in dashboards and reports that surface patterns and trends. BI tools like Power BI offer features for real-time updates and interactions with data warehouses, making them ideal for building scalable, automated reporting systems based on consolidated excel workbooks.
From Merged Data to Comprehensive Dashboards
Creating Unified Reports with Power BI
Once data is merged and cleaned, using Power BI to build comprehensive reports provides teams with clear insights across departments. You can connect your excel workbook or SharePoint folder as a data source, transform data, and design dashboards that present key metrics in a visually compelling way. Whether you’re tracking KPIs, financial data, or sales data, Power BI allows deep exploration and storytelling with data. With slicers and filters, users can dive into specific departmental views or aggregated results. Automating updates ensures that reports stay accurate without manual refreshes.
Building a Workflow for Real-Time Report Delivery
Integrating Power Automate and Power BI or Excel enables report generation in real-time. You can set triggers based on file uploads, scheduled times, or specific data conditions to generate reports and even email them to stakeholders. This automating report generation approach supports real-time data flows and ensures all departments are aligned. The result is faster decision-making, reduced manual processes, and more consistent communication. With proper setup, your excel reports become dynamic tools that evolve automatically as new data becomes available, empowering your team with up-to-date insights.
For ready-to-use Dashboard Templates: