Introduction to Weighted Average in Excel
What is a Weighted Average and Why It Matters
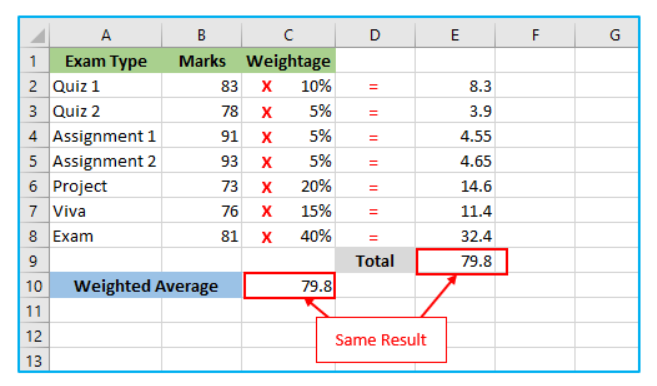
A weighted average is a method used to calculate the average of a set of numbers where each value has a different level of importance or frequency. Unlike a simple average, where all numbers are treated equally, the weighted average considers the relative weight of each value. In Excel, understanding how to calculate a weighted average is essential for performing accurate financial modeling, pricing analysis, and forecasting. It’s commonly used to determine things like average price paid per unit when quantities vary. This method is especially useful in data analysis when the goal is to calculate a realistic or fair representation of performance, costs, or trends.
How to Calculate Weighted Average in Excel
Using SUMPRODUCT and SUM Functions for Accurate Results
To calculate a weighted average in Excel, the best way to calculate it is by using a combination of the SUMPRODUCT and SUM functions. The SUMPRODUCT formula multiplies corresponding values and returns the sum of the products. This is divided by the SUM of weights to return the weighted average. For example, to calculate the weighted average price per unit sold, use the formula:=SUMPRODUCT(values, weights)/SUM(weights)
This formula in a cell will correctly calculate the weighted average as long as the weights add up to 100 or are consistent. This method allows you to calculate the average value using accurate Excel functions for financial and business datasets.
Step-by-Step Guide to Entering the Formula in Excel
Start by organizing your dataset in two columns: one for the values to average (e.g., price) and the other for their corresponding weights (e.g., units sold). Then click into the formula bar and input the formula to calculate a weighted average. The generic formula is:=SUMPRODUCT(B2:B6, C2:C6)/SUM(C2:C6)
Here, column B contains the prices and column C the quantities. This method ensures that the average price paid reflects the actual weight of each item. This function in Excel is powerful for calculating the average of a set of values where each entry has a different impact.
Practical Examples and Use Cases
Calculating Weighted Average Price in Real-World Scenarios
Let’s say you want the average price paid per item from multiple purchases where quantities vary. You can use Excel to calculate this using a weighted average formula. Suppose column B contains prices, and column C contains quantities purchased. The SUMPRODUCT of B and C gives the total spend, and dividing this by SUM(C) gives the average price paid. This formula that calculates the weighted average is especially helpful in procurement, inventory valuation, and sales forecasting. Whether you’re analyzing financial data or assessing student grades, weighted average calculations in Excel provide more accurate insights than simple averages.
Best Practices and Tips
Avoiding Common Errors When Calculating Weighted Averages
When using Excel to calculate a weighted average, always ensure your weights and values align correctly. Mismatched cell references or weights that don’t add up to 100 can skew results. To avoid this, double-check your dataset and formulas before finalizing. Use Excel’s formula bar to review syntax and logic. Remember that the SUMPRODUCT function performs the same calculation across ranges and requires equal-sized arrays. For clarity, label each column in your Excel spreadsheet and consider using named ranges for better formula readability. This will help you master Excel formulas and perform reliable data analysis consistently.
To calculate a weighted average formula in a spreadsheet workbook, use the SUMPRODUCT function with an array and ensure the sum of the weights equals hundred percentage.
For ready-to-use Dashboard Templates: