Introduction to Workforce Diversity Dashboard
What Is a Workforce Diversity Dashboard in Modern HR and DEI Strategy
A Workforce Diversity Dashboard is a powerful HR Dashboard designed to aggregate and display workforce data related to diversity, equity, and inclusion (DEI). It enables organizations to track employee demographics, monitor diversity metrics, and evaluate inclusion initiatives in a structured and visual format. In modern HR environments, this dashboard provides a centralized platform for analyzing current diversity levels across different demographic groups such as gender, ethnicity, and age.
The Workforce Diversity Dashboard provides insights that help HR teams and leadership make better decisions regarding recruitment and retention strategies. It highlights disparities in representation, identifies underrepresent groups, and supports the organization’s commitment to diversity. By combining employee data with analytics tools like Power BI, organizations can create a user-friendly interface with pie charts and visual indicators to represent diversity trends clearly.
This dashboard is essential for fostering an inclusive culture and improving workplace culture. It empowers HR teams to evaluate inclusion efforts, monitor progress over time, and ensure alignment with industry standards. Additionally, it helps organizations identify root causes of diversity gaps and take proactive steps to improve diversity outcomes.
Why Organizations Use Workforce Diversity Dashboard Excel and Templates
Organizations widely use Workforce Diversity Dashboard Excel solutions and templates because they offer a flexible and cost-effective approach to managing diversity data. These templates allow HR teams to collect, clean, and analyze employee data efficiently without requiring advanced HR software.
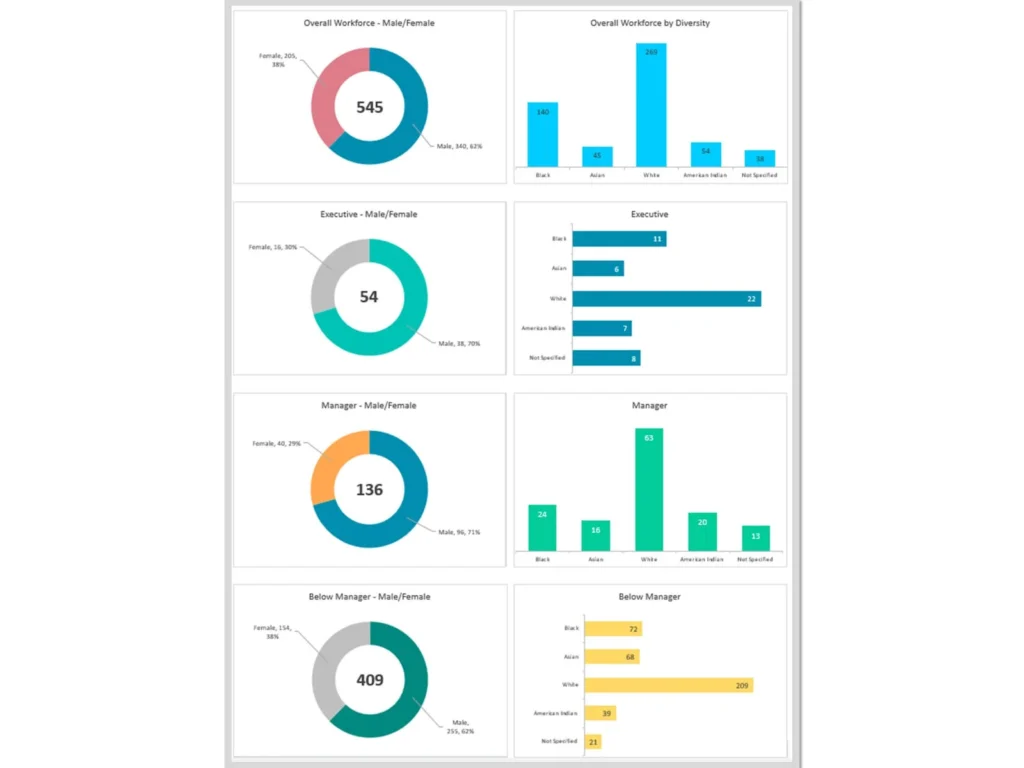
A Workforce Diversity Dashboard template helps organizations structure diversity metrics, track gender balance, and monitor pay equity across different workforce segments. By organizing data into clear visual formats, such as pie charts and graphs, the dashboard enables HR professionals to analyze trends and identify areas that need improvement.
Templates also support data collection and data cleaning processes, ensuring that diversity metrics are accurate and reliable. They provide a standardized approach to tracking DEI metrics and ensure consistency in reporting across departments.
Moreover, these templates are customizable, allowing organizations to tailor the dashboard to their specific diversity goals. HR teams can include metrics such as employee engagement, representation of women in tech, and inclusion efforts. This flexibility helps organizations align their diversity strategies with business objectives and improve overall inclusivity.
Role of HR Dashboard in Workforce Diversity and Transparency
The HR Dashboard plays a critical role in enhancing transparency and accountability in workforce diversity initiatives. It enables organizations to monitor diversity data and share insights with stakeholders, fostering trust and commitment to diversity.
The Workforce Diversity Dashboard provides real-time feedback on diversity metrics, allowing HR teams to track progress and evaluate the effectiveness of inclusion initiatives. It helps organizations identify disparities in representation, pay equity, and employee engagement, ensuring that diversity goals are met.
Transparency is essential for building an equitable workplace. By providing clear and accessible data, the dashboard empowers employees and leadership to understand diversity challenges and take action. It also supports ethical data practices by ensuring data privacy and ethical use of employee data.
Ultimately, the HR Dashboard helps organizations create a culture of accountability, improve diversity outcomes, and strengthen their commitment to DEI.
Key Workforce Diversity Metrics and Analytics
Understanding Workforce Demographics and Diversity Metrics
Workforce demographics and diversity metrics are essential components of the Workforce Diversity Dashboard. These metrics provide insights into the composition of the workforce and help organizations understand representation across different demographic groups.
Key diversity metrics include gender balance, representation of women in tech, age distribution, and cultural diversity. These metrics help HR teams evaluate current diversity levels and identify underrepresented groups within the organization.
The dashboard allows organizations to aggregate and display these metrics in a visual format, making it easier to analyze trends and identify patterns. By monitoring these metrics, HR teams can develop targeted strategies to improve diversity and create a more inclusive culture.
Understanding workforce demographics also helps organizations align their diversity goals with industry standards and best practices. This ensures that diversity initiatives are effective and contribute to long-term organizational success.
Tracking DEI Metrics and Identifying Workforce Disparity
Tracking DEI metrics is crucial for identifying disparities in the workforce and ensuring equitable practices. The Workforce Diversity Dashboard enables organizations to monitor key DEI indicators such as pay equity, employee engagement, and inclusion efforts.
The dashboard helps HR teams identify areas where disparities exist, such as unequal representation or gaps in compensation. By analyzing these metrics, organizations can uncover root causes of inequality and implement corrective actions.
Monitoring data over time allows organizations to evaluate the impact of inclusion initiatives and ensure continuous improvement. This data-driven approach supports the creation of an equitable workplace and strengthens the organization’s commitment to diversity.
Using Analytics for Data-Driven Workforce Diversity Insights
Analytics plays a vital role in generating data-driven insights from workforce diversity data. The Workforce Diversity Dashboard uses advanced analytics tools to analyze employee data and provide actionable insights.
By leveraging analytics, HR teams can identify trends, predict future diversity outcomes, and make informed decisions. For example, analytics can reveal patterns in recruitment and retention strategies that impact diversity levels.
Data-driven insights also help organizations measure the effectiveness of diversity initiatives and adjust strategies accordingly. This ensures that diversity efforts are aligned with business goals and deliver measurable results.
Workforce Diversity Dashboard for DEI Strategy
Supporting Equity and Inclusion Through Workforce Diversity Dashboard
The Workforce Diversity Dashboard is a key tool for supporting equity and inclusion within organizations. It provides insights into workforce diversity and helps HR teams develop strategies to promote inclusivity.
By tracking diversity metrics and monitoring inclusion efforts, organizations can create a more equitable workplace. The dashboard helps HR teams identify gaps in representation and implement targeted initiatives to address them.
This approach ensures that diversity and inclusion are integrated into the organization’s overall strategy and contribute to a positive workplace culture.
Measuring Commitment to Diversity Across the Workforce
Measuring commitment to diversity is essential for evaluating the effectiveness of DEI initiatives. The Workforce Diversity Dashboard provides metrics that reflect the organization’s commitment to diversity, such as representation, pay equity, and employee engagement.
These metrics help organizations assess their progress and identify areas for improvement. By monitoring diversity data, HR teams can ensure that diversity goals are met and aligned with organizational values.
Empowering HR Teams with Data-Driven DEI Analytics
The dashboard empowers HR teams by providing data-driven insights that support decision-making. It enables HR professionals to analyze diversity metrics and develop strategies to improve inclusivity.
Workforce Diversity Dashboard Examples and Use Cases
Workforce Diversity Dashboard Example for Workforce Demographics Analysis
A Workforce Diversity Dashboard example demonstrates how organizations analyze workforce demographics and identify trends.
Diversity Dashboard Example for Women in Tech and Inclusion Tracking
A diversity dashboard example highlights representation of women in tech and tracks inclusion initiatives.
HR Dashboard Example for Workforce Diversity and DEI Reporting
HR dashboard examples show how organizations report diversity metrics and track DEI performance.
Building Workforce Diversity Dashboard Template in Excel
Designing Workforce Diversity Dashboard Excel Template
Designing a dashboard template involves structuring employee data and diversity metrics.
Structuring Workforce Demographics and Diversity Metrics
Structuring metrics ensures accurate analysis of workforce diversity.
Creating Interactive Diversity Dashboard Templates for Analytics
Interactive dashboards enhance analytics and reporting capabilities.
Benefits of Workforce Diversity Dashboard for Organizations
Improving Transparency and Workforce Diversity Reporting
The dashboard improves transparency and diversity reporting.
Supporting Data-Driven DEI Decisions and Strategy
It supports data-driven decisions and strategic planning.
Enhancing Workforce Equity and Inclusion Outcomes
The dashboard enhances equity and inclusion outcomes.
Best Practices for Implementing Workforce Diversity Dashboard
Selecting the Right Workforce Diversity Metrics and Analytics
Selecting relevant metrics ensures meaningful insights.
Using Workforce Diversity Dashboard Templates Effectively
Using templates improves efficiency and reporting.
Building Best HR Dashboards for Diversity and Inclusion Reporting
Building effective dashboards ensures successful DEI implementation.
For ready-to-use Dashboard Templates: