Introduction to Supply Chain Performance Dashboards
What Is a Supply Chain Dashboard and Why It Matters
A supply chain dashboard is a visual tool designed to provide supply chain professionals with real-time insights into key activities and metrics across the supply chain. It offers a comprehensive view of the supply chain, allowing users to monitor and manage operations, inventory, production, logistics, and supplier performance. A dashboard is a powerful tool that helps supply chain managers make informed decisions by centralizing critical data. It highlights the flow of goods, identifies bottlenecks, and provides transparency across the entire supply chain, making it easier to detect inefficiencies and optimize performance.
Benefits of Using a Supply Chain Performance Dashboard
The benefits of using a supply chain performance dashboard are wide-ranging. These dashboards enable real-time supply chain visibility, improve decision-making, and support supply chain risk management. By tracking supply chain KPIs and metrics, such as inventory turnover, order cycle time, and supplier reliability, businesses can enhance supply chain efficiency. They also help manage exceptions and disruptions by alerting users to anomalies or delays, which is essential for maintaining a resilient supply chain. Moreover, performance dashboards improve alignment among teams and provide supply chain leaders with a view of the entire supply chain, ensuring that operations run smoothly and cost-effectively.
Dashboards for Supply Chain vs. Manufacturing Dashboards
While both supply chain and manufacturing dashboards share similarities, they serve different functions. Manufacturing dashboards focus primarily on production KPIs such as throughput, equipment effectiveness, and defect rates. In contrast, a supply chain performance dashboard tracks the flow of materials, goods, and services across the entire value chain. Manufacturing dashboard examples may include real-time machine monitoring or shift performance, whereas dashboards for supply chain incorporate metrics like supplier lead times, transportation costs, and stockouts. Both dashboards can be integrated to offer a full view of the supply chain and production processes, giving decision-makers the insights needed to optimize their end-to-end supply chain.
Key Metrics and KPIs in a Supply Chain Dashboard
Most Important Supply Chain KPIs and Metrics to Monitor
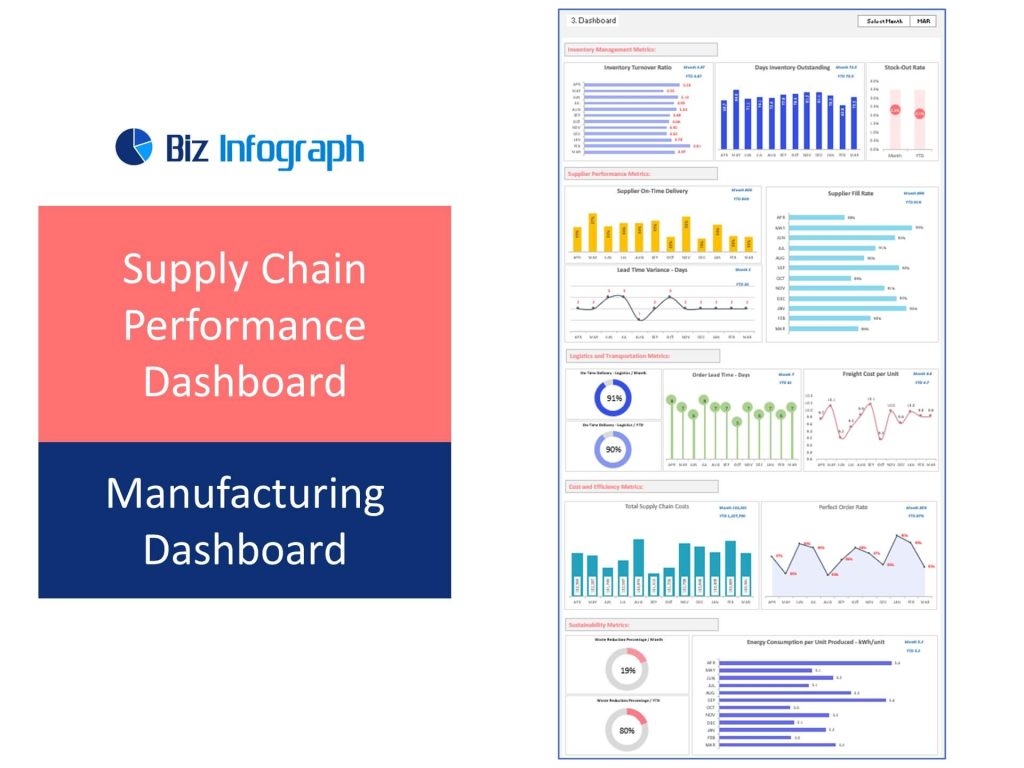
Tracking the right supply chain KPIs is essential for measuring the success of supply chain operations. These key supply chain metrics may include order accuracy, inventory turnover, freight cost per unit, fill rate, perfect order rate, and days inventory outstanding. An effective supply chain dashboard should include these supply chain performance metrics to offer a balanced view of efficiency, cost, and service quality. By monitoring these metrics, companies can detect problems early and proactively resolve issues that impact customer satisfaction and profitability. Ultimately, a supply chain metrics dashboard helps drive effective supply chain management.
How to Choose the Right Key Performance Indicators (KPIs)
To create an effective supply chain dashboard, it’s important to select KPIs that align with your strategic objectives and operational needs. Key performance indicators should reflect the organization’s goals—whether it’s reducing lead times, minimizing stockouts, or optimizing transport costs. The selected supply chain KPIs should also be measurable, actionable, and relevant across departments. A well-aligned supply chain KPI dashboard ensures clarity, accountability, and performance improvement. Avoid overloading the dashboard with too many indicators; instead, focus on a few critical supply chain metrics that provide the greatest impact across your operations.
Common Performance Metrics in Inventory Management and Cycle Time
Two key areas that benefit significantly from dashboard tracking are inventory management and cycle time. An inventory management dashboard monitors inventory levels, reorder points, turnover rates, and carrying costs, giving businesses insight into stock efficiency and warehouse utilization. Meanwhile, cycle time metrics track the duration it takes to complete core supply chain activities—from procurement to delivery. These performance indicators are especially useful for supply chain managers looking to reduce lead times and improve responsiveness. Dashboards that consolidate these metrics into a single view enable stakeholders to make faster, data-driven decisions that optimize supply chain operations.
Types and Examples of Supply Chain Dashboards
Different Types of Supply Chain Dashboards for Various Functions
There are several types of supply chain dashboards, each tailored to specific operational needs. Examples include risk management dashboards for monitoring vulnerabilities, inventory dashboards for warehouse oversight, logistics dashboards for shipment tracking, and supplier performance dashboards to manage vendor relationships. These dashboards for supply chain activities provide role-specific insights for procurement, planning, logistics, and finance. By understanding the unique needs of each function, businesses can deploy dashboards that deliver real value and foster a more efficient supply chain. Selecting the right type of dashboard is crucial for addressing different supply chain challenges.
Supply Chain KPI Dashboard Examples in Manufacturing
Supply chain KPI dashboard examples in manufacturing often integrate data from ERP, WMS, and MES systems to offer real-time performance tracking. These dashboards may display metrics like production delays, inventory shortages, and supplier lead time variability. By combining manufacturing and supply chain data, these dashboards provide a comprehensive view of the supply chain, allowing leaders to assess how upstream and downstream factors impact overall operations. These manufacturing dashboard examples also highlight the effectiveness of cross-functional collaboration in managing performance and reducing costs. Well-designed dashboards support continuous improvement and align operations with broader strategic goals.
Inventory Management Dashboard as a Critical Supply Chain Tool
An inventory management dashboard is one of the most vital tools in a supply chain performance dashboard setup. It provides real-time visibility into stock levels, reorder points, stockout risks, and safety stock thresholds. These dashboards allow organizations to track supply chain inventory movements and make timely decisions to replenish stock. With accurate data, supply chain professionals can better forecast demand, reduce excess inventory, and avoid supply disruptions. A well-implemented inventory dashboard improves supply chain efficiency and supports cost control, making it a critical supply chain tool in any high-performing organization.
Implementing an Effective c
Best Practices for Implementing Supply Chain Dashboards
Implementing supply chain dashboards successfully requires clear planning, goal setting, and stakeholder alignment. Start by identifying the core business challenges and selecting the most relevant supply chain KPIs and metrics. Engage cross-functional teams to ensure that all relevant supply chain activities are captured. Choose a flexible dashboard platform that can integrate with existing systems and support real-time data visualization. Train users on how to interpret metrics and encourage regular dashboard usage. Above all, ensure that your dashboard is aligned with operational goals and provides a real-time, comprehensive view of the supply chain to guide action.
Key Features of an Effective Supply Chain Performance Dashboard
An effective supply chain performance dashboard includes features like customizable layouts, real-time alerts, drill-down capabilities, and mobile access. The dashboard should offer role-based views so that executives, planners, and warehouse staff each see relevant information. Real-time data from across the supply chain—procurement, production, logistics, and sales—must be consolidated to ensure users are working with the most accurate insights. Advanced analytics and historical trends should be incorporated to support predictive decision-making. The goal is to empower users to manage your supply chain proactively, rather than reactively, improving supply chain resilience and performance.
Addressing Supply Chain Challenges with Real-Time Data and Visualization
Modern supply chains face numerous challenges—ranging from global disruptions and delays to fluctuating demand and geopolitical risks. A real-time supply chain dashboard helps overcome these issues by centralizing critical data, making it easier to respond to events as they happen. These dashboards provide visibility into the supply chain, highlight vulnerabilities, and support mitigation strategies. They also help businesses build a more sustainable supply chain by tracking environmental and social performance indicators. The ability to visualize data instantly allows supply chain managers to act with speed and confidence, turning uncertainty into opportunity.
Enhancing Supply Chain Management Through Dashboards
How Dashboards Improve End-to-End Supply Chain Visibility
One of the greatest advantages of dashboards is the ability to provide end-to-end supply chain visibility. From raw materials to last-mile delivery, a supply chain dashboard consolidates data to create a single source of truth. This level of transparency is critical for optimizing supply chain workflows and anticipating disruptions. Dashboards help teams spot performance gaps, align departmental goals, and enhance coordination across the network. With a clear view of the supply chain, decision-makers can respond faster to problems, reduce waste, and improve customer satisfaction. End-to-end visibility drives agility, responsiveness, and profitability.
Role of Dashboards in Supply Chain Risk Management
Supply chain risk management is a growing priority as businesses face increasing volatility. Dashboards can play a vital role by identifying high-risk suppliers, flagging transportation delays, and monitoring geopolitical or environmental risks. A risk management dashboard visualizes threat levels and trends, enabling preventive action. These tools also track KPIs related to continuity planning, such as backup supplier readiness or emergency inventory levels. Dashboards turn risk management from a static policy into a dynamic, data-driven practice, which is essential for building supply chain resilience and ensuring effective supply chain performance.
Building a Management Dashboard for the Entire Supply Chain
Creating a management dashboard that covers the entire supply chain involves integrating data from procurement, production, warehousing, transportation, and sales. This unified platform supports effective supply chain management by allowing leaders to monitor KPIs, analyze trends, and manage resources across departments. The dashboard should be easy to navigate, customizable, and capable of delivering supply chain analytics at both strategic and operational levels. With the right design, the dashboard offers real-time insights that help optimize planning, improve efficiency, and drive performance improvements throughout the supply chain.
For ready-to-use Dashboard Templates: