Introduction to Social Media Dashboard
What Is a Social Media Dashboard and Why It Matters
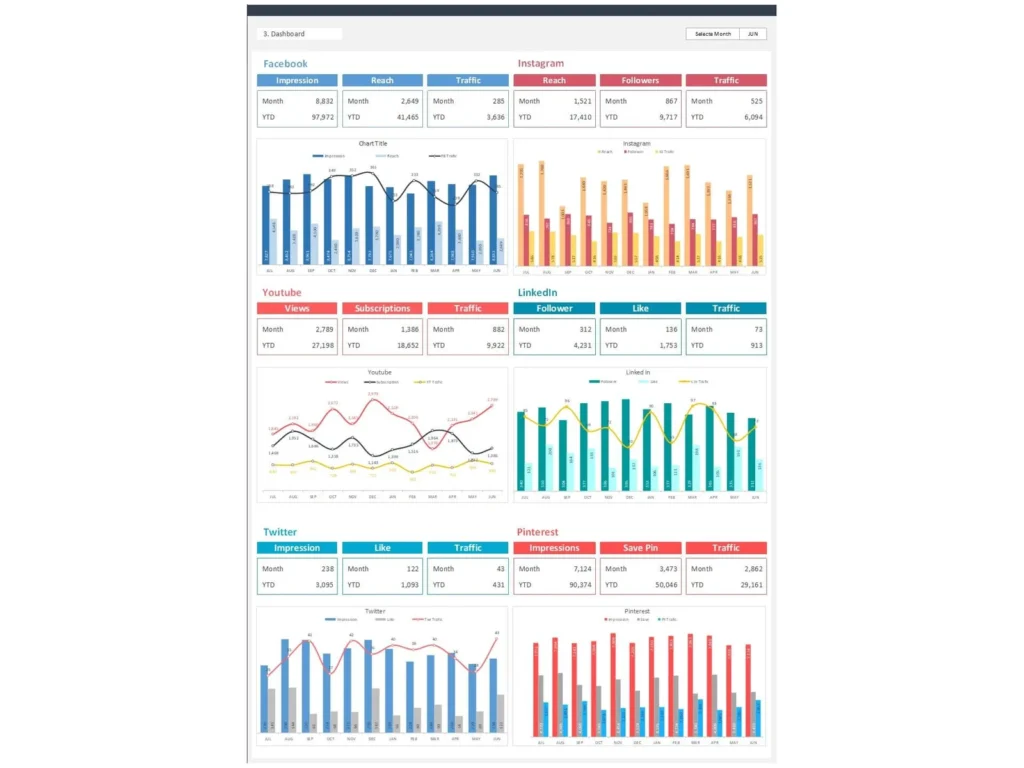
A Social Media Dashboard is a reporting system that brings key results from different social media channels into one clear view. It helps businesses monitor performance across social networks, track engagement, and evaluate campaigns without opening each platform separately. In simple terms, it is a dashboard to track how content, campaigns, and audience activity are performing. A strong dashboard matters because it organizes social media data into meaningful insights. It gives teams a better understanding of overall social performance, helps measure progress toward social media goals, and supports better planning for both daily activity and long-term growth.
How a Sales Dashboard Style Layout Improves Social Media Reporting
A Sales Dashboard style layout works well for marketing because it presents information using clear KPI cards, charts, trend lines, and summary sections. The same structure that helps track revenue or pipeline can also improve social media reporting by showing audience growth, clicks, reach, and social media engagement in an organized way. This style helps users move quickly from summary to detail. Instead of looking at scattered reports from different social media accounts, teams can view one centralized layout. A structured dashboard makes reporting easier to explain in meetings and gives leadership a more practical way to review performance.
Why Businesses Use a Social Media Dashboard Excel Template
Many businesses choose a Social Media Dashboard excel file because it is flexible, affordable, and easy to customize. A ready-made Sales Social Media Dashboard template helps teams save time by using a proven reporting structure rather than building everything from scratch. It can include KPI sections, trend charts, platform comparisons, and content summaries in one place. This makes it easier to create a social media dashboard that is both practical and professional. Excel also supports customization for different reporting needs, so businesses can build your social media reporting process around their actual goals, platforms, and team requirements.
Core Benefits of a Social Media Dashboard
Improving Visibility with a Social Media Reporting Dashboard
A social media reporting dashboard improves visibility by collecting data from multiple social platforms into one centralized report. Instead of checking Instagram, Facebook, LinkedIn, X, YouTube, or TikTok one by one, teams can review all major results from a centralized social media dashboard. This makes it easier to compare channels, identify performance gaps, and monitor growth. Better visibility helps teams understand whether their social efforts are producing real business value. It also makes reporting more efficient because all the most important numbers are available in one place, which improves communication and decision-making across the company.
How Social Media Reporting Helps Better Marketing Decisions
Good social media reporting helps teams move from guesswork to evidence-based action. By reviewing campaign performance, post engagement, audience growth, and traffic results, managers can decide which tactics are working and which need improvement. This is especially useful when businesses want to optimize your social media strategy and focus resources more effectively. A dashboard helps reveal patterns across content types, platforms, and time periods. It also shows how social media marketing efforts are contributing to broader business goals. When reporting is consistent and visual, it becomes easier to make smarter marketing decisions with confidence.
Using Reporting Dashboards for Holistic Social Media Performance Review
A strong dashboard supports a holistic social media view by combining channel, campaign, content, and audience performance in one place. This kind of comprehensive social media reporting helps businesses see the bigger picture instead of focusing on isolated numbers. It can include both awareness metrics and action-based results, giving users a broader understanding of social presence, audience behavior, and content effectiveness. This matters because a full performance review supports better planning and stronger alignment between brand activity and business goals. A dashboard turns scattered information into a complete performance story that is easier to understand and act on.
Key Metrics in a Social Media Dashboard
Essential Social Media Metrics Every Business Should Monitor
Every Social Media Dashboard should include the most relevant social metrics that help explain campaign and content performance. These often include reach, impressions, clicks, engagement rate, follower growth, conversions, and post frequency. These numbers help businesses measure whether they are building audience interest and driving useful action. A dashboard should also align these metrics with social media goals, whether those goals focus on awareness, engagement, leads, or sales. Choosing the right metrics is critical because the value of reporting depends on whether it reflects what truly matters to the business.
Tracking Social Media KPIs for Campaign and Content Performance
A social media kpi dashboard helps businesses measure campaign and content success more clearly. It can track click-through rates, engagement rates, cost per result, views, saves, and conversions depending on the objective of the campaign. These social media kpis show whether specific campaigns are effective and whether individual social media posts are creating value. By comparing content performance across formats and channels, teams can identify which types of posts deserve more attention. This makes it easier to adjust strategy and improve future output. KPI tracking transforms simple reporting into a stronger management and optimization tool.
Social Media Dashboard Excel Features
How Social Media Dashboard Excel Simplifies Reporting
A Social Media Dashboard excel workbook simplifies reporting by organizing raw platform exports into one structured report. It can bring together channel summaries, campaign metrics, engagement trends, and audience insights in a format that is easy to update and review. This saves time and improves consistency. Excel is especially useful for businesses that want flexibility in layout, formulas, and visual summaries. A strong Excel dashboard can also support regular reporting cycles without the cost of complex software. For many small and mid-sized teams, it remains one of the most practical ways to manage and review social reporting.
Building Clear Reports with Dashboard Templates and Visual Summaries
Good dashboard templates help users present information clearly and consistently. A strong dashboard uses KPI cards, charts, traffic indicators, and summary sections to make reporting easier to understand. Visual summaries are especially important when users need to communicate results to leadership or clients. They help explain performance quickly without requiring long written reports. A professional Social Media Dashboard should combine simplicity with enough detail to support analysis. Templates improve structure and reduce design effort, allowing businesses to focus more on interpretation and action.
Social Media Reporting and Marketing Analysis
How Social Media Marketing Teams Use Dashboards for Reporting
A social media team uses dashboards to organize results, monitor performance, and communicate progress to management. A clear dashboard helps track campaigns, compare channels, and summarize content outcomes in a way that is easy to share. It also supports routine reporting across departments. Whether the focus is brand awareness, lead generation, or community building, a dashboard gives structure to social media marketing review. This is especially helpful when managing social media marketing efforts across several campaigns at once.
Comparing Campaign Results with Social Media Dashboard Examples
Reviewing social media dashboard examples helps businesses learn how to compare campaign performance more effectively. By studying examples of social media reporting layouts, teams can see how others organize platform summaries, KPI sections, and trend comparisons. This reduces trial and error when designing a report. Examples also help businesses understand what information deserves priority and what visuals make reporting easier to read. Good examples can guide decisions about charts, tables, and platform sections. For teams trying to create your social media reporting system, examples offer a strong starting point and help improve overall dashboard design quality.
Using Social Media Reporting Tools for Better Performance Insights
Many businesses combine Excel reporting with social media reporting tools to improve speed and depth of analysis. These tools may pull data from various social media platforms automatically, making updates faster and reducing manual work. Some teams use a social media management tool like Sprout Social to centralize platform analytics, publishing, and reporting. These tools help teams study channel performance, audience behavior, and content trends in more detail. Whether used alone or together with Excel, reporting tools improve insight and consistency.
Dashboard Design and Customization
How to Create a Social Media Dashboard for Business Goals
To create a social media dashboard that adds value, businesses need to start by defining their main objectives. Some companies want to track awareness, others focus on conversions, and others care most about engagement or traffic. The dashboard should reflect those goals through the metrics, charts, and comparisons it includes. When teams are creating a social media reporting process, they should think carefully about audience, reporting frequency, and platform mix. A dashboard built around real business goals is easier to use and more meaningful in meetings. Good design starts with purpose, not just appearance.
Using Customizable Social Media Dashboards for Different Reporting Needs
Customizable social media dashboards are valuable because they can be adjusted for different reporting purposes. A manager may want a high-level summary, while a content team may need detailed post analysis and channel comparisons. Some businesses also need separate views for organic and paid social, since these activities often have different objectives and budget implications. Flexible dashboards help teams serve different audiences without rebuilding the report from the beginning.
Practical Use Cases for Social Media Dashboards
How to Build Your Social Media Reporting Process with One Dashboard
A business can build your social media reporting process more effectively by using one central dashboard as the main reporting hub. This single dashboard can bring together campaign results, post engagement, audience growth, and platform comparisons. Using one report improves efficiency and reduces confusion because everyone works from the same numbers. It also helps businesses standardize how performance is reviewed over time. For teams managing several social channels, one clear dashboard makes ongoing reporting much easier. It becomes the main reference point for meetings, planning, and performance discussions across marketing and leadership.
Best Social Media Dashboard Ideas for Teams and Businesses
The best social media dashboard ideas are the ones that fit the company’s actual reporting needs. Some teams benefit from a high-level executive summary, while others need detailed post and channel analysis. Effective dashboards may include platform comparison views, real-time social engagement tracking, paid versus organic campaign summaries, and top-performing content lists. A real-time dashboard is especially helpful for fast-moving campaigns or active customer engagement periods. Since dashboards provide real-time visibility when connected to live data sources, they can help teams react faster and make more informed decisions during ongoing campaigns.
Conclusion
Why a Sales Social Media Dashboard Template Is a Practical Reporting Tool
A Sales Social Media Dashboard template is a practical reporting tool because it brings structure, clarity, and consistency to marketing analysis. It helps businesses organize data from different social media accounts, compare performance across social media channels, and present results in a way that is easy to understand. Templates save time, reduce manual work, and improve reporting accuracy.
Final Thoughts on Using a Social Media Dashboard for Better Marketing Performance
A well-built Social Media Dashboard helps businesses monitor social media efforts, improve campaign review, and manage performance more confidently. It creates a clearer picture of how content, campaigns, and audience activity contribute to broader marketing objectives. Whether a business uses Excel, Sprout Social, or another social media management tool, the real value comes from turning information into action.
For ready-to-use Dashboard Templates: