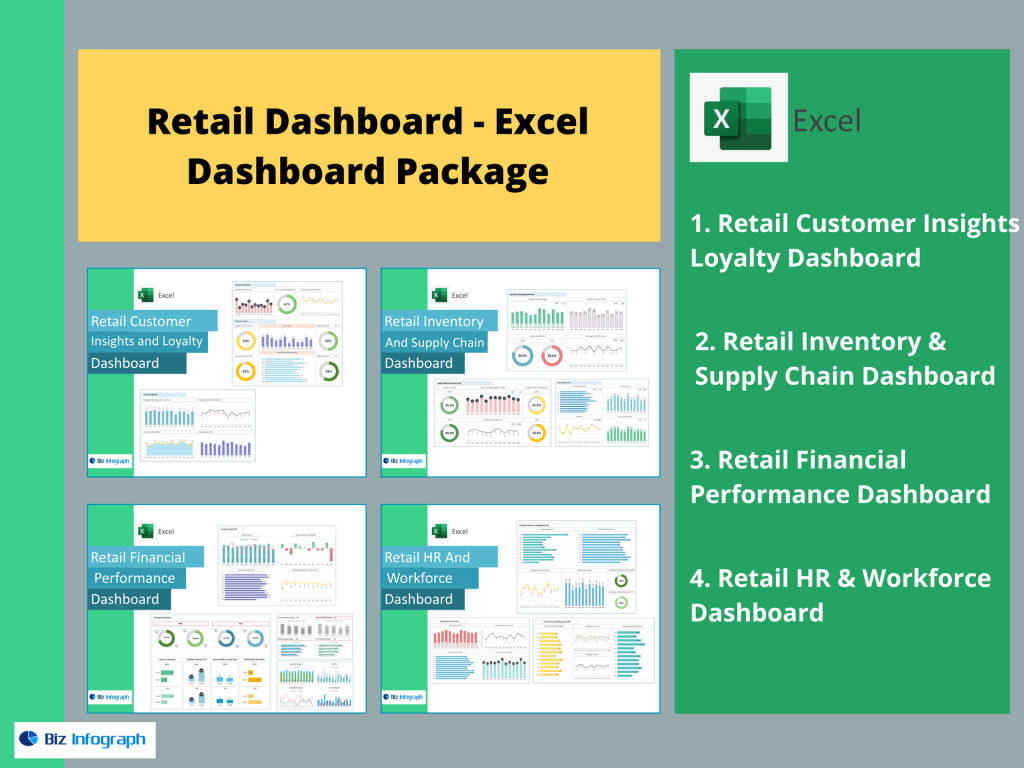
Introduction to the Retail Dashboard Package
What Is a Retail Dashboard and Why It Matters
A retail dashboard is a powerful data visualization tool that consolidates critical retail metrics into a single, interactive interface. It helps businesses monitor retail operations, analyze performance, and make informed decisions by transforming retail data into actionable insights. Unlike static dashboards, modern analytics dashboards pull real-time data from multiple sources, giving users a dynamic overview of sales, inventory, and customer behavior. Retailers use dashboards to track key performance indicators (KPIs) such as gross sales, lost sales, customer satisfaction, and conversion rates. A well-designed dashboard enables retail leaders to spot missed sales opportunities, uncover trends, and stay ahead of the competition.
The Role of Analytics in Retail Success
Retail analytics plays a vital role in achieving retail success. By combining data engineering, data science, and intuitive data visualization, businesses can gain a deep understanding of their store performance and customer interactions. An effective kpi dashboard helps businesses make smarter decisions by highlighting areas that need attention, such as low-performing SKUs or underperforming store locations. These insights drive strategic decisions that improve profit margins, boost customer satisfaction, and reduce missed sales. With access to real-time insights, retailers can pivot quickly in response to market shifts, enabling faster, more informed decision-making across all departments.
Key Features of a Retail Dashboard
Tracking KPIs That Matter for Retailers
An effective retail dashboard focuses on key retail metrics that reflect performance across stores, products, retail business, and customer segments. Retailers typically track KPIs such as gross sales, average transaction value, conversion rate, inventory turnover, customer data, customer insights, and customer satisfaction. A strong kpi dashboard offers both summary and drill-down views, allowing executives to assess company-wide trends or evaluate individual store and employee performance. These dashboards help highlight sales spikes, inventory shortages, and customer service gaps. When integrated with financial dashboards and sales dashboards, retailers gain a complete view of business performance in a single place.
Turning Retail Data Into Actionable Insights
Retail data analytics becomes valuable when it is translated into actionable insights. A good dashboard provides decision-makers with the right data at the right time, improving faster decision-making. By using data models and predictive analytics, retailers can forecast demand, identify opportunities for growth, and prevent lost sales. Dashboards can help visualize patterns in product returns, customer churn, and regional sales, enabling stakeholders to respond with proactive strategies. The result is not just better reporting, but enhanced performance driven by clarity, visibility, and insights.
Custom Dashboards Tailored to Retail Needs
No two retail operations are the same. That’s why the best dashboard software allows users to create custom dashboards specific to their business needs. With advanced design tools, retailers can build interactive dashboards that reflect their unique workflows, product lines, and market dynamics. Custom dashboards provide flexibility in choosing KPIs, layout, and data sources—whether focusing on store performance, marketing ROI, or inventory management. These dashboards also improve data security by limiting access based on user roles, ensuring enterprise-grade protection of sensitive retail data. The ability to tailor dashboards ensures maximum relevance and adoption across teams.
Retail Dashboard Examples and Use Cases
Analytics Dashboards for Brick-and-Mortar vs. E-commerce
Retail dashboard examples vary depending on the retail model. Brick-and-mortar retailers benefit from dashboards that track foot traffic, in-store conversions, and regional sales performance. Meanwhile, e-commerce dashboards often prioritize real-time visibility into website traffic, cart abandonment, fulfillment rates, and digital ad ROI. For both models, analytics dashboards help understand customer behavior and provide the visibility needed for operational agility. Real-time alerts and forecasting models help teams optimize pricing, promotions, and stock replenishment to match demand. This tailored approach allows for responsive strategies across different selling environments.
Retail Dashboard Examples for Sales, Inventory, and Customer Behavior
Some of the most popular dashboard examples focus on sales-related data, inventory movement, and customer engagement. These performance dashboards combine sales trends, daily transactions, stock levels, and shopper demographics into one visual interface. By monitoring sales velocity and customer satisfaction scores, businesses can respond quickly to product demand or service issues. Integrating POS systems, CRMs, and supply chain tools enables retailers to see the full customer journey—from discovery to purchase—leading to stronger loyalty and more targeted marketing.
Dashboards That Support Fast, Informed Decision-Making
A well-implemented retail dashboard enables faster, more confident decision-making by surfacing real-time data and simplifying analysis. Whether it’s a store manager checking daily performance or a C-suite executive reviewing quarterly trends, dashboards offer clear, concise insights for every level. Retail leaders use these tools to track marketing effectiveness, control costs, and boost sales through data-backed actions. Real-time access to metrics allows teams to react instantly—correct inventory errors, address lost sales, or launch new promotions. By enabling smarter decisions, dashboards reduce guesswork and enhance agility in fast-moving retail environments.
Building a High-Impact Retail Dashboard Package
How Retail Leaders Use Dashboards for Competitive Advantage
Retail leaders leverage dashboards as a competitive differentiator by turning complex retail data into strategic decisions. Dashboards reveal patterns in buyer behavior, seasonal trends, and sales team performance, giving retailers an edge in anticipating demand and outperforming competitors. These tools are especially powerful in franchise models or national chains, where visibility across multiple regions is critical. Dashboard can help ensure all stores meet brand standards and KPIs, fostering consistency and continuous improvement.
Creating a KPI-Driven Analytics Dashboard
A KPI dashboard aligned with business objectives is essential to drive performance and accountability. Retailers should prioritize key performance indicators that map directly to revenue, profitability, and customer retention. Incorporating data analytics techniques and real-time data, the dashboard can alert users to anomalies, outliers, or trends needing attention. With a balance of visual summaries and detailed drill-downs, these dashboards help everyone—from marketing to merchandising—act on the data. Sales dashboards, financial dashboards, and management dashboards can be layered to create a 360° view of operations.
Best Practices for Dashboard Design and Implementation
Effective dashboard design starts with clarity, relevance, and usability. Retailers should avoid clutter by focusing on the most impactful KPIs, using interactive dashboards that enable users to filter data by store, time period, or product category. Design principles such as intuitive navigation, consistent color coding, and mobile responsiveness make the dashboard more accessible. Enterprise-grade dashboards should also incorporate data security, role-based access, and API integrations. Implementation should involve stakeholder input, pilot testing, and training to ensure teams understand how to use the dashboard to drive retail success. When done right, a dashboard helps transform your retail data into a strategic asset.
For ready-to-use Dashboard Templates: