Why Real Estate Dashboards Matter for Analytics
How real estate dashboards improve property management decisions
In today’s real estate sector, property managers and investors deal with large volumes of real estate data—rent roll, occupancy rate, leasing activity, maintenance tickets, marketing leads, and financial performance. A modern real estate dashboard centralizes this information into one management dashboard, making real estate management easier and more accurate. Instead of reviewing scattered spreadsheets or outdated reports, dashboards help managers monitor real-time insights into property performance. For example, a dashboard can alert managers when occupancy declines, rental revenue drops, or satisfaction scores fall. With key performance metrics clearly displayed, managers can make data-driven decisions faster, optimize workflow, and reduce operational delays. Dashboards also streamline communication across teams, improving real estate operations across multiple sites or portfolios.
Turning real estate analytics into actionable performance metrics
Real estate analytics only becomes useful when it creates action. Dashboards transform complex real estate analytics into performance metrics such as leasing conversion, vacancy risk, maintenance response time, net operating income (NOI), and portfolio performance. A KPI dashboard provides a clear overview of how the real estate business is performing at property and portfolio levels. With strong data visualization, dashboards highlight trends like seasonal vacancy patterns, rising maintenance costs, or strong market trends in certain areas. Because dashboards can integrate multiple data sources, decision-makers can view key metrics across leasing, marketing, operations, and finance. This makes it easier to identify areas requiring improvement and apply solutions tailored to long-term value creation in real estate investment.
What Makes a Strong Real Estate Dashboard Template
Must-have KPIs for property portfolio and listings
A strong dashboard template must track the real estate KPIs that matter most to profitability and growth. Essential metrics include occupancy rate, vacancy days, lease renewal rate, rental revenue, average days on market, leasing pipeline, property listings status, and satisfaction scores. For real estate investment portfolios, key metrics include net operating income, cap rate trends, cash flow, and portfolio performance. For real estate professionals and agents, KPIs include lead conversion, client relationships progress, and agent performance. Dashboards that track these KPIs provide a view of key indicators across property portfolio and listing operations. With these KPIs, managers can monitor performance, detect risk early, and maintain up-to-date reporting across all properties.
Dashboard examples: Excel dashboard vs Power BI dashboards
Many real estate professionals start with an Excel dashboard because it is simple, printable, editable, and easy to customize. Excel dashboard templates work well for smaller portfolios or individual agent dashboards. However, as real estate operations scale, Power BI becomes the best platform for deep real estate analytics. Power BI dashboards can connect data across multiple data sources—CRM systems, real estate management systems, property databases, and financial tools—providing real-time insights and interactive visualization. Real estate dashboard examples in Power BI often include drilldowns, filters by building/unit, and automated refresh. In short, Excel dashboards are ideal for quick setup and printable reports, while BI dashboards are best for scalability, seamless integration, and enterprise-level analytics.
Customizable, printable, and editable dashboard features
The most effective Real Estate dashboard templates are designed for real estate with flexibility in mind. A customizable real estate dashboard should allow users to modify layout, KPIs, property categories, and reporting periods. Printable dashboards are useful for owners’ meetings, onboarding packages, and investor reporting. Editable templates support fast changes when business requirements evolve. Dashboards should also include widgets like KPI cards, alerts, and charts that provide a clear and digestible view. When dashboards centralize data across leasing, maintenance, and finance, the dashboard enables managers to simplify reporting and improve decision-making. Solutions tailored to different users—real estate agent, property manager, investor—ensure the template fits your specific needs, supports scalability, and improves long-term performance outcomes.
Property Management Performance Dashboard
Property performance KPIs like occupancy rate and rent
A Property Management Performance Dashboard focuses on core operations: occupancy, leasing activity, and rental income. This is where the Leasing and Occupancy Operations Dashboard plays a key role. It tracks occupancy rate, vacancy, rental revenue, lease renewal trends, rent increases, and unit-level performance. A real estate dashboard helps managers to monitor property performance and identify risk zones early—for example, units that remain vacant too long or rent collections that trend downward. With KPI widgets, managers can view key metrics daily and address problems proactively. This dashboard also supports inventory management for units, showing available units, upcoming vacancies, and future lease expirations. When dashboards provide real-time insights, managers can optimize occupancy and protect long-term value.
All-in-one management dashboard for property management
For property management, speed and clarity matter. An all-in-one management dashboard combines leasing pipeline, tenant communications, maintenance status, and financial health into one view. It supports real estate management by centralizing data across the property portfolio and reducing manual reporting workload. Dashboards help streamline operations by reducing “back and forth” between systems and allowing integrated systems performance. With real-time alerts, managers can detect overdue maintenance, rising vacancy risk, or tenant satisfaction issues. A good dashboard template also supports workflow visibility: pending applications, scheduled showings, and upcoming lease renewals. This type of dashboard simplifies decision-making and gives property managers a clear overview of the most important operational priorities.
Real Estate Sales & Agent Performance Dashboard
Sales dashboards for real estate professionals and agents
A real estate sales dashboard is designed for real estate professionals who need to track pipeline performance and close deals faster. Sales dashboards track lead inquiries, showings, offers submitted, deals under contract, closing timeline, and win/loss ratios. For sellers and buyers, this dashboard provides transparency on client journey status. It helps agents analyze performance metrics like conversion rate per stage, average time to close, and deal value trends. Real estate dashboard software also supports market trends analysis—showing pricing shifts, listing activity, and buyer demand. By using data visualization, agents can see sales trends clearly and adjust marketing strategies. With dashboards that track performance, agents can make data-driven decisions and boost business growth.
Agent dashboard KPIs for productivity and client management
An agent dashboard is critical for client management and productivity. It tracks lead follow-up status, calls made, meetings scheduled, listing performance, and customer relationship health. By using a dashboard template, agents can centralize workflow and ensure no opportunities are lost. Agent performance KPIs include daily activity metrics, pipeline volume, and referral generation. Dashboards also provide real estate marketing insights—how many leads came from ads, social channels, referrals, or open houses. With dashboards, agents build personalized real estate experiences by responding faster and tracking client relationships more effectively. When integrated into a real estate management system or CRM, the agent dashboard becomes a real-time productivity tool supporting seamless onboarding and better client satisfaction.
Real Estate CRM & Marketing Analytics Dashboard
Real estate marketing KPIs for lead and listing growth
Real estate marketing is highly competitive. A marketing analytics dashboard helps track performance of campaigns, lead generation sources, and listing growth strategies. It monitors metrics like cost per lead, lead conversion rate, inquiries per property listing, and engagement trends. Dashboards help agents and managers evaluate marketing strategies and adjust quickly. A real estate dashboard provides insights into market by comparing performance across neighborhoods, property types, and listing channels. With up-to-date reporting, teams can identify which listing strategy is producing faster closings. Marketing dashboards also track sellers and buyers engagement and highlight areas for improvement in communications. With real-time insights, marketing becomes measurable and more profitable for real estate business growth.
CRM dashboard template for client management workflow
A CRM dashboard template is essential for managing client relationships. It tracks pipeline progress, follow-up activities, lead stage movement, communication history, and closing probability. This dashboard centralizes client management workflow and helps agents stay organized. It also supports scalability—especially for teams managing high volumes of leads. Real estate management becomes smoother when the dashboard enables automation of reminders, follow-up alerts, and lead assignment. With integrated systems and seamless integration, agents can combine data across CRM, listing platforms, and property databases into one dashboard. This makes reporting concise, simplifies daily routines, and helps agents focus more time on selling rather than administrative work.
Real Estate Portfolio Investment Analytics Dashboard
Property portfolio KPIs for cash flow and ROI tracking
Real estate investment requires strong analytics at the portfolio level. The Real Estate Financial Performance Dashboard is designed to track rental revenue, expenses, NOI, cash flow, cap rate, ROI, and portfolio performance. Investors use this dashboard to understand how properties perform across regions and asset types. It also tracks financial health trends—whether profits are rising, costs are increasing, or vacancy is reducing returns. A KPI dashboard provides a view of key financial indicators, making it easier to plan financing, acquisitions, or disposition decisions. By integrating financial tools and property performance data, the dashboard provides a clear investment overview. This supports better decision-making and long-term value growth.
Real estate portfolio dashboard software and BI integration
For large property portfolios, real estate dashboard software must support multiple data sources and BI integration. Power BI enables dashboards to connect accounting data, rent roll systems, maintenance platforms, and property databases. With data visualization and interactive analytics, leadership can drill down into property-level financial performance and operational drivers. BI dashboards help centralize reporting, improve transparency, and reduce manual reporting errors. A scalable dashboard solution can also include embedded analytics inside management portals for stakeholders. For investors, integrated BI dashboards mean faster access to data across portfolio assets. By combining data across multiple systems, dashboards enable real estate teams to streamline reporting, track KPIs, and make data-driven decisions.
How to Implement Real Estate Dashboards Seamlessly
Onboarding setup, seamless integration, and data sources
Implementing dashboards requires thoughtful onboarding. First, identify your data sources: leasing systems, property management platforms, CRM, accounting software, maintenance tracking, and listing databases. Then select the dashboard template and configure KPI definitions. Ensure data quality rules are set so the dashboard stays accurate and up-to-date. A good solution supports seamless integration, meaning dashboards can connect to integrated systems without manual file uploads. Real estate professionals should also align dashboard views with daily workflow—leasing teams focus on occupancy and vacancies, agents focus on sales dashboards, and owners focus on financial performance. When onboarding is structured, dashboards become part of the real estate management system and support continuous improvement across operations.
Solutions tailored for agents, managers, and owners
Real estate dashboards must be tailored to role needs. Agents require CRM, marketing, and listing dashboards with productivity KPIs. Managers require operational dashboards for leasing, occupancy, and maintenance. Owners and investors require portfolio dashboards with NOI, cash flow, and ROI metrics. This is why solutions tailored by role increase adoption and reporting effectiveness. Dashboards can include different widgets, filters, and layouts for each user type. A scalable real estate dashboard package ensures the system evolves as the business grows—whether adding more properties, more agents, or new revenue lines. With customizable templates, organizations can build dashboards that fit their specific operating model and continue making data-driven decisions for better long-term value.
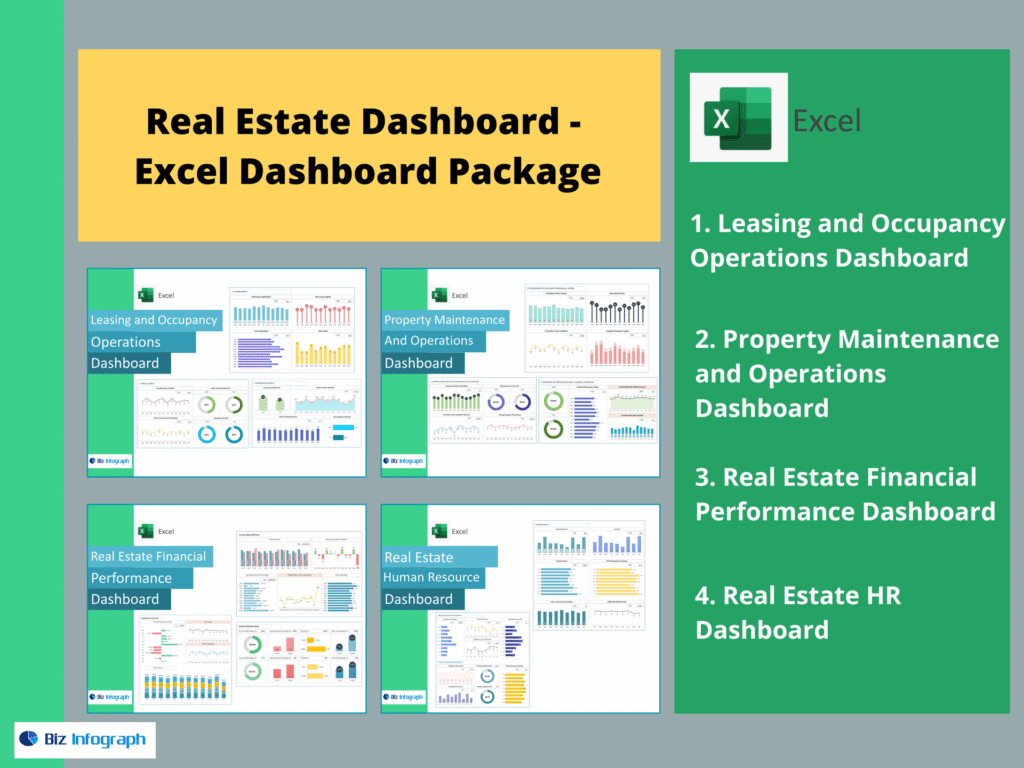
The 4 Dashboards Included in This Real Estate Package
A complete real estate dashboard package should include: Leasing and Occupancy Operations Dashboard, Property Maintenance and Operations Dashboard, Real Estate Financial Performance Dashboard, and Real Estate HR Dashboard. Together, these dashboards centralize leasing, maintenance, finance, and workforce KPIs—providing real-time insights, seamless integration, and a clear overview for agents, managers, and owners.
For ready-to-use Dashboard Templates: